

October 9, 2022
Latest Articles:
This newsletter issue focuses on recent problems with developed country sovereign bond markets and how energy supply constraints pose an ongoing problem for them.
The Sovereign Bond Bubble
During much of 2019 and 2020, large portions of the developed country bond market were outright negative in nominal terms. Rather than getting paid interest, investors had to pay for the privilege of lending to governments and even some corporations, mainly across Europe.
At its peak, the amount of negative-yielding bonds reached over $18 trillion:
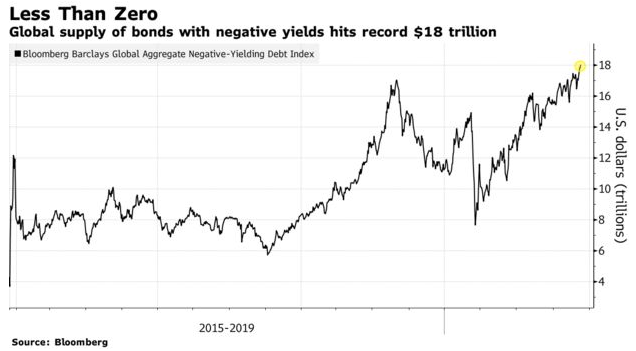
Chart Source: Bloomberg
In July 2019, I wrote an article focusing on the high probability that we were in a bond bubble. I opened the article by highlighting that even though I had some concerns about stocks, I was even more concerned about bonds:
I read thousands of emails from my readers, and one of the key themes I see is that people are concerned about the next stock market crash, and perhaps rightly so. By many measures we have high stock valuations in the United States after a decade-long bull market, and we have high corporate debt levels both inside the United States and globally.
But one question I rarely receive is: “Are bonds safe?”
From a historical perspective, the bond market is acting a lot weirder than the stock market at the current time. The stock market looks like it often does at this point in the business cycle, which is not great for the probable range of forward returns, but bonds are doing things they haven’t done ever before in history, which should give investors pause.
Since bonds are traditionally considered the safer asset class, should this be cause for concern? Are we in a bond bubble? Or is this just how things are now? This article examines the issue.
-Lyn Alden, July 2019 “Are We in a Bond Bubble, or is This the New Normal?“
Throughout the article, I went on to describe how a number of magazine covers and financial commentators were emphasizing the idea that inflation is dead, which I interpreted as a contrarian signal. Back then, and this seems ironic now, many central bankers were publicly lamenting that inflation was persistently below their targets.
I pointed out that in addition to the possibility of de-globalization and other inflationary trend shifts, the combination of aggressive fiscal policies by governments and debt monetization by central banks to support those fiscal policies, would be quite inflationary. Historically, highly-indebted countries with liabilities denominated in their own currency don’t default; they print and inflate their way out of it. As I wrote back then:
If central bank actions get more aggressive, combine with fiscal policies, and start targeting the middle class, they have the power to override these various deflationary forces with sheer monetary expansion. They can issue helicopter money to pay off debts, boost inflation, build infrastructure, bail out unfunded pension systems, and prop up the middle class if that’s what policymakers decide to do.
I wouldn’t want to be holding a 20-year or 30-year bond at super-low fixed yields in that kind of environment. Negative yields would be even more vulnerable.
-Lyn Alden, July 2019 “Are We in a Bond Bubble, or is This the New Normal?“
In early 2020 when the pandemic hit such a highly-leveraged (operationally and financially) global economy, it indeed triggered a series of global stimulus efforts by fiscal and monetary policymakers to prevent mass debt liquidations among businesses and households. A lower-debt economy could have withstood an economic shock like this without the need for as much stimulus, whereas a high-debt economy like what we have is inherently fragile and doesn’t deal well with cashflow interruptions.
As a result of the stimulus, developed countries had their biggest increases in broad money supply since the 1940s. Throughout 2020 and 2021, I began comparing the 2020s decade to the 1940s decade, and wrote at length about how this big blend of fiscal and monetary policy would likely be inflationary for broad prices.
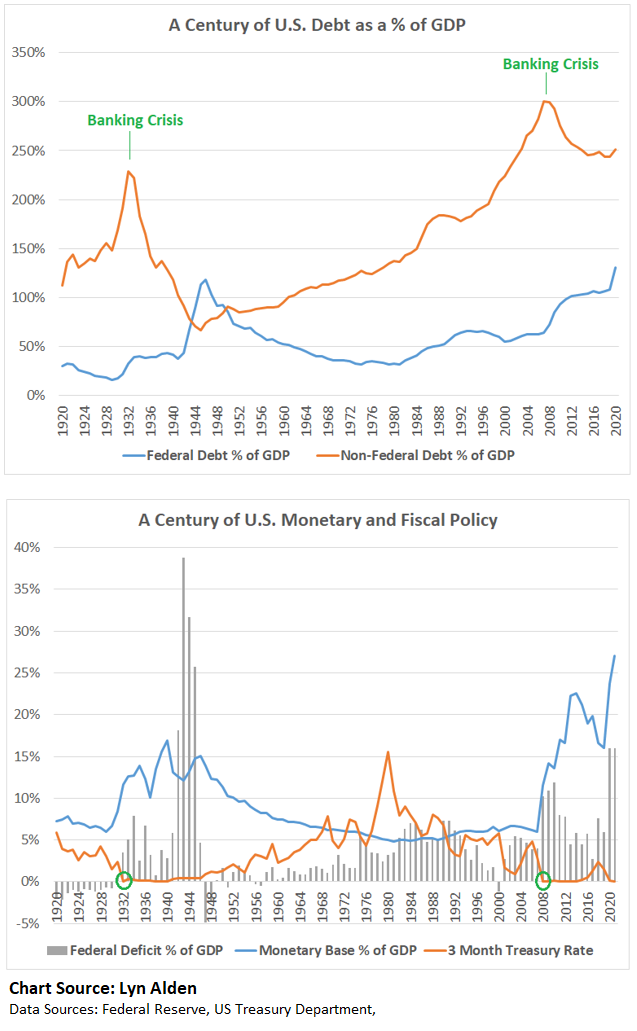
This chart is becoming due for an update by this point, but I still think it’s the most important chart for summarizing the macroeconomic context from a high level. It is probably the chart I have shown the most, in a few different forms, over the past few years:
Looking back on the past few years from the vantage point of late 2022, it certainly has been a wild ride. Year-over-year inflation reached above 2.5% in March 2021, and from there it took off quickly, up to over 9%. I was expecting significant inflation, but this was fast and strong even relative to what I would have guessed back then.
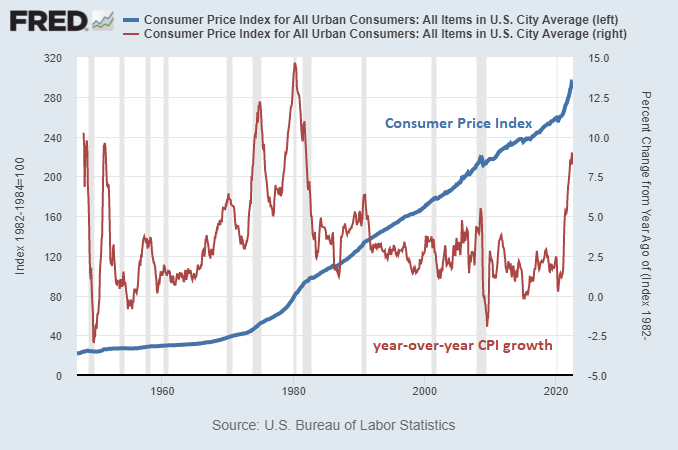
Chart Source: St. Louis Fed
It has been a broad and rolling set of price inflation ever since. At first this inflation was mainly attributed to transitory supply chain problems, but even things like rents and house prices were soaring, with so much money pumped into the economy and into consumers’ bank accounts. US gasoline prices reached record levels, and year-over-year wage inflation reached multi-decade highs.
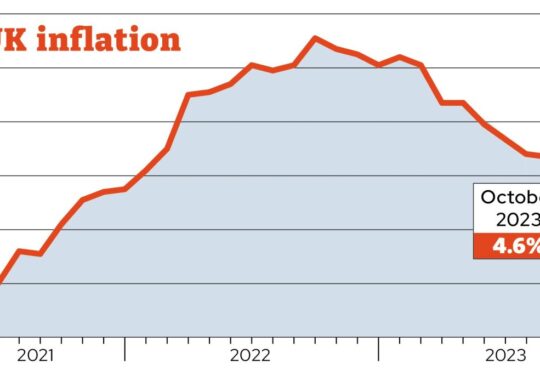
But Europe has had it worse than the United States. With Russia eliminating their gas flows to Europe, it resulted in skyrocketing natural gas prices, and by extension, electricity prices.
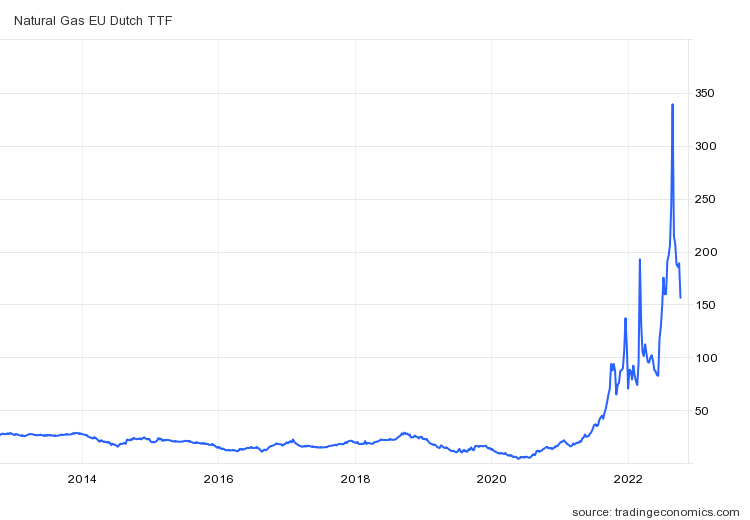
Due to this, the Netherlands currently has 14% official inflation, which is higher than any point they reached in the 1970s:
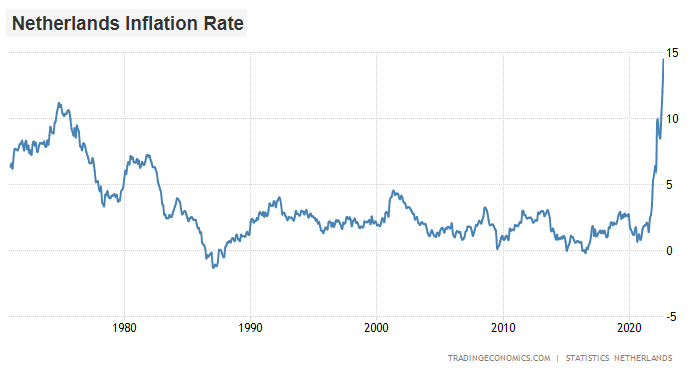
Poland has 17% year-over-year inflation. Germany’s inflation is 10% and climbing, and Italy’s is 9% and climbing.
With inflation coming in hot, nearly all of those $18 trillion in negative-yielding bonds are positive-yielding now. And when yields rise, it means bond prices fall.
Cash savers have lost purchasing power over the past couple years, and long-duration bondholders have been crushed even further in both nominal and inflation-adjusted terms.
European consumers have been impaired by these extremely high energy prices, and in many cases governments have stepped in to help alleviate their energy cost burden, but this comes with more debt and thus more sovereign bond issuance.
This chart shows historical drawdowns from all-time highs for the Bloomberg global aggregate bond index:
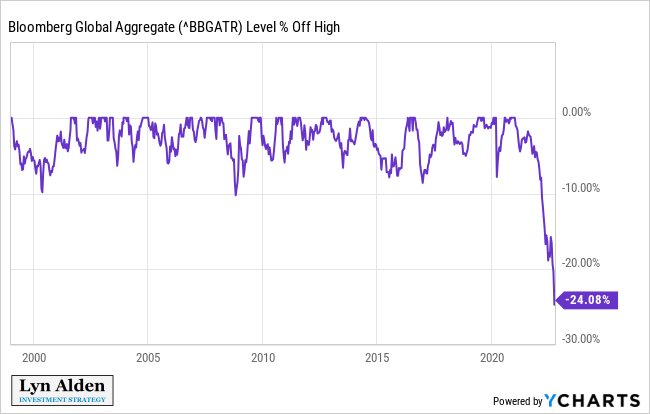
Chart Source: YCharts
United Kingdom Bond Blow-Up
The shortage of natural gas in Europe means that Europeans buy more liquified natural gas, which is a more portable global market but is constrained by expensive export and import infrastructure.
In other words, there is a hard limit on how much LNG export/import capacity exists in the world, and it takes time and money to build more. Europe’s increased purchases of LNG have therefore pushed up LNG prices for the rest of the world, which puts pressure on Japan and hurts energy-importing developing countries the most.
Back in my June 2022 newsletter, I wrote about an upcoming “checkmate” scenario for central banks, where they are forced to print money into a high inflation environment due to a combination of untenably high debt and commodity-driven inflation. Japan has over 250% public debt-to-GDP. Italy has over 150%. The UK and USA are both over 100%. The thesis here is that the macroeconomic environment is like the 1940s for them (high debt and high inflation), not like the 1970s (low debt and high inflation), and their sovereign bond markets therefore require support from central banks to avoid a fiscal spiral and nominal default. This support typically takes the form of yield curve control, yield curve management, and various other types of financial repression.
As I described the situation in June, the Bank of Japan and the European Central Bank were already in that checkmate situation, with those banks buying Japanese and Italian debt respectively despite above-target inflation in order to prevent yields from rising, while the US Federal Reserve, Bank of England, and some other developed market central banks were still holding hawkish for the moment but at risk of being unable to continue that path.
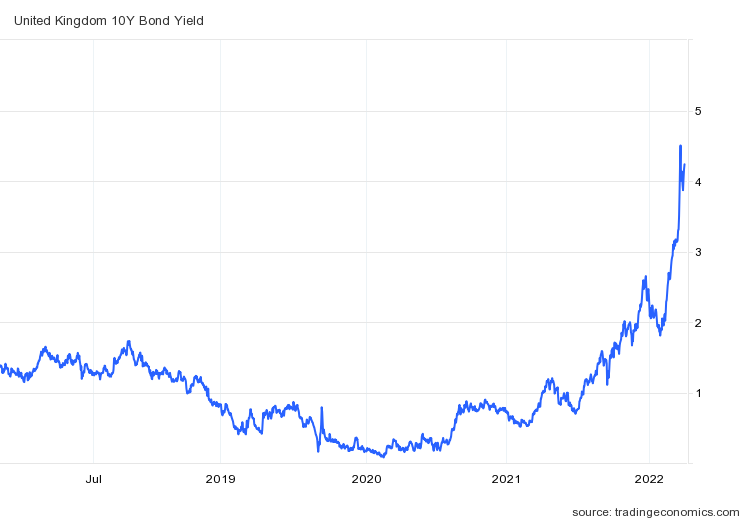
Well, in September, the Bank of England fell into that checkmated category too. Their sovereign bond market started to become extremely disorderly, with yields rapidly spiking (and thus prices rapidly falling) on long-duration government debt.
The UK pension system is a big holder of that debt, and with leverage, so some of them were getting margin called. When such large balance sheets all have the same type of asset, and that asset is selling off, then if a pension fund gets liquidated and is forced to sell some of their assets, it worsens the price for everyone else and triggers more margin call liquidations, which then worsens the price further and triggers more liquidations.
In other words, bond selling would trigger more bond selling which would trigger more bond selling, and there isn’t enough balance sheet capacity for other buyers to step in and fix that cascade since the biggest balance sheets in the country are the ones that are doing the selling. The market basically goes “no bid”.
To prevent that outcome, the Bank of England stepped in with emergency quantitative easing on September 28th, to buy those bonds and suppress the yields (and thus to keep the prices high, and to keep the whole UK pension system from getting margin called and throwing up their bonds all at the same time). Prior to this, the Bank of England was intending to reduce their balance sheet, and had a speech planned for September 29th to discuss balance sheet reduction, which they quickly cancelled.
So, the United Kingdom is currently in the same boat as Japan and various southern European countries, in having their central bank continue to buy their government debt amid high inflation, in order to suppress yields below the prevailing inflation rate, maintain fiscal solvency, and maintain pension system solvency.
They’ll probably be able to stop their intervention at some point, but the underlying issue is clear. Despite 10% inflation, the UK couldn’t let its government bonds go above 5% yields, due to so much leverage in the system. The result is financial repression, and the market comes to understand that there will always be a bid by central banks at points of acute disorder, to keep the sovereign bond market liquid and at low yields relative to inflation.
United States Bond Illiquidity
Among central banks, the US Federal Reserve is the 800 pound gorilla, but even they are starting to run into some issues with their hawkish monetary tightening plan.
Since the US is less reliant on external energy than much of Europe and Japan are, and because the dollar is the global reserve currency, the Fed has been able to be more hawkish than many other developed country central banks. But they still face similar problems in the country’s sovereign bond market.
US federal debt-to-GDP is about 125%, and pretty much for any country, it becomes nearly impossible to maintain positive inflation-adjusted yields when debt is over 100% of GDP.
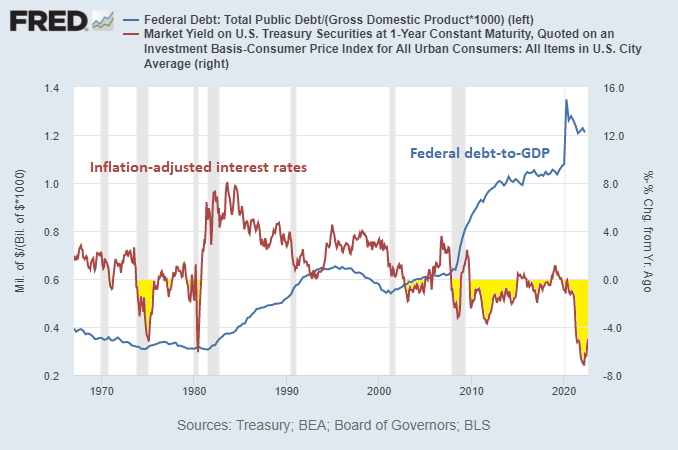
Chart Source: St. Louis Fed
The Fed is now doing quantitative tightening, meaning they are net sellers of Treasuries as they let bonds mature off of their balance sheet and choose not to reinvest the proceeds. Commercial banks, due to SLR regulations and other constraints, are also not buying Treasuries. The foreign sector in aggregate has been reducing their US Treasury holdings as well.
Foreign central banks accumulate Treasuries and other reserve assets when times are good. In other words, when their economies are growing, and when the dollar is weakening vs other currencies, they have flexibility to print currency and buy foreign assets. This is like a squirrel collecting nuts during times of abundance.
And then, during periods of recession, or when the dollar is sharply strengthening and their own currencies are weakening, these foreign central banks can sell some of their reserves and buy back their own currency, strengthening it. This is like a squirrel eating the nuts during the winter that it has previously collected.
Central banks buy or sell reserves assets in a counter-cyclical way to manage the volatility of their currency relative to the dollar. This chart shows the dollar index vs the portion of foreign-held Treasuries in custody with the Fed:
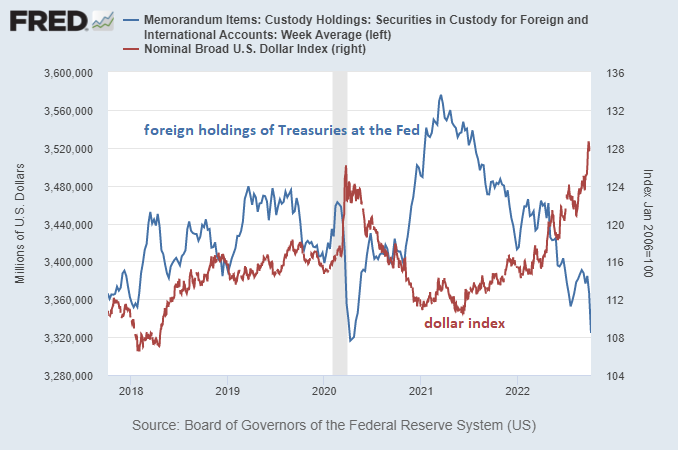
Chart Source: St. Louis Fed
Looking at the broader picture of over $7.5 trillion in Treasuries held by foreign sources of which this Fed custody snapshot represents about half), the amount has also been flat-to-down over the past year despite an increase in the amount of Treasuries outstanding. Foreign official sources (e.g. central banks) have been net sellers, while foreign private sources have been mild net buyers, with the overall amount being slightly down.
As a result, US Treasury market liquidity is very poor, and volatility is very high.
This is the MOVE index, which measures Treasury market volatility:
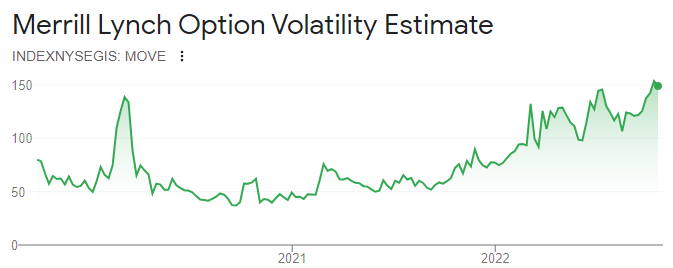
Chart Source: Google Finance
Back in March 2020, when the world shut down over COVID-19, it resulted in a big global dollar shortage. International dollar cash flows for many businesses dried up as trade plummeted, and yet the world had (and still has) a lot of dollar-denominated debt, mostly owed to entities in China, Europe, and Japan, and this debt needs to be serviced even if cash flows aren’t flowing.
So, many foreign entities sharply sold Treasuries to get dollars, which rendered the Treasury market acutely illiquid (basically “no bid” on some off-the-run securities), and forced an emergency meeting of the Fed to buy Treasuries. They ended up buying $1 trillion of Treasuries in three weeks, which was a record pace.
Here in autumn 2022, it has been a more gradual problem, with the dollar strengthening all year, and foreign central banks trimming their Treasury security exposure all year, which puts a lot of pressure on the US Treasury market. Its starting to reach very problematic levels. Last month, the Bank of Japan performed their first currency intervention in over two decades, as they sold $20 billion worth of reserves to put a bid under the yen.
My concern, and one that I’ve had since the springtime of this year, is that the US Treasury market is at risk of becoming acutely illiquid and disorderly like it did in March 2020, and like the UK government bond market just did in September 2022, assuming the Fed continues with their current approach. It’s not about the price of the bonds in that sense; it’s about who has the balance sheet capacity to hold them at any price, and about liquid market functioning.
And if that acute liquidity problem occurs, the Fed would need to buy Treasury bonds despite high inflation, much like the Bank of England just had to do. They could alternatively adjust SLR rules to have commercial banks absorb more Treasury bonds instead, but either way it would be a liquidity response to an emergency sovereign bond situation while inflation is still elevated.
There is also a possibility that the Fed will recognize it advance, and slow down rate hikes and other dollar-strengthening activities ahead of time, like the Reserve Bank of Australia has recently done. However, this does not seem to be the path that the Fed wishes to take, because they wish to be viewed as credible fighters of inflation.
Either way, once acute Treasury liquidity problems manifest themselves, or the Fed front-runs and avoids them by shifting policy, there’s a significant probability of it resulting in a top in the dollar index, meaning it would likely mark the end of this major dollar rally, and would be a catalyst for the next leg higher in many commodity prices, which fuels the existing inflation problem even more.
Until that pivot, there continues to be a good case for defensive portfolio positioning. After that pivot, we still need to be careful about which assets to own.
How Energy Challenges the Bond Market
When energy is abundant, it makes a lot of things easier. When energy is scarce, it leads to stagflation and a much less comfortable situation economically, socially, and politically.
Going into the 2008/2009 crisis, for example, there had been many years of strong oil prices and strong supply response to bring more oil and gas to market. When the severe recession hit, it reduced demand, which along with a supply glut, resulted in low energy prices.
For the 2010s decade as a whole, and especially the second half, OPEC fought with US shale producers over market share. New technology and zero interest rates incentivized a lot of US and Canadian shale oil and gas producers to bring new energy to market. It was often unprofitable, since capital costs were nearly free, but the narrative and the financing were all about growth. And OPEC was annoyed about this new unprofitable competitor pushing down global oil prices for everyone, until they struck back and flooded the market with supply to try to bankrupt some of this new unprofitable production threat.
For consumers, this fight over market share was a good thing. There was too much oil, and too much gas, relative to demand, and so prices were low. But that period is behind us now, and there is not much marginal capacity available globally, after years of low capital expenditures in the industry.
We are now in an energy-constrained world, and an increasingly fragmented one.
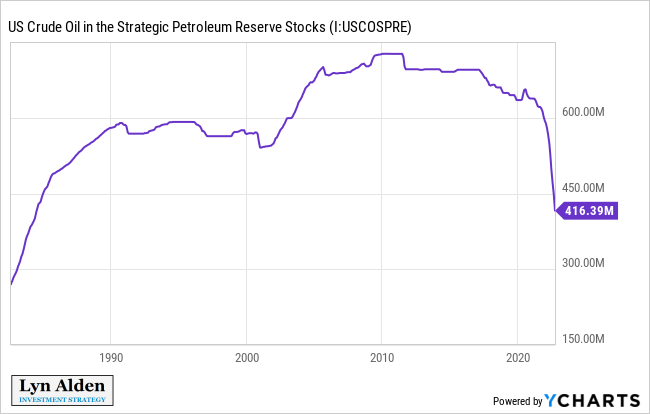
The US government is rapidly drawing down its Strategic Petroleum Reserve in order to put downward pressure on oil prices. This likely helps incumbent midterm election chances, because the Biden Administration has scored a near-term political win for getting energy prices under control, but it leaves the oil market in a more precarious position for 2023 when the US is no longer able to keep dumping this reserve supply onto the market.
Meanwhile, OPEC+ has cut production, which puts somewhat of a floor under prices. The issue under the surface, however, is that OPEC+ has already been failing to even meet their existing production quotas, and they likely have to reduce production due to physical realities rather than just geopolitical price-fixing choices.
Russia’s oil fields were worked in part by major western oil corporations, and the capital and equipment they bring with them. This is no longer the case, and so Russia is facing a capital and equipment hurdle in the coming years when it comes to maintaining and growing their recent production rate.
Similarly, Saudi Arabia and other OPEC countries were already running near the high end of their realistic capacity limits, and it’s hard to keep running at that pace.
There is no easy marginal supply ready to come to market. The US shale sector can continue to bring on more shale oil supply gradually, but due to fast decline rates, it takes quite a bit of capital just to maintain existing production rates, let alone quickly grow net new supply. Large offshore projects take years to become active wells.
Many European and North American politicians are bringing up policies such as export bans and windfall taxes that are not conducive to enticing new supply to come online, since it reduces clarity about the profitability of any long-term oil and gas production project. Big offshore oil wells, or big pipeline export terminals, for example, require billions of dollars and have a payback period that stretches many years into the future. If there is a reduction in certainty about what percentage of cash flows from a company’s energy sales that they’ll be able to keep, then it increases the hurdle for greenlighting the project and therefore can make it harder for new supply to come to market.
Meanwhile, Munich Re (the world’s largest reinsurer) just announced that it is ending insurance coverage for new oil and gas fields. A number of companies have adopted policies like this over the years, where they don’t invest or work with hydrocarbon companies. This forces hydrocarbon companies to be more self-contained, meaning they grow slower but become more profitable, and fund development out of profits rather than financing.
For as long as energy prices remain elevated due to these supply limitations, it means there will be upward pressure on inflation. Demand destruction from central bank tightening can keep a lid on prices for a period of time, but containing inflation that way is like holding a beach ball under water; it’s ready to pop right back up as soon as they stop holding it down.
Right now, we are in a period of US domestic economic deceleration, which might turn into an outright recession. Parts of Europe are already in recession. The oil price often follows this cycle, rising as the PMI rises, and dropping when the PMI drops.
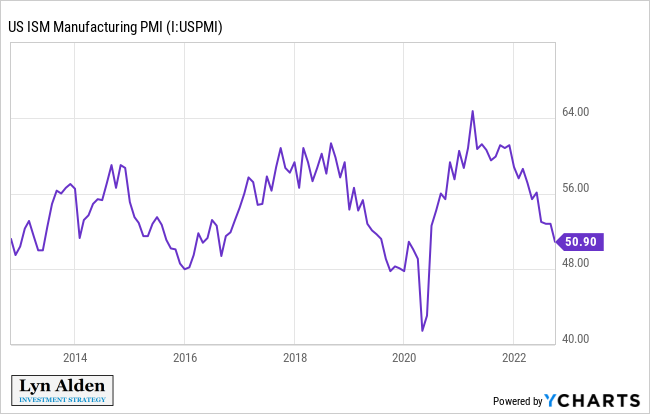
However, oil is currently over $90 despite the fact that we’re firmly in a down PMI cycle, Europe is facing recessionary conditions, the US is dumping its Strategic Petroleum Reserve onto the market, the US dollar is very strong relative to other currencies, and ongoing Chinese lockdowns reduce their marginal demand for oil. All of those are bearish factors for oil, and yet oil’s price remains elevated.
Whenever we get the next economic acceleration cycle, oil prices may very well be starting that demand increase from an already high price point, and ready to start climbing significantly from there. A year from now, probably with a rising PMI by that point, a functionally-depleted Strategic Petroleum Reserve, and a potential change in China’s lockdown policies, it’s not hard to envision a rather bullish environment for oil. The next several months remain quite uncertain, however.
This tight energy situation in my view is likely to keep pressure on the sovereign bond market for years, by making inflation always ready to return should the economy begin to re-accelerate. Until new energy supply comes online and the problem is fixed more structurally, energy-led inflation is a problem that can be temporarily suppressed but that can’t really be avoided.
Much like how the 1940s and 1970s had recurring waves of inflation (rather than just one big inflationary spike), my base case is that the 2020s decade will likewise have waves of inflation, led by energy.
Portfolio Updates
I have several investment accounts, and I provide updates on my asset allocation and investment selections for some of the portfolios in each newsletter issue every six weeks.
These portfolios include the model portfolio account specifically for this newsletter and my relatively passive indexed retirement account. Members of my premium research service also have access to three additional model portfolios and my other holdings, with more frequent updates.
I use a free account at Personal Capital
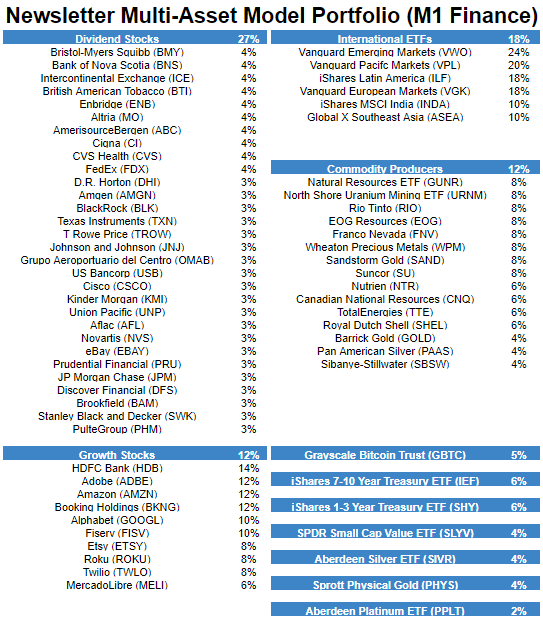
M1 Finance Newsletter Portfolio
I started this account in September 2018 with $10k of new capital, and I put new money in regularly. Currently I put in $1,000 per month.
It’s one of my smallest accounts, but the goal is for the portfolio to be accessible and to show newsletter readers my best representation of where I think value is in the market. It’s a low-turnover multi-asset globally diversified portfolio that focuses on liquid investments and is scalable to virtually any size.
I chose M1 Finance because their platform is commission-free and allows for a combo of ETF and individual stock selection with automatic and/or manual rebalancing. It makes for a great model portfolio with high flexibility, and it’s the investment platform I recommend to most people. (See my disclosure policy here regarding my affiliation with M1.)
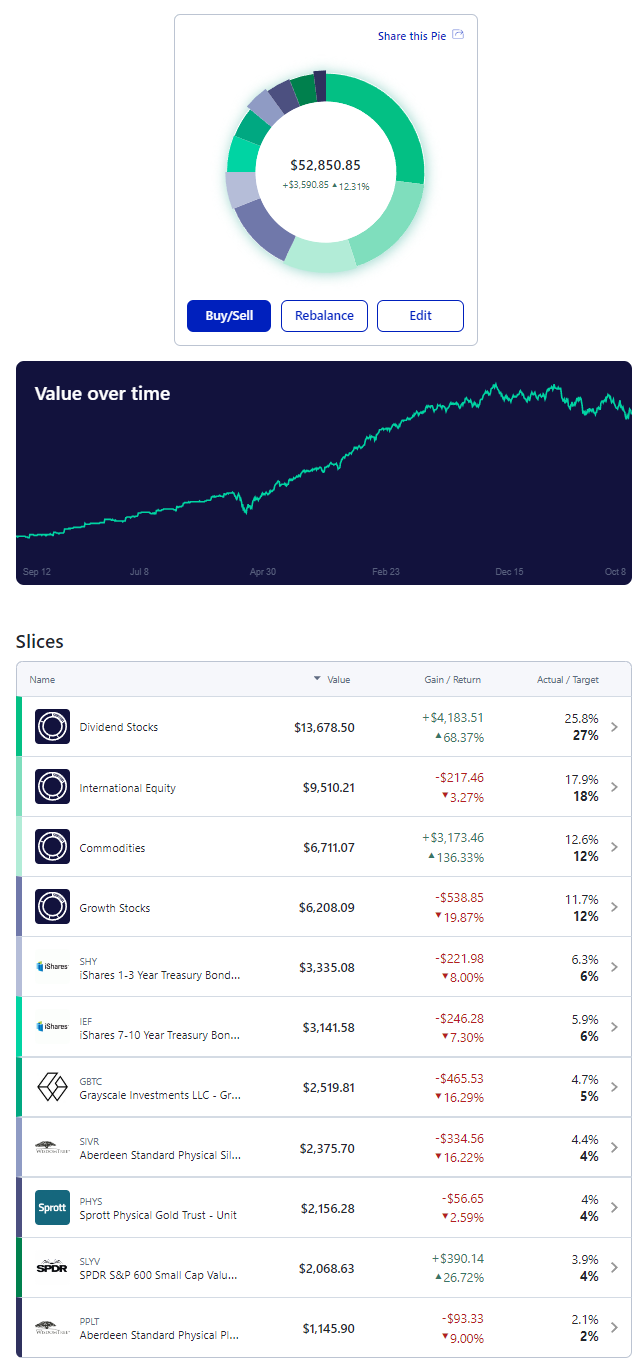
And here’s the breakdown of the holdings in those slices:
Changes since the previous issue:
Other Model Portfolios and Accounts
I have three other real-money model portfolios that I share within my premium research service, including:
-
-
- Fortress Income Portfolio
- ETF-Only Portfolio
- No Limits Portfolio
-
Plus I have larger personal accounts at Fidelity and Schwab, and I share those within the service as well.
Final Thoughts: Rising Debt + Rising Rates
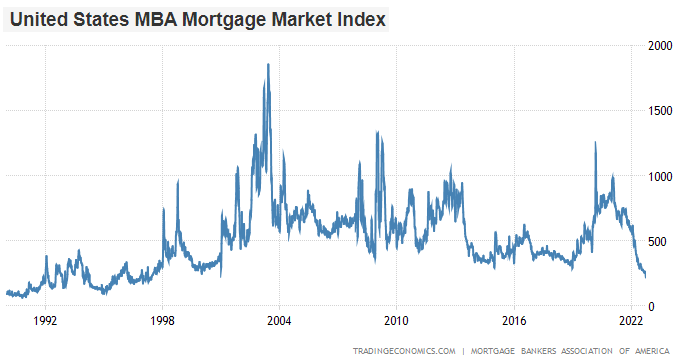
One of the most impactful aspects of higher interest rates is that it puts a brake on the housing market. Mortgage activity has fallen to multi-decade lows:
A 30-year mortgage for $300,000 at 7% rates has a cost of $1,996/month, vs only $1,347/month for the same mortgage at 3.5%. This makes many houses too expensive for new buyers, and/or eats heavily into their other monthly spending. This also makes existing homeowners less likely to sell and move, because they would be exiting from a cheap mortgage and into an expensive mortgage. The housing market therefore slows down, and this weighs on the economy.
The same is true for corporate bonds and other commercial borrowing. Debt that matures will be refinanced at higher interest rates over time, which eats into profits. Higher rates have also put considerable valuation pressure on corporate equities. So, both their earnings and their share price multiple on those earnings, are pressured.
This is why monetary policy operates with a lag. At first, higher rates and lower prices only affect the marginal market participant, such as for example someone that was planning to buy a house or move houses now, or that has a corporate bond ready for refinancing now. But as these policies remain in place, and people over time need to buy or move houses, or refinance corporate debt, it begins affecting more and more entities. The Fed’s existing monetary tightening will continue to affect new market participants going forward, as those participants buy or change houses or refinance any type of debt.
When we look out longer term, another issue is that higher interest rates make the federal debt increasingly more expensive to service. For decades, people have been warning about the federal debt eventually causing a crisis, and their dire predictions never seem to come true in the timeline that they thought. There were people worrying about rising debt in the 1980s and 1990s, for example, which seems quaint in hindsight.
This is because during the past four decades, the structural rise in federal debt to GDP was offset by a structural decline in interest rates.
As a result, interest expense as a share of GDP was flat, rather than up. Those declining rates made it considerably easier to keep servicing higher and higher debt levels.
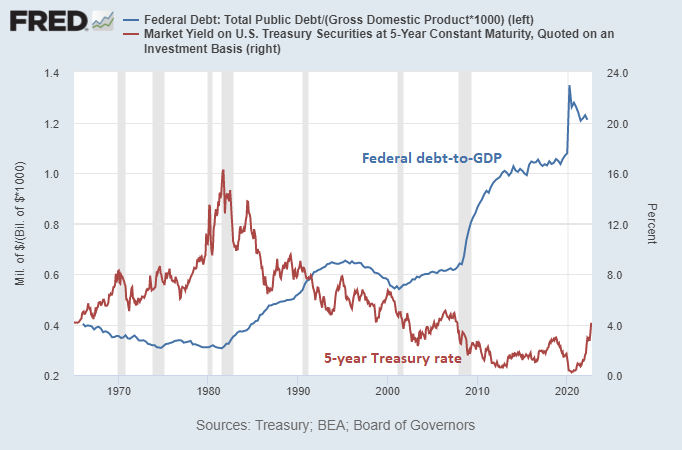
Chart Source: St. Louis Fed
However, as interest rates hit zero and then started trending sideways or up, it began shifting to a toxic combination of both higher debt and higher interest on that debt. Even if rates just go sideways now, that represents a major trend shift from the prior decades of structurally declining rates.
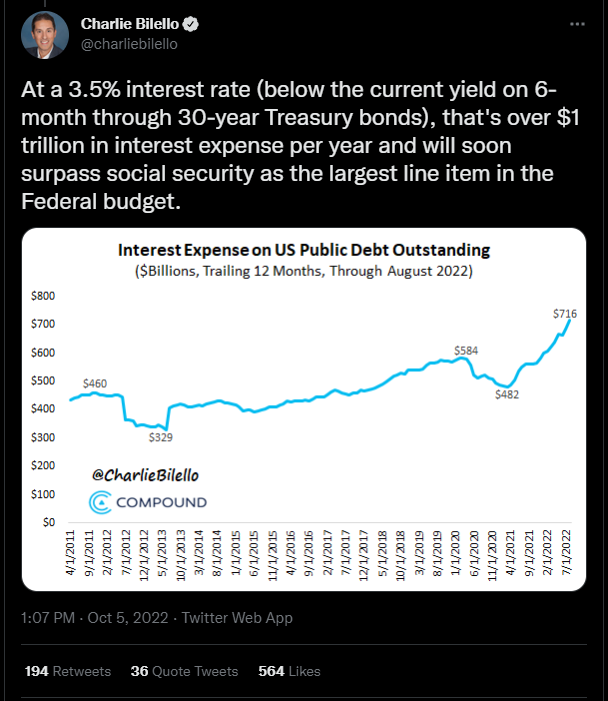
Source: @charliebilello
The US government is unlikely to make major cuts to Social Security or Medicare, given how popular those programs are among voters. They’re also unlikely to cut military spending while they’re in a geopolitical power competition with Russia and China. Lastly, they’re also unlikely to pass major tax hikes, assuming that the government remains relatively split between parties.
This means that the deficit will remain large and the government will have to issue more Treasuries in order to finance the larger deficits that come with higher interest expense. This is a concern, because as this newsletter issue already discussed, the Treasury market has been increasingly illiquid lately, with major pools of capital unable to keep buying.
For that reason, I view Treasury market functionality as one of the main constraints for how tight the Fed can make monetary policy, and I view inflation and deficit monetization to likely be a persistent or recurring issue this decade, albeit with occasional periods of disinflation as central banks briefly fight back (as is the case for 2022).
Once the Fed is put into a position where it is forced to re-liquify the Treasury market, this will open a serious possibility of a top in the dollar index, and would be a powerful catalyst for the next cycle higher in commodity prices.
However, I expect those higher commodity prices and labor prices to put pressure on the major stock indices, by eating into profit margins. US stock market capitalization reached approximately 200% of GDP back in 2021, and I don’t expect that level to be reached again for a very long time.
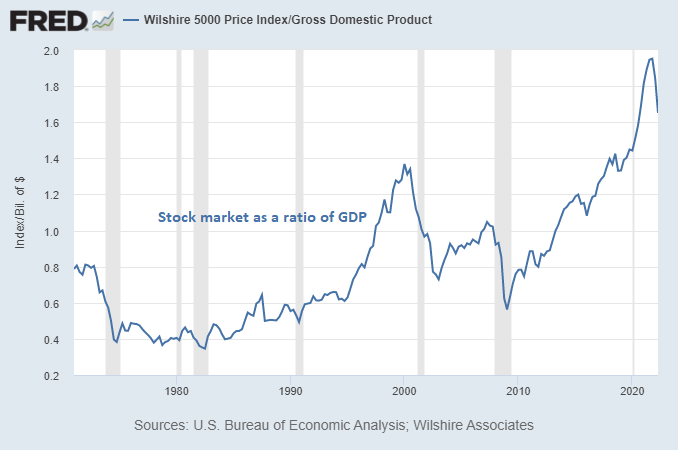
Chart Source: St. Louis Fed
Instead, I expect most of the investment opportunities for the remainder of this decade to consist of some combination of energy, commodities, precious metals, infrastructure, chemicals, biotech, bitcoin, and select foreign markets.
Best regards,


