

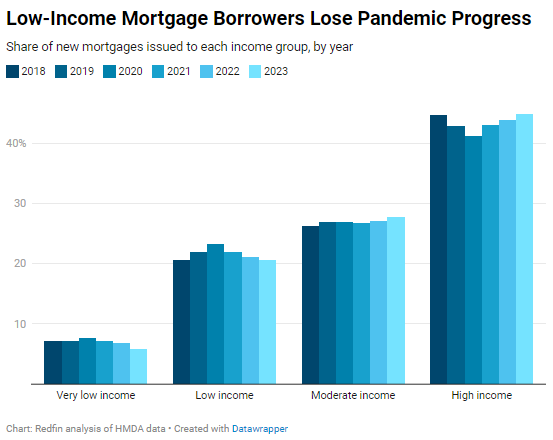
Roughly 1 in 5 new mortgages went to low-income homebuyers in 2023, down from 23% in 2020. Meanwhile, high-income buyers have gained share because they’re more prepared to weather the storm of high home prices and mortgage rates.
Roughly one in five (20.6%) new mortgages issued last year went to low-income Americans, bringing that group’s piece of the homebuying pie back down to where it was in 2018. Low-income earners gained ground at the start of the pandemic, taking out 23.2% of all new mortgages in 2020, but that progress has since been erased because high home prices and elevated mortgage rates have eroded affordability.
This is according to a Redfin analysis of Home Mortgage Disclosure Act (HMDA) data covering purchases of primary homes. It does not cover purchases of investment properties or second homes. We categorized home purchasers into four groups according to their household income: Very low, low, moderate and high (see the methodology section for further details). Nationwide, the median household income in the HMDA data for very-low-income households who purchased a home in 2023 was $41,000. It was $64,000 for low-income households, $96,000 for moderate-income households and $172,000 for high-income households. The estimated median overall household income in the U.S. was roughly $84,000 in 2023.
The small bit of progress that Americans earning very low incomes made on taking out mortgages at the start of the pandemic has also been erased. Just under 6% of new mortgages issued last year went to very low income Americans, down from 7.7% in 2020. Very-low-income Americans now make up a smaller percentage of mortgage borrowers than they did in 2018 (7.1%).
Higher-income homebuyers are taking up the share of new mortgages that lower-income homebuyers have lost in the last several years. While low-income borrowers gained share during the pandemic and then lost it, the opposite has happened with high-income borrowers, who are more prepared to weather the storm of high prices and rates. Nearly half (44.8%) of all new mortgages nationwide went to high-income buyers in 2023, bringing that group’s piece of the pie back up to almost exactly where it was in 2018. Their share dipped to a low of 41.2% in 2020.
Homebuying has become increasingly out of reach for lower-income people because housing affordability dropped to a record low in 2023 due to sky-high home prices and mortgage rates. Affordability hasn’t improved during the first few months of 2024:
-
- Home prices: Today’s median-home sale price is about $420,000, up 5% year over year. That’s up nearly 40% since the start of the pandemic in March 2020 and up nearly 50% since March 2019.
- Mortgage rates: Today’s average 30-year mortgage rate is about 7.2%, up from 6.43% a year ago and more than double the record low of 2.65% in 2021. It’s also higher than the 4% to 5% levels in 2018 and 2019.
- Monthly payments: The typical homebuyer’s monthly payment is now a record-high $2,886, up 13% year over year. That’s up from just over $1,500 in both March 2020 and March 2019.
- Down payments: The typical down payment for someone putting down 20% is $84,000, up from $80,200 a year ago, $60,800 in March 2020 and $56,800 in March 2019.
While the U.S. economy is fairly strong, unemployment is low and wages are increasing, housing costs are increasing much faster. Hourly wages are up roughly 5% year over year, while monthly housing costs are up 15%. Surging housing costs have an outsized impact on low earners, who are less likely to have money in the bank for down payments and record-high monthly payments.
“There was a sweet spot in 2020 when mortgage rates were ultra low and home prices had yet to skyrocket, allowing some lower-income Americans to break into the housing market,” said Redfin Senior Economist Elijah de la Campa. “But somewhat ironically, the continued strength of the economy has made it harder to afford a home and widened the real-estate wealth gap between rich and poor Americans. The Fed’s interest-rate hikes, meant to help cool inflation and slow a hot economy, have pushed mortgage rates to near their highest level in more than two decades. That’s on top of home prices, which skyrocketed during the pandemic buying boom and have stayed high due to a shortage of homes for sale.”
It’s also important to note that due to the prevalence of all-cash home purchases in today’s market, housing wealth is even more concentrated in the hands of affluent Americans than the mortgage data discussed above shows. More than one-third of all U.S. home purchases were made in cash as of February, near the highest level on record, and the share has steadily been rising since 2020.
Housing affordability may improve once the Fed cuts interest rates, which could happen later this year or early next year and which would push down mortgage rates. Alternatively, if rates stay high longer than expected, the blow to buyers’ budgets could eventually cause home prices to drop.
While high-income Americans made up the biggest piece of last year’s homebuying pie, people at all income levels purchased far fewer homes in 2023 than the year before. The number of U.S. homes bought by high-income earners fell 19% year over year in 2023, and it fell 18% for moderate earners, 22% for low-income earners and 31% for very-low-income earners. That’s because housing costs shot up due to rising home prices and mortgage rates, and inventory dwindled.
Low-income earners take up biggest share of homebuying pie in Minneapolis, Detroit
Low-income earners take up the biggest piece of the homebuying pie in relatively affordable Midwest and East Coast metros, where home prices are lower. Nearly one-third (32.1%) of new mortgages issued last year in Minneapolis went to low-income earners, the highest share of any of the 50 most populous U.S. metros. It’s followed by Detroit (30.8%), Philadelphia (29.9%), Virginia Beach, VA (29.7%) and Baltimore (28.3%).
Low-income earners gained mortgage share from 2020 to 2023 in just three of the metros in this analysis: Chicago (26.5% to 27.7%), Cleveland (26.4% to 27.8%) and Washington, D.C. (26.8% to 27.1%).
Just 1.9% of new mortgages issued last year in Anaheim, CA, went to low-income earners, the lowest share in this analysis. Next come Los Angeles (3.6%), Miami (4.4%), San Diego (5.5%) and San Francisco (6.1%). Those California metros are among the most expensive places to buy a home in the country.
| Metro-level summary: New mortgages by income level
50 most populous U.S. metros 2023, except where otherwise noted |
|||||
| U.S. metro area | Share of new mortgages issued to very-low-income earners | Share of new mortgages issued to low-income earners | Share of new mortgages issued to middle-income earners | Share of new mortgages issued to high-income earners | Median sale price (March 2024) |
| Anaheim, CA | 1.9% | 1.9% | 10.2% | 82.4% | $1,155,000 |
| Atlanta, GA | 4.5% | 22.6% | 28.8% | 43.6% | $395,000 |
| Austin, TX | 3.3% | 18.2% | 29.5% | 48.6% | $450,000 |
| Baltimore, MD | 10.2% | 28.3% | 26.3% | 34.8% | $360,000 |
| Boston, MA | 4.8% | 19.1% | 27.8% | 47.5% | $710,000 |
| Charlotte, NC | 5.1% | 19.4% | 27.3% | 47.4% | $395,000 |
| Chicago, IL | 9.0% | 27.7% | 26.6% | 35.9% | $339,000 |
| Cincinnati, OH | 11.6% | 27.0% | 26.3% | 34.3% | $280,000 |
| Cleveland, OH | 12.8% | 27.8% | 24.0% | 34.5% | $203,000 |
| Columbus, OH | 7.9% | 23.9% | 27.0% | 40.2% | $330,000 |
| Dallas, TX | 2.0% | 14.5% | 26.8% | 56.0% | $425,000 |
| Denver, CO | 4.4% | 20.8% | 31.7% | 42.5% | $591,000 |
| Detroit, MI | 19.6% | 30.8% | 23.8% | 23.9% | $175,000 |
| Fort Lauderdale, FL | 1.9% | 9.0% | 23.0% | 65.4% | $450,000 |
| Fort Worth, TX | 2.6% | 20.9% | 31.6% | 44.3% | $352,000 |
| Houston, TX | 2.2% | 17.0% | 27.6% | 52.6% | $330,000 |
| Indianapolis, IN | 9.6% | 26.7% | 27.2% | 36.1% | $295,000 |
| Jacksonville, FL | 4.2% | 20.8% | 29.9% | 44.6% | $375,000 |
| Kansas City, MO | 11.1% | 26.1% | 25.5% | 36.6% | $307,000 |
| Las Vegas, NV | 2.1% | 13.4% | 30.1% | 54.1% | $432,000 |
| Los Angeles, CA | 1.6% | 3.6% | 16.0% | 76.4% | $879,000 |
| Miami, FL | 0.6% | 4.4% | 19.5% | 74.5% | $560,000 |
| Milwaukee, WI | 9.2% | 25.6% | 24.4% | 40.0% | $302,000 |
| Minneapolis, MN | 12.2% | 32.1% | 27.1% | 28.0% | $368,000 |
| Montgomery County, PA | 3.8% | 17.3% | 26.6% | 51.6% | $451,000 |
| Nashville, TN | 4.2% | 20.8% | 28.0% | 46.4% | $459,000 |
| Nassau County, NY | 1.3% | 8.4% | 28.2% | 59.7% | $645,000 |
| New Brunswick, NJ | 3.8% | 16.3% | 27.7% | 51.1% | $509,000 |
| New York, NY | 1.9% | 10.0% | 23.3% | 60.0% | $710,000 |
| Newark, NJ | 2.5% | 13.7% | 28.2% | 54.4% | $535,000 |
| Oakland, CA | 2.7% | 13.0% | 25.3% | 58.0% | $983,000 |
| Orlando, FL | 1.7% | 11.4% | 29.0% | 57.3% | $403,000 |
| Philadelphia, PA | 19.3% | 29.9% | 21.7% | 28.6% | $270,000 |
| Phoenix, AZ | 3.3% | 18.9% | 31.1% | 46.1% | $459,000 |
| Pittsburgh, PA | 13.1% | 26.7% | 24.6% | 34.8% | $223,000 |
| Portland, OR | 2.9% | 16.8% | 31.0% | 48.7% | $540,000 |
| Providence, RI | 3.7% | 20.9% | 35.4% | 39.4% | $460,000 |
| Riverside, CA | 1.7% | 6.5% | 25.5% | 65.0% | $570,000 |
| Sacramento, CA | 2.1% | 14.7% | 30.1% | 52.7% | $578,000 |
| San Antonio, TX | 2.3% | 18.7% | 30.2% | 48.3% | $310,000 |
| San Diego, CA | 0.8% | 5.5% | 21.3% | 71.4% | $898,000 |
| San Francisco, CA | 1.8% | 6.1% | 13.5% | 76.4% | $1,550,000 |
| San Jose, CA | 1.6% | 7.1% | 19.4% | 70.8% | $1,609,000 |
| Seattle, WA | 2.9% | 13.0% | 25.9% | 57.4% | $830,000 |
| St. Louis, MO | 13.3% | 26.7% | 24.9% | 34.4% | $246,000 |
| Tampa, FL | 2.3% | 14.9% | 29.7% | 52.3% | $370,000 |
| Virginia Beach, VA | 4.7% | 29.7% | 31.3% | 34.0% | $342,000 |
| Warren, MI | 9.3% | 23.6% | 26.3% | 39.4% | $285,000 |
| Washington, DC | 8.4% | 27.1% | 29.4% | 34.7% | $555,000 |
| West Palm Beach, FL | 1.7% | 8.7% | 20.6% | 68.0% | $514,000 |
Methodology
This is according to a Redfin analysis of Home Mortgage Disclosure Act (HMDA) data covering purchases of primary homes from 2018-2023. It does not cover purchases of investment properties or second homes.
We broke home purchasers down into four income levels: Very low, low, moderate and high. Purchasers were classified according to the relationship between their reported household income and the median household income of the county in which they purchased their home, otherwise known as their Area Median Income (AMI). Those with reported incomes of 50% or less of their AMI are classified as very low income, those at 51% to 80% of their AMI are classified as low income, those at 81% to 120% of their AMI are classified as moderate income, while those at 121% or more of their AMI are classified as high income. 2023 AMI data come from the Federal Housing Finance Agency (FHFA). On a national scale, the median household income for these four groups of 2023 home purchasers translates to $41,000, $65,000, $96,000, and $172,000, respectively.
The U.S. median household income for 2023 is estimated using the U.S. Census Bureau’s (ACS) 2022 median household income and 12-month moving average nominal wage growth rates compiled from the Current Population Survey and reported by the Federal Reserve Bank of Atlanta.


