

Rocket Lab USA RKLB is an “end-to-end space company delivering launch services, spacecraft, satellite components, and on-orbit management”. Let’s check out the charts and indicators.
In this daily bar chart of RKLB, below, I can see a mixed picture. Prices have rallied since April and have doubled in price. RKLB trades above the rising 50-day moving average line and is getting close to extended (overbought) relative to the 200-day moving average line. The trading volume has increased in the past three months.
The On-Balance-Volume (OBV) line has been moving up and down since October. The trend-following Moving Average Convergence Divergence (MACD) oscillator is above the zero line but narrowing towards a potential take profit sell signal.
In this weekly Japanese candlestick chart of RKLB, below, I see a mixed picture. Lagging indicators like the 40-week moving average line are positive but a recent candle pattern shows us an upper shadow telling me that traders rejected the highs. A small spinning top could be the second candle in a top reversal pattern. A weak (red) candle this week would give us a reversal.
The weekly OBV line shows strength with the latest data point dipping. The MACD oscillator is bullish.
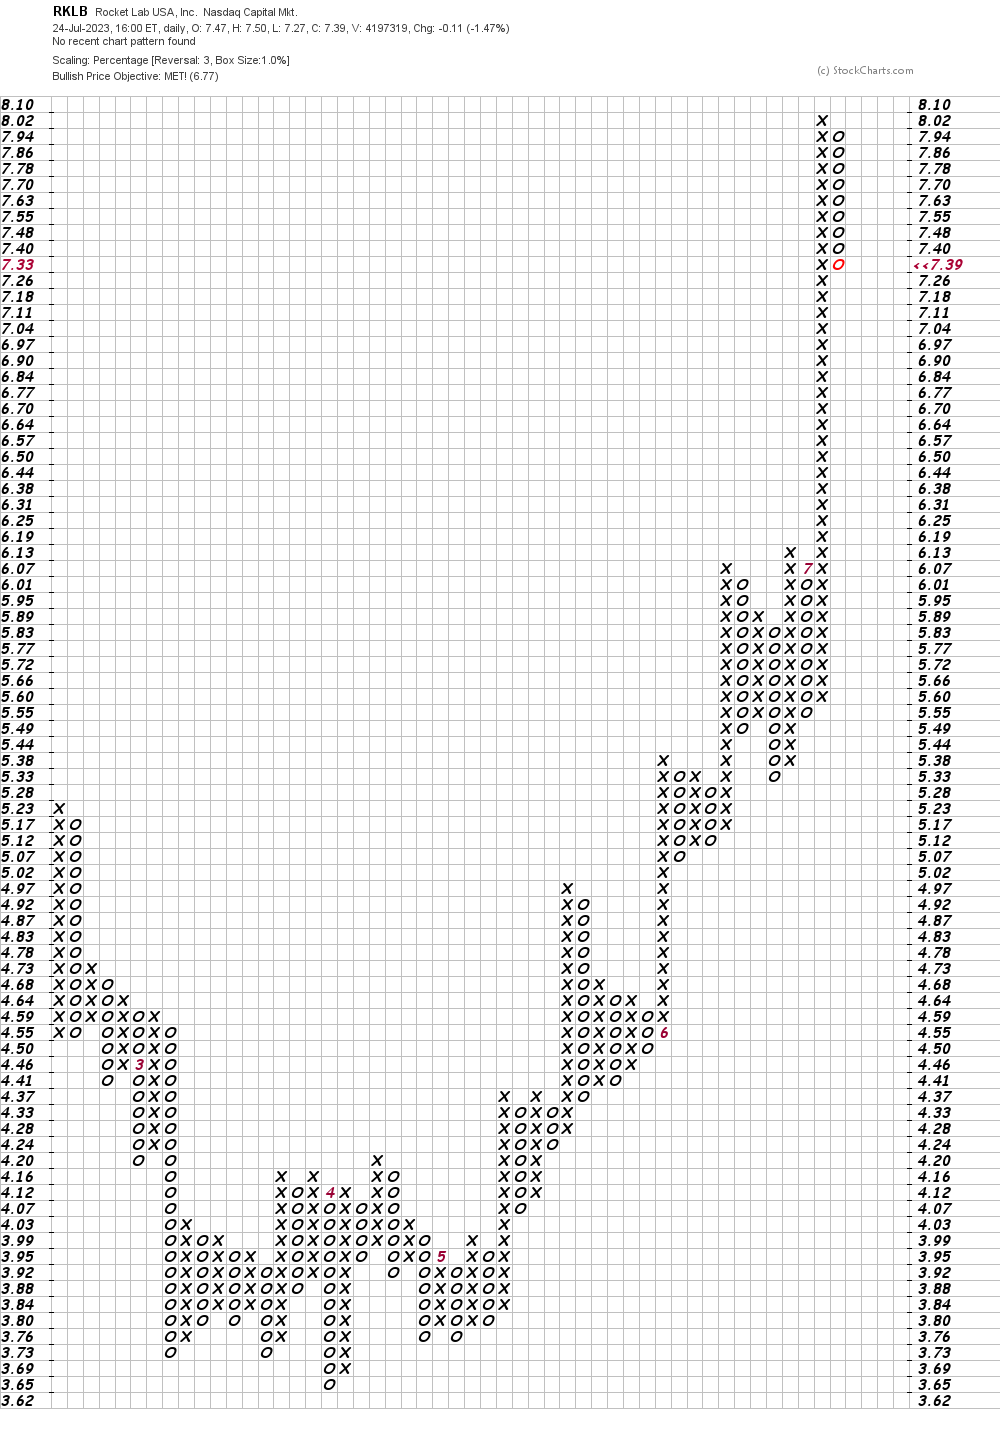
In this daily Point and Figure chart of RKLB, below, I can see that prices reached and exceeded a price target in the $6.77 area.
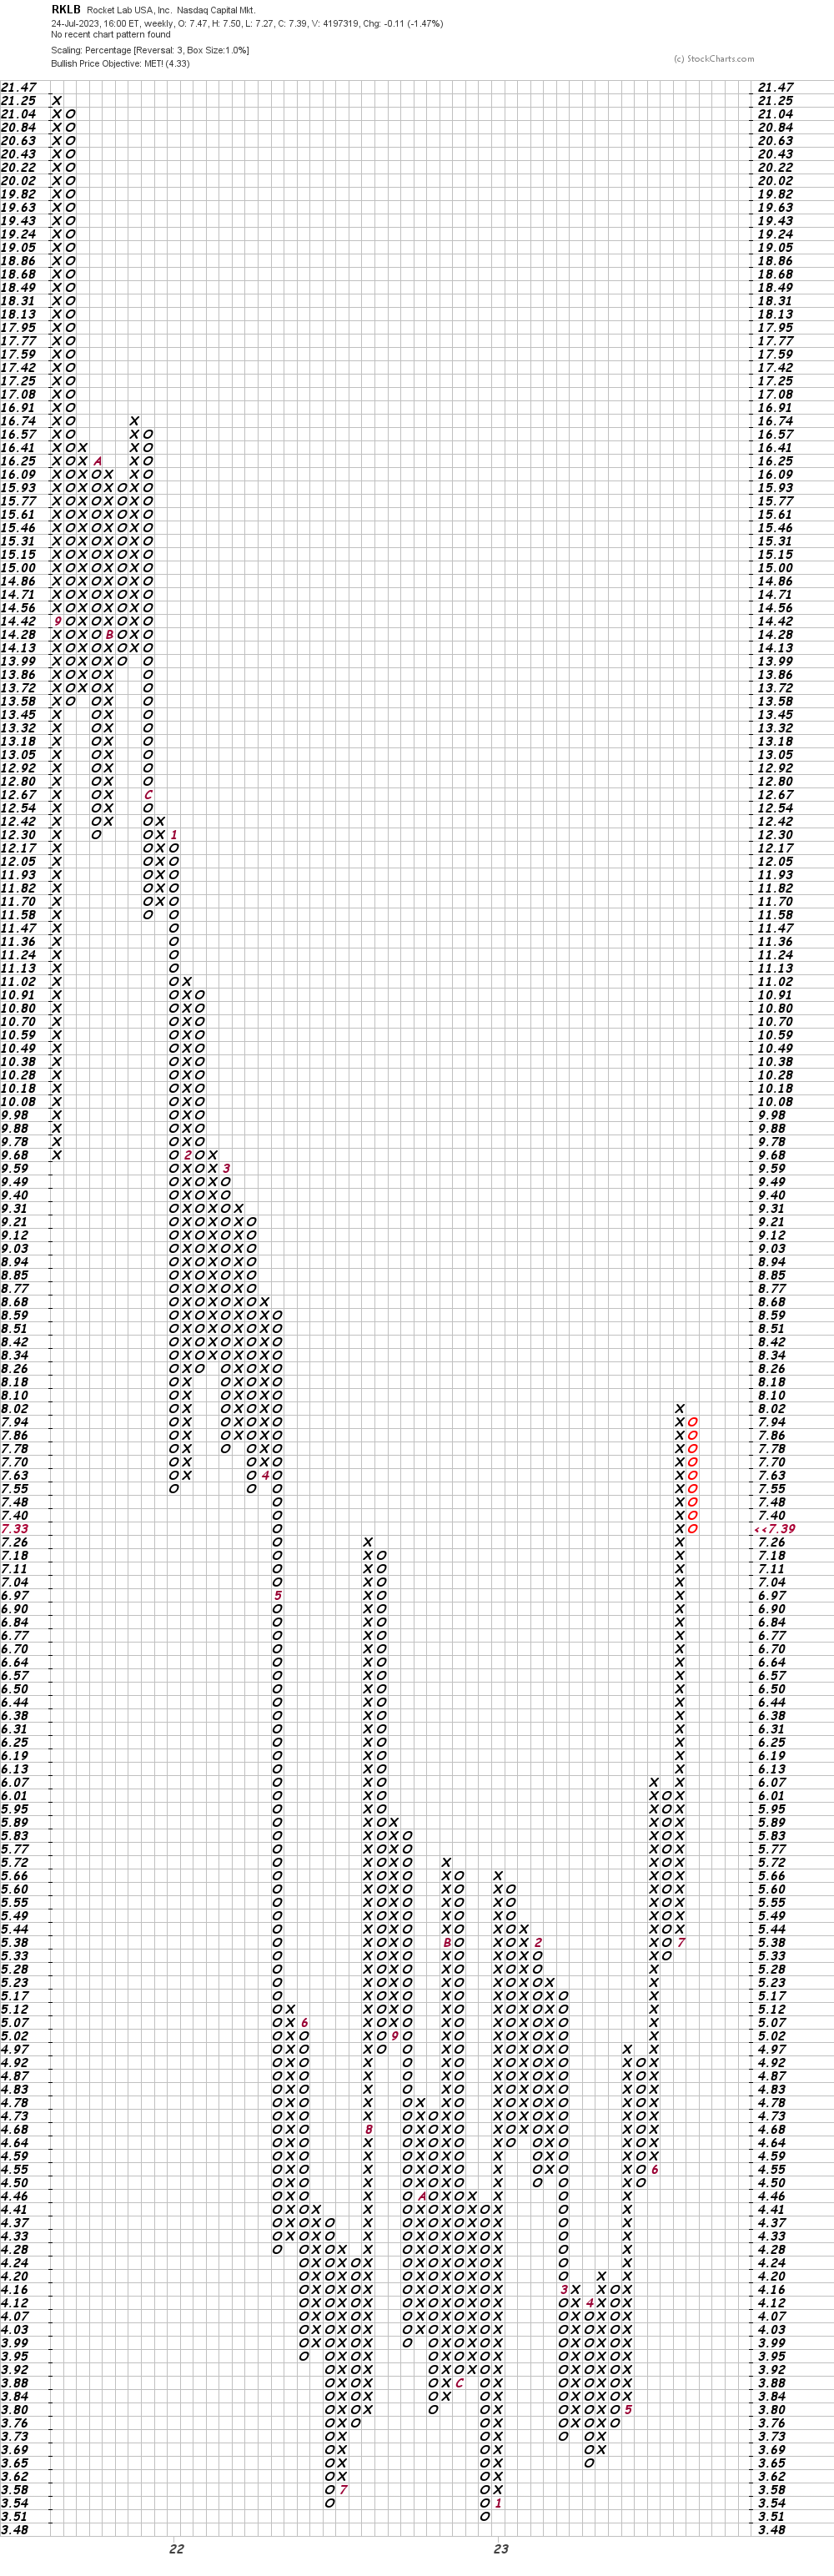
In this weekly Point and Figure chart of RKLB, below, I can see that prices reached and exceeded a price target in the $4 area.
Bottom line strategy: Traders who are long RKLB should probably reduce their exposure. I would take profits and wait for a 50% retracement before considering buying again.
Get an email alert each time I write an article for Real Money. Click the “+Follow” next to my byline to this article.


