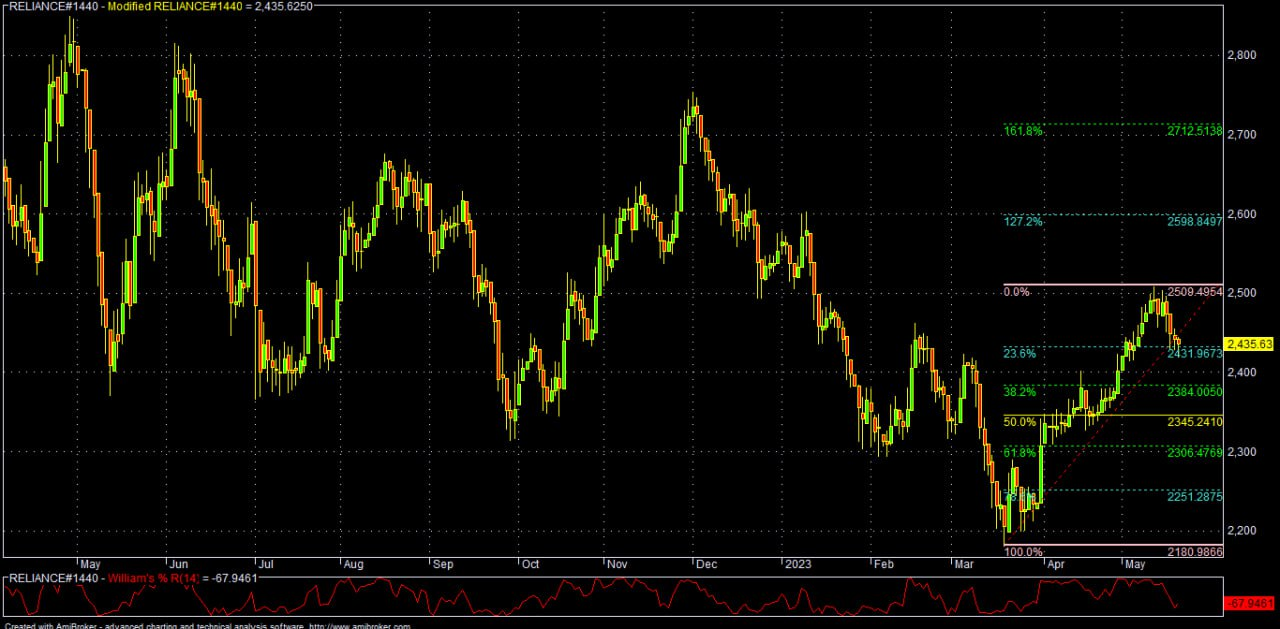
Reliance Industries Ltd (NS:) made a high of around 2509.50 on 11th May after reporting an upbeat report card (Q4FY23) in the last week of April. Also, positive global cues, lower/nil windfall tax of exports of refined products, and a report that RIL may acquire Chinese auto/EV maker MG Motors boosted the stock. But RIL stumbled soon after scaling a multi-week high in line with the falling due to the US debt limit soap opera and the concern of another Fe rate hike in June.
Additionally, RIL was affected as RIL withdrew from FRL(Big Bazar) bid under IBC, but RIL has already acquired most of the Big Bazar premises (shopping mall) in various prime locations and operating ‘Smart Bazar’, which is equivalent to acquiring ‘Big Bazar’ indirectly (back door entry).
In FY23, RIL was a big beneficiary of the Russia-Ukraine war/geo-political tensions and subsequent economic sanctions on Russian oil, especially in Europe/the EU. RIL bought Russian oil cheap, refined it and sold the same with a good margin as eventually Europe/EU has to buy gasoline/other oil-refined products from somewhere (instead of Russia) for its requirements. Various other Indian and also Chinese refiners are exporting such cheap Russian-sourced oil to the EU after refining the same and earning ‘windfall’ profits.
But the EU is now raising various political objections to such back door entry of Russian oil by Indian and Chinese refiners. In 2nd week of May’23, the EU Foreign Policy Chief Borrell said: “If diesel or gasoline is entering Europe– coming from India and being produced with Russian oil, that is certainly a circumvention of sanctions and member states have to take measures. That India buys Russian oil, it’s normal— But if they use that to be a centre where Russian oil is being refined and by-products are being sold to us— we have to act”.
Officially, the EU refrained from point-fingering to India and preferred to have a discussion on the issue with the essence of cooperation, keeping in mind good diplomatic relations with India (under the Modi admin). But, Indian Foreign Minister Jaishankar blasted the EU for such Russian oil comments, reminded the EU to look into its record for importing Russian oil directly/indirectly and also pointed out that as far as his understanding of EU sanctions rules, Russian crude substantially transformed/refined in a third country was no longer considered to be a Russian product, and may be exported to EU (without breaking any sanction rules).
Although the EU may not take any serious action on Indian oil refiners like RIL at this time considering good diplomatic relations with India/Modi admin and PM Modi’s ability to maintain good relations with both Russia-U.S./EU, there is a risk in RIL’s EU oil revenue/margin in future. Also, if there is a peaceful resolution of the Russia-Ukraine war and subsequent lifting of oil sanctions on Russia by the EU (for their interest) in the coming days, RIL’s EU business for O2C may be negatively affected (at least EBITDA margin). Thus RIL stumbled soon after EU comments about Russian-originated oil.
But RIL is a great stock for investment purposes and investors may buy/accumulate the same at major dips.
Summary of latest report card: Q4FY23 (Consolidated: INR 100 Cr. =1B)
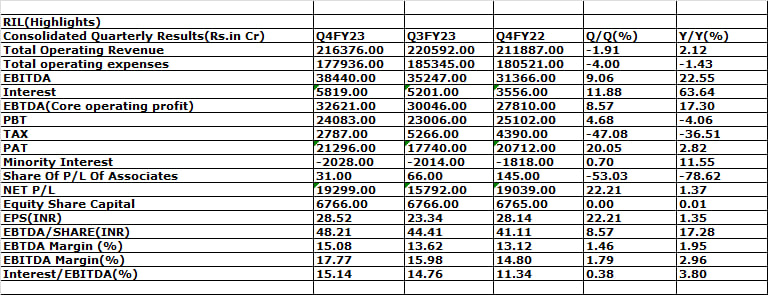
- Operating revenue Rs.2163.76B vs 2205.92B sequentially (-1.91%) and 2118.87B yearly (+2.12%)
- The annual revenue growth was supported by upbeat momentum in consumer business led by digital services (+15.4%); retail (+19.4%) and oil & gas (+50%) due to higher price realizations/spreads
- But annual revenue was also dragged from O2C (oil to chemical) business amid sharp increases in prices and lower price realization on downstream projects (lower realizations/spreads)
- Operating expense Rs.1779.36B vs 1853.45B sequentially (-4.00%) and 1805.21 yearly (-1.43%)
- EBITDA Rs.384.40B vs 352.47B sequentially (+9.06%) and 313.66B yearly (+22.55%)
- Higher EBITDA due to strong growth and higher margins in digital business, favourable mix, sourcing benefits, and operating efficiencies in the retail segment; higher transportation fuel cracks and optimized feedstock cost
- But EBITDA was also partially offset by lower downstream chemical margins in the O2C segment coupled with better gas price realization and higher volumes in the oil & gas segment
- Net interest paid Rs.58.19B vs 52.01B sequentially (+11.88%) and 35.56B yearly (+63.64%)
- Higher interest due to higher borrowing costs (rising bank rates and bond yields) and higher debt (loan balances)
- Gross debt Rs.3147.08B vs 3035.30B sequentially and 2663.05B yearly
- Higher debt primarily to fund 5G/telecom/digital, EV, and retail expansion CAPEX
- Core operating profit (EBTDA=EBITDA-INTT) Rs.326.61B vs 300.46B sequentially (+8.57%) and 278.10B (+17.30%)
- Core operating EPS (EBTDA/Share) Rs.48.21 vs 44.41 sequentially (+8.57%) and 41.11 yearly (+17.28%)
- EBITDA margin 17.77% vs 15.98% sequentially (+179 bps) and 14.80% yearly (+296 bps)
- EBTDA margin 15.08% vs 13.62% sequentially (+146 bps) and 13.12% yearly (+195 bps)
- Interest/EBITDA 15.14% vs 14.76% sequentially (+38 bps) and 11.34% yearly (+380 bps)
- Lower tax payments due to lower deferred tax and export duty obligation on refined diesel/petrol
Summary of latest report card: FY23 (Consolidated: INR 100 Cr. =1B)
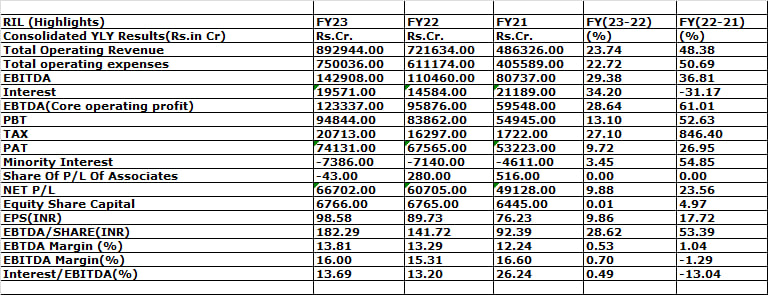
- Operating revenue Rs.8929.44B vs 7216.34B (+23.74%)
- Operating expense Rs.7500.36B vs 6111.74B (+22.72%)
- EBITDA Rs.1429.08B vs 1104.60 (+29.38%)
- Net interest paid Rs.195.71B vs 145.84B (+34.20%)
- Core operating profit (EBTDA=EBITDA-INTT) Rs.1233.37B vs 958.76 (+28.64%)
- Core operating EPS (EBTDA/Share) Rs.182.29 vs 141.72 (+28.62%)
- EBTDA margin 13.81% vs 13.29% (+53 bps)
- EBITDA margin 16.00% vs 15.31% (+70 bps)
- Interest/EBITDA ratio 13.69% vs 13.20% (+49 bps)
- Growth in revenue supported by continuing growth momentum across all businesses led by consumer business (Digital Services, retail) and O2C (amid higher realizations on the back of a 19% increase in average price)
- Oil and Gas business Revenues increased due to a sharp increase in gas price realization and a 10.7% increase in KG D6 gas production
- Increase in revenue along with steady improvement in margins leading to higher EBITDA growth in Digital Services Segment
- Margin expansion with benefits of scale and operating leverage resulting in robust growth in the Retail segment
- The sharp improvement in fuel cracks was partially offset by the introduction of SAED on the export of transportation fuels and lower downstream product delta in the O2C segment. This resulted in EBITDA growth of 17.7%
- Higher gas price realization in the Oil & Gas segment leads to higher EBITDA growth (mainly lower base effect)
- Finance costs (interest) increased due to higher interest rates and loan balances along with foreign exchange (FX) fluctuations (cross currency headwinds)
Overall update:
- Capital allocation policy aligned with growth trajectory and sustainable value creation
- Growth initiatives backed by stronger cash flows, comfortable leverage
- Over the last two years, cash profits have funded 98% of CapEx
- Net debt significantly below 1x EBITDA
- Higher debt primarily to cover higher WC requirements and FX/cross currency liabilities/headwinds
The continuing emphasis on:
- Disciplined capital allocation to support growth initiatives, largely through internal accruals
- Retaining superior investment-grade ratings
- Maintaining Net Debt to EBITDA at below 1x
- Strong cash generation and a superior credit profile provide flexibility to deploy capital in a disciplined manner
- Developing affordable renewable energy ecosystem, ensuring progress towards the Net Zero target and a sustainable future
- Allocating capital towards energy transition initiatives could generate and that could be the next phase of earnings
- Energy businesses accounted for 57% of incremental growth
- The energy business continues to generate strong cash flows through the commodity cycles and despite the
- macro disruptions
- Jio and retail have grown their EBITDA at 50% CAGR over the last two years and 25% during three years of COVID
- For export-savvy O2C business, cautiously optimistic about FY24 amid high volatility in oil prices, a possible flare-up of crude oil due to OPEC+ production cut, higher exports by China (refined products) and any recession/severe economic slowdown in the U.S. and EU amid lingering macro-headwinds
- Continued focus on O2C cost optimization with a customer-centric solution
- Overall focus on strong earnings growth and balance sheet
Fair Valuation: RIL
The present fair value of RIL may be around 2571/- and RIL may scale 2956/- by Dec’23, 3400/- by Mar’24, 3910/- by Mar’25, and 4496/- by Mar’26
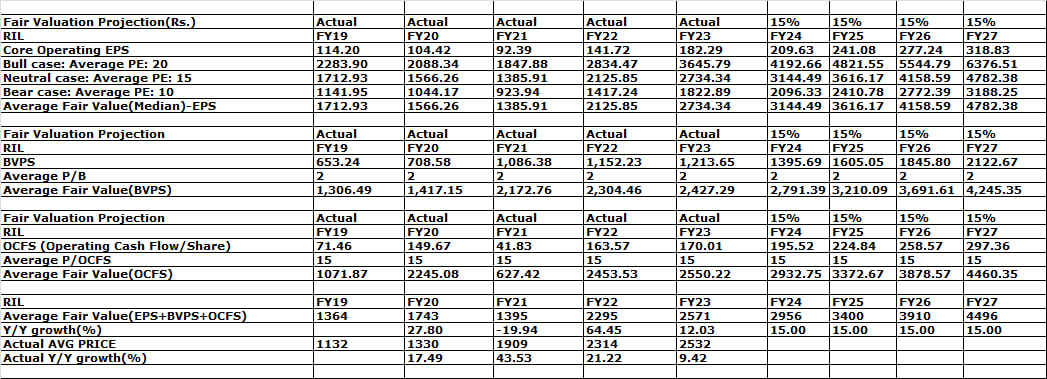
In FY23, RIL reported the core operating EPS at 182.29 vs 141.72 in FY22 (+28.62%) vs 92.39 in FY21 (impacted by COVID) and 104.42 in FY20 (pre-COVID). RIL was a story of a ‘K’-shaped economic downturn during COVID due to a global/domestic lockdown; its O2C business was severely affected along with consumer-facing/contact-sensitive other businesses (like Retail). Only digital business (R-JIO) was a beneficiary of COVID-related disruptions.
Now looking ahead, considering the current quarterly run rate, previous trends, and various commentaries by the company/management, higher EU refining margin at present, but EU sanctions risk in the future, higher digital/telecom ARPU, higher borrowing costs, and partial effect of a windfall tax, the FY: 24-27 core operating EPS may grow around +15% CAGR on an average rather than our previous estimate of +20%.
Similarly, if we consider BVPS (at around 15% CAGR), and OCFS (at around 15% CAGR) and assume fair average PE of 15 (EPS), P/B of 2, and P/OCFS of 15, the average fair value (EPS+BVPS+OCFS) may be around Rs. 2956-3400-3910-4496 (FY24-27); current fair value around Rs.2571. As the financial market generally discounts 1Y earnings/EPS in advance, RIL may scale 2956/- by Dec’23, 3400/- by Mar’24, 3910/- by Mar’25, and 4496/- by Mar’26.
Conclusions:
For FY24, RIL’s earnings may be dragged by lower refining margin/O2C income due to any EU sanctions/adverse actions, higher Chinese supply, and unfavorable movement of crude oil/spreads, while maybe boosted by upbeat retail and digital/telecom business amid expansion & diversification (both organically and inorganically). RIL’s FY24 earnings may be also boosted by the growing gas exploration and production business in India, being supported by the Modi admin as Indian NG producers are getting much higher prices than prevailing global prices. RIL is now actually incubating various consumer-facing businesses along with green energy, thanks to prudent CAPEX/investment. We may see potentially higher core operating EPS from FY24-26 onwards.
RIL has the world’s biggest oil refinery complex in Jamnagar (Gujrat) and it’s a major beneficiary of the protracted geopolitical conflict/proxy war between Russia and the U.S./NATO over Ukraine. Russia has no choice but to sell its oil at discounted prices to India and China for the sake of revenue and the economy. RIL operated its refinery at around 92% in April’22 against IOC’s 108% to cater to elevated diesel demand from Europe. Many European refineries had stopped Russian crude oil due to G7 and also self-imposed sanctions for the Ukraine invasion.
In any way, SGX GRM plunged from the peak of $30.5 to almost $3.90 in Q2FY23 on the concern of a synchronized global recession. But Chinese COVID reopening and cheap Russian crude oil are also supporting the GRM. RIL’s refinery processes a higher proportion of diesel and thus generally RIL GRM comes higher than SGX GRM. Every $1 increase in RIL GRM may translate to around $500M of EBITDA for RIL. Thus even after assuming normalization in the coming days, RIL’s GRM for FY24 may come to around $12 instead of the $10.5 earlier estimated.
The trajectory of GRM will be also dependent to some extent on the trajectory of the Russia-U.S./NATO proxy war over Ukraine. And till now there is no sign of any peace between Russia and Ukraine as the latter is not ready to sign any truce/ceasefire agreement instead of territorial integrity and sovereignty. Also, U.S./NATO will not withdraw various economic sanctions on Russia in a hurry even if there is some kind of ceasefire agreement. Thus GRM is likely to be elevated at least till Q2FY24 and this will boost refining profit for RIL further. And China’s reopening may also help higher GRM and petchem margins.
In 2022, despite tight inventory, diesel cracks corrected from $36 to $12, while Jet/ATF cracks also corrected from $28 to $13 mainly due to the Chinese lockdown and slowdown in fuel utilization. Global petchem margin was at a multi-year low due to lower prices of PE, PP, and PET amid subdued demand from China despite a recent surge in Naphtha (feedstock) prices. For RIL, the impact was lower due to its integrated operations –it captures the Naphtha spreads. But as RIL is also the largest buyer of its gas (NG), the overall standalone EBITDA margin falls to some extent.
For RIL, the expected recovery in the O2C/petchem business along with ongoing/rapid expansion of retail (including pharma, and grocery) and higher realization/strong growth in JIO may ensure around 20-25% growth in core operating EPS in FY24, followed by at least 15% CAGR in subsequent years. Reliance is now fast replacing (rebranding) closed (defaulted) ‘Big Bazar’ mall/shopping space with ‘Reliance/Smart Bazar’ across the country (almost 950 stores at various prime locations). But considering recent EU comments about the back door entry of Russian oil into the EU through Indian refineries such as RIL, we estimated 15% growth for core operating EPS in FY24 (with upside risk).
Thus oil to retail and telecom/digital business coupled with a new venture into emerging green business (EV) and deleveraging prospects in the coming years, RIL should be an attractive portfolio investment. With the credibility of Mukesh Ambani, impeccable management, a strong balance sheet, and the ability to raise funds at a cheaper cost for startup projects, RIL is now an ideal stock to reflect India’s growth story.
As RIL is always expanding or diversifying, its FCF often turns out negative as it’s employing cash for the next leg of growth even after attractive returns for shareholders (dividend, etc). RIL scrip, which was around 500.00 in early 2017, rallied over +470% in 5 years to 2855.00 in late Apr’22. Looking ahead, RIL may also foray into EV/car business by acquiring MG Motors (Chinese stake) in India. In brief, RIL may be now fast turning India’s ‘Desi Wall Mart with a flavour of Amazon (NASDAQ:), BP (LON:) and even Tesla’. In the future, RIL may also launch an EV app cab service like Ola/Uber (ride-hailing) to leverage its EV/energy ecosystem.
Looking ahead, whatever may be the narrative, technically RIL has to sustain over 2535 for any further rally towards 2575/2600-2635/2700 and 2760*/2815-2855*; otherwise sustaining below 2510, it may again fall to 2465/2430-2395/2345*, and further 2305/2250*-2200/2180* zones in the coming days. For the time being, 2345/2305-2250/2180 is a good positional support zone for investment buying/accumulation purposes.
