
Download Carl’s Bear Market Survival Guide e-Book:
https://www.thinkmarkets.com/au/lp/2023-bear-market-survival-guide-ebook/

Investors have all but factored out another interest rate hike from the Reserve Bank of New Zealand when it meets on Wednesday.
The consensus among economists is for the RBNZ to pause after twelve consecutive increases since October 2021 totaling 525 basis points, with the official cash rate to remain at a 15-year high of 5.5%.
If there is some doubt as to the future path of New Zealand interest rates, it’s in the medium term. The Reserve Bank of New Zealand “Shadow Board” (“SB”) helps guide RBNZ policy. The SB is a group preeminent economists and academics who express their own views on the desired path of the New Zealand official cash rate.
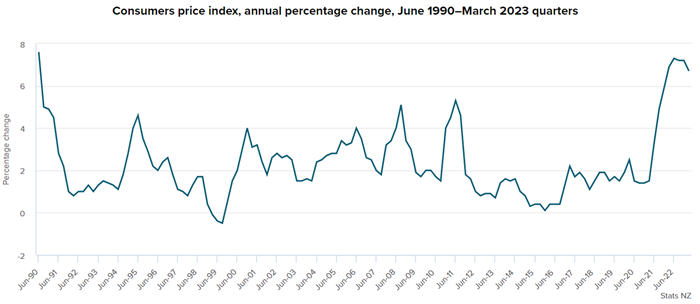
Earlier this month, the SB recommended the RBNZ take no action at this week’s meeting. It also suggested the official cash rate should as low as 4.5% and as high as 6% over the course of the next twelve months. This implies the current rate is closer to the top of the range of possible outcomes, but that it could still move higher in response to higher than desired inflation (the New Zealand CPI remains stuck in the 6-7% p.a. range and is falling far more slowly than in other developed countries).

New Zealand CPI, source: Stats NZ (click to enlarge image)
Investors will get only basic messaging from the RBNZ as to where it thinks the cash rate may go this Wednesday as it is not scheduled to issue a new monetary policy statement, which is only does on an alternate meeting basis. If we look to the economists, most forecast 5.5% to be the peak in the near term as the New Zealand economy continues to slow, and tightness in the labour force eases on the back of surging migration. Further, inflation expectations, particularly at the business level, continue to moderate which may help put a cap on inflation.
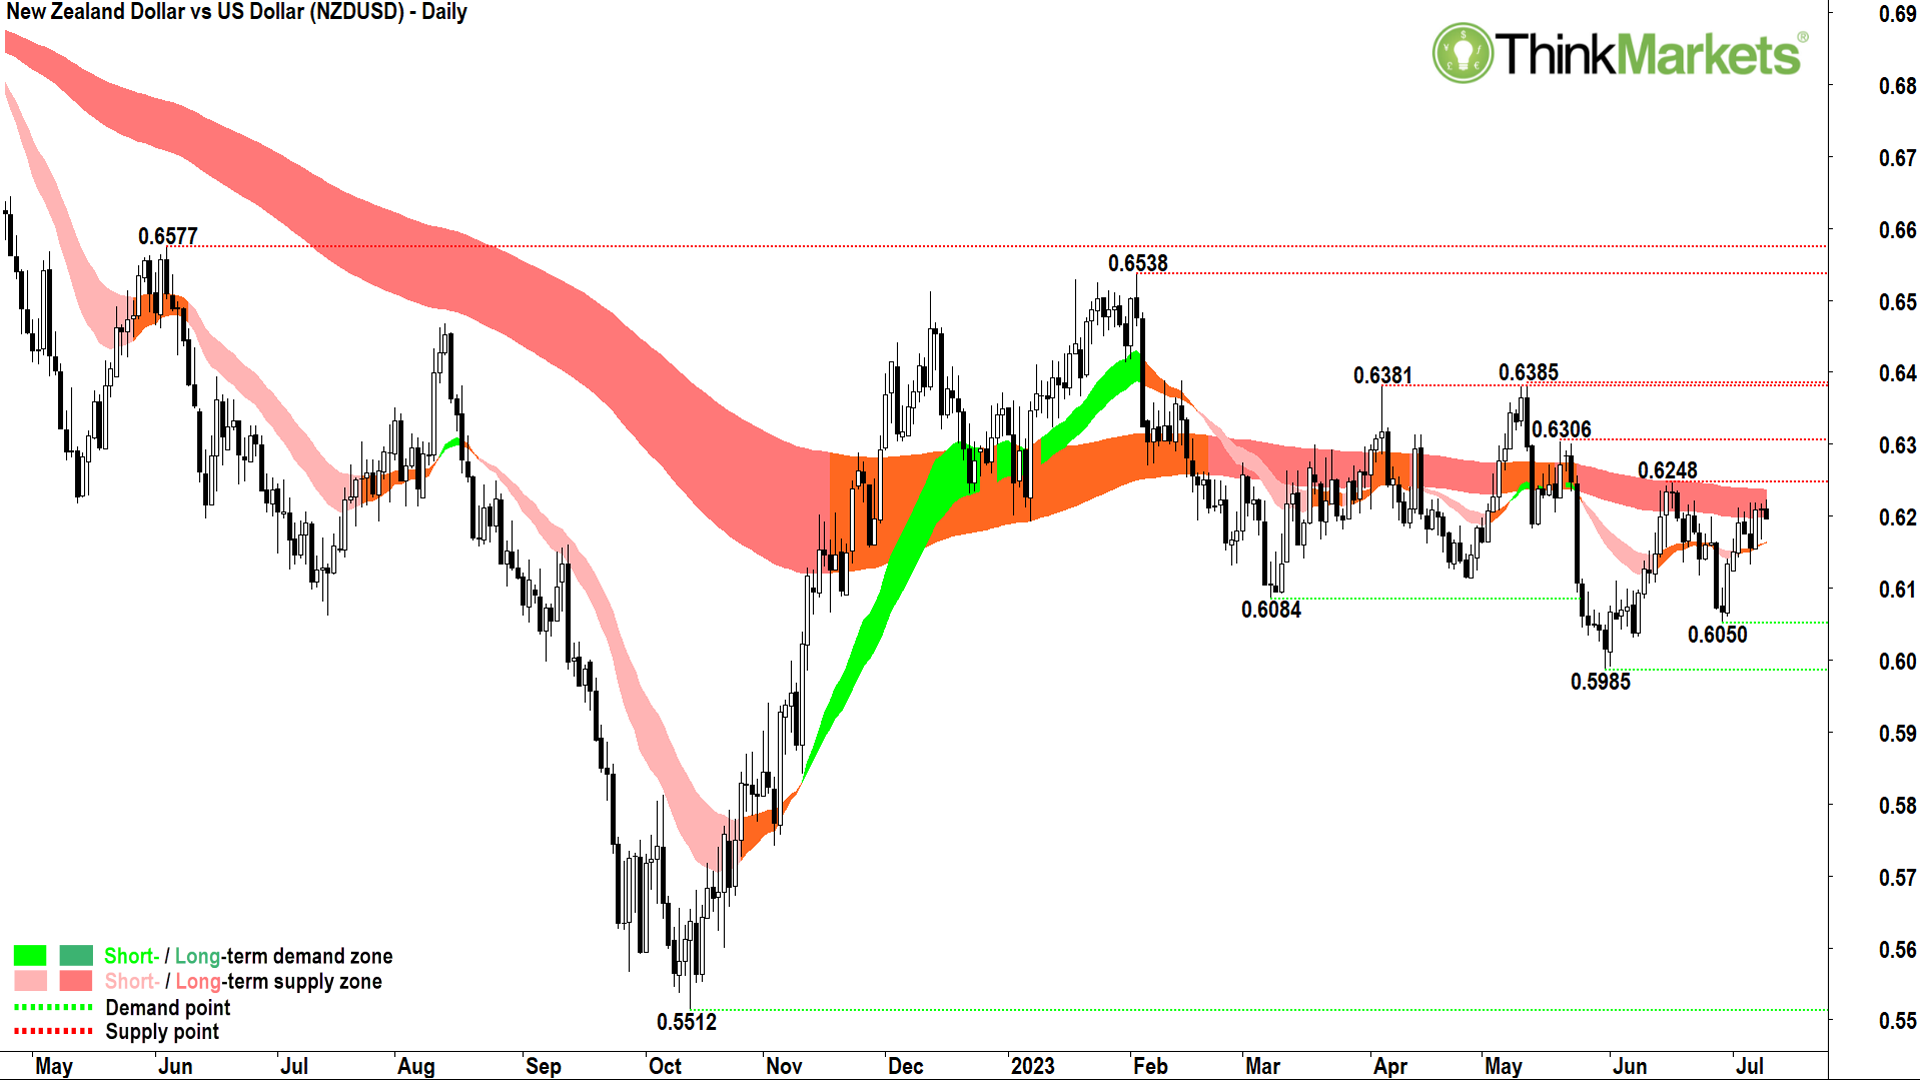
If the RBNZ is indeed on pause for a prolonged period, and if we may still see one or two more small increases in the US official cash rate from the Federal reserve in July or August, it is conceivable we may see continued weakness in the New Zealand dollar versus the Greenback (NZDUSD). Traders may wish to trade in line with the broad downtrend (dark pink ribbon) by targeting a large black candle/long upper shadowed candle on Wednesday.
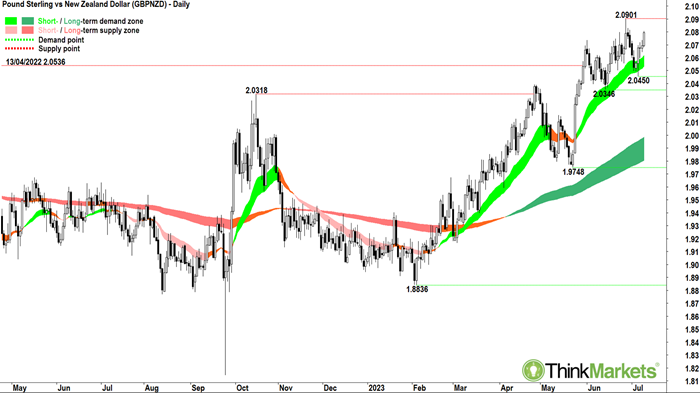
Possibly the better trade targeting NZD weakness, however, is against the Pound Sterling. The Bank of England (BOE) currently appear to be the most hawkish central bank, and the market is expecting at least another couple of 0.25% hikes from them before the end of this year. Remember, forex traders tend to shift their holdings based upon relative yields, so it makes sense the GBPNZD could appreciate based upon the diverging views of the BOE vs RBNZ.
Certainly, the GBPNZD chart appears to be responding to the shifting rates environment between the two countries. The long-term trend is clearly up (dark green ribbon), as is the short-term trend (light green ribbon). The short-term trend ribbon appears to be supporting the price, and we have seen a series of solid demand side candles appearing at this zone since 6 July.
The path of least resistance appears skewed to the upside here, so traders may consider long trades on the GBPNZD with stops below the 14 June trough low of 2.0346. Targets are open ended as once the GBPNZD moves past the 28 June high of 2.0901 we’ll be trading at 3-year highs with little in the way with respect to key level resistance.

Learn More, Earn More!
Want your portfolio questions answered? Register for next week’s Live Market Analysis sessions and attend live! You can ask me about any stock, index, commodity, forex pair, or cryptocurrency you’re interested in.
You can catch the replay of the last episode of Live Market Analysis here:
Charts suggest so many stocks to BUY in the US!


