
Is D.R. Horton, Inc.’s (NYSE:DHI) Latest Stock Performance A Reflection Of Its Financial Health?

D.R. Horton (NYSE:DHI) has had a great run on the share market with its stock up by a significant 19% over the last three months. Since the market usually pay for a company’s long-term fundamentals, we decided to study the company’s key performance indicators to see if they could be influencing the market. Specifically, we decided to study D.R. Horton’s ROE in this article.
Return on equity or ROE is an important factor to be considered by a shareholder because it tells them how effectively their capital is being reinvested. In other words, it is a profitability ratio which measures the rate of return on the capital provided by the company’s shareholders.
View our latest analysis for D.R. Horton
How To Calculate Return On Equity?
Return on equity can be calculated by using the formula:
Return on Equity = Net Profit (from continuing operations) ÷ Shareholders’ Equity
So, based on the above formula, the ROE for D.R. Horton is:
25% = US$5.2b ÷ US$21b (Based on the trailing twelve months to March 2023).
The ‘return’ refers to a company’s earnings over the last year. That means that for every $1 worth of shareholders’ equity, the company generated $0.25 in profit.
What Has ROE Got To Do With Earnings Growth?
So far, we’ve learned that ROE is a measure of a company’s profitability. Depending on how much of these profits the company reinvests or “retains”, and how effectively it does so, we are then able to assess a company’s earnings growth potential. Assuming all else is equal, companies that have both a higher return on equity and higher profit retention are usually the ones that have a higher growth rate when compared to companies that don’t have the same features.
D.R. Horton’s Earnings Growth And 25% ROE
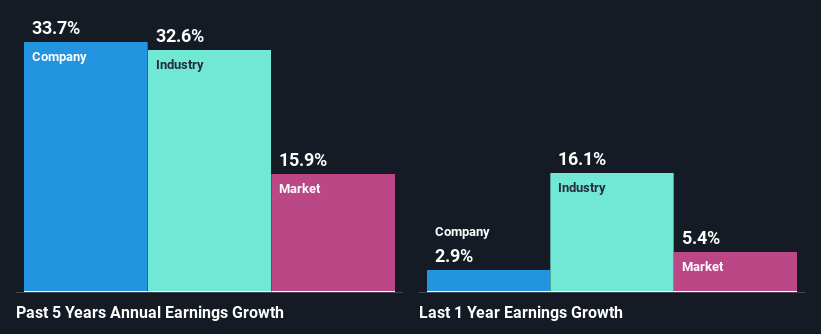
To begin with, D.R. Horton has a pretty high ROE which is interesting. Second, a comparison with the average ROE reported by the industry of 20% also doesn’t go unnoticed by us. So, the substantial 34% net income growth seen by D.R. Horton over the past five years isn’t overly surprising.
We then performed a comparison between D.R. Horton’s net income growth with the industry, which revealed that the company’s growth is similar to the average industry growth of 33% in the same 5-year period.
Earnings growth is an important metric to consider when valuing a stock. It’s important for an investor to know whether the market has priced in the company’s expected earnings growth (or decline). By doing so, they will have an idea if the stock is headed into clear blue waters or if swampy waters await. What is DHI worth today? The intrinsic value infographic in our free research report helps visualize whether DHI is currently mispriced by the market.
Is D.R. Horton Making Efficient Use Of Its Profits?
D.R. Horton’s ‘ three-year median payout ratio is on the lower side at 6.9% implying that it is retaining a higher percentage (93%) of its profits. So it seems like the management is reinvesting profits heavily to grow its business and this reflects in its earnings growth number.
Besides, D.R. Horton has been paying dividends for at least ten years or more. This shows that the company is committed to sharing profits with its shareholders. Our latest analyst data shows that the future payout ratio of the company is expected to rise to 11% over the next three years. Accordingly, the expected increase in the payout ratio explains the expected decline in the company’s ROE to 13%, over the same period.
Conclusion
In total, we are pretty happy with D.R. Horton’s performance. Particularly, we like that the company is reinvesting heavily into its business, and at a high rate of return. Unsurprisingly, this has led to an impressive earnings growth. With that said, on studying the latest analyst forecasts, we found that while the company has seen growth in its past earnings, analysts expect its future earnings to shrink. Are these analysts expectations based on the broad expectations for the industry, or on the company’s fundamentals? Click here to be taken to our analyst’s forecasts page for the company.
Have feedback on this article? Concerned about the content? Get in touch with us directly. Alternatively, email editorial-team (at) simplywallst.com.
This article by Simply Wall St is general in nature. We provide commentary based on historical data and analyst forecasts only using an unbiased methodology and our articles are not intended to be financial advice. It does not constitute a recommendation to buy or sell any stock, and does not take account of your objectives, or your financial situation. We aim to bring you long-term focused analysis driven by fundamental data. Note that our analysis may not factor in the latest price-sensitive company announcements or qualitative material. Simply Wall St has no position in any stocks mentioned.
Join A Paid User Research Session
You’ll receive a US$30 Amazon Gift card for 1 hour of your time while helping us build better investing tools for the individual investors like yourself. Sign up here


