
Following a 18% decline over last year, recent gains may please DCC plc (LON:DCC) institutional owners

Key Insights
-
Given the large stake in the stock by institutions, DCC’s stock price might be vulnerable to their trading decisions
-
50% of the business is held by the top 22 shareholders
-
Analyst forecasts along with ownership data serve to give a strong idea about prospects for a business
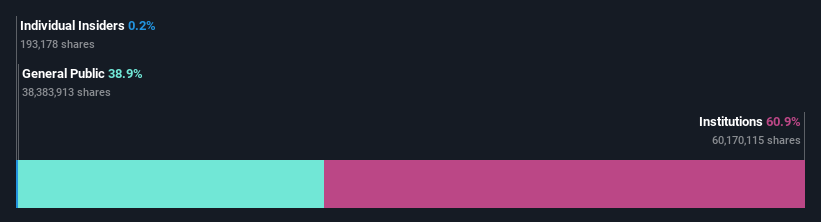
To get a sense of who is truly in control of DCC plc (LON:DCC), it is important to understand the ownership structure of the business. We can see that institutions own the lion’s share in the company with 61% ownership. In other words, the group stands to gain the most (or lose the most) from their investment into the company.
Last week’s UK£422m market cap gain would probably be appreciated by institutional investors, especially after a year of 18% losses.
In the chart below, we zoom in on the different ownership groups of DCC.
View our latest analysis for DCC
What Does The Institutional Ownership Tell Us About DCC?
Institutions typically measure themselves against a benchmark when reporting to their own investors, so they often become more enthusiastic about a stock once it’s included in a major index. We would expect most companies to have some institutions on the register, especially if they are growing.
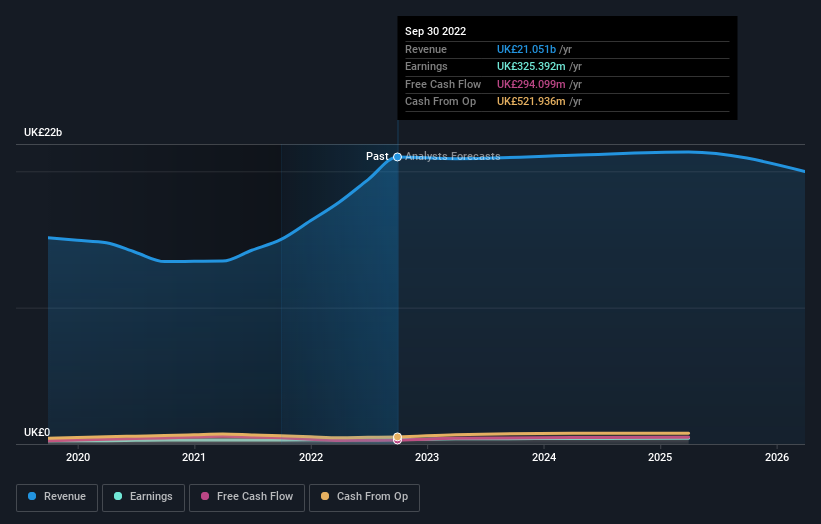
As you can see, institutional investors have a fair amount of stake in DCC. This implies the analysts working for those institutions have looked at the stock and they like it. But just like anyone else, they could be wrong. If multiple institutions change their view on a stock at the same time, you could see the share price drop fast. It’s therefore worth looking at DCC’s earnings history below. Of course, the future is what really matters.
Institutional investors own over 50% of the company, so together than can probably strongly influence board decisions. DCC is not owned by hedge funds. Looking at our data, we can see that the largest shareholder is BlackRock, Inc. with 9.0% of shares outstanding. For context, the second largest shareholder holds about 5.1% of the shares outstanding, followed by an ownership of 4.9% by the third-largest shareholder.
After doing some more digging, we found that the top 22 have the combined ownership of 50% in the company, suggesting that no single shareholder has significant control over the company.
While it makes sense to study institutional ownership data for a company, it also makes sense to study analyst sentiments to know which way the wind is blowing. Quite a few analysts cover the stock, so you could look into forecast growth quite easily.
Insider Ownership Of DCC
The definition of company insiders can be subjective and does vary between jurisdictions. Our data reflects individual insiders, capturing board members at the very least. The company management answer to the board and the latter should represent the interests of shareholders. Notably, sometimes top-level managers are on the board themselves.
I generally consider insider ownership to be a good thing. However, on some occasions it makes it more difficult for other shareholders to hold the board accountable for decisions.
Our data suggests that insiders own under 1% of DCC plc in their own names. It’s a big company, so even a small proportional interest can create alignment between the board and shareholders. In this case insiders own UK£9.1m worth of shares. It is good to see board members owning shares, but it might be worth checking if those insiders have been buying.
General Public Ownership
The general public– including retail investors — own 39% stake in the company, and hence can’t easily be ignored. This size of ownership, while considerable, may not be enough to change company policy if the decision is not in sync with other large shareholders.
Next Steps:
While it is well worth considering the different groups that own a company, there are other factors that are even more important.
I like to dive deeper into how a company has performed in the past. You can find historic revenue and earnings in this detailed graph.
If you would prefer discover what analysts are predicting in terms of future growth, do not miss this free report on analyst forecasts.
NB: Figures in this article are calculated using data from the last twelve months, which refer to the 12-month period ending on the last date of the month the financial statement is dated. This may not be consistent with full year annual report figures.
Have feedback on this article? Concerned about the content? Get in touch with us directly. Alternatively, email editorial-team (at) simplywallst.com.
This article by Simply Wall St is general in nature. We provide commentary based on historical data and analyst forecasts only using an unbiased methodology and our articles are not intended to be financial advice. It does not constitute a recommendation to buy or sell any stock, and does not take account of your objectives, or your financial situation. We aim to bring you long-term focused analysis driven by fundamental data. Note that our analysis may not factor in the latest price-sensitive company announcements or qualitative material. Simply Wall St has no position in any stocks mentioned.
Join A Paid User Research Session
You’ll receive a US$30 Amazon Gift card for 1 hour of your time while helping us build better investing tools for the individual investors like yourself. Sign up here


