
Douglas Rissing
Introduction
As you might be aware, rating agency Fitch has downgraded the United States of America. The U.S. went from a top-tier debt rating (AAA) to a slightly lower AA+ rating. You probably saw a lot of scary and fearmongering headlines over the last few days.
Let’s take a look at what this means for your portfolio and how markets reacted in the past.
Why Did Fitch Downgrade The United States?
Fitch’s reasoning behind the downgrade was the following:
Expected fiscal deterioration Growing debt burden The erosion of governance related to its peers.
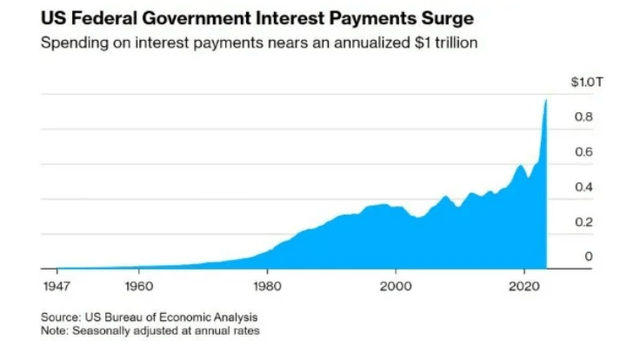
U.S. Bureau of Economic Analysis
As can be seen in the picture above, the interest payments are now $1T annualized, which is pretty close to the market cap of Nvidia (NVDA) or 12.5x the market cap of PayPal (PYPL). If you think of it like this, you can see that this is a huge number that the U.S. now has to pay on an annual basis; and that’s just the interest.
Fitch even mentioned that they predict the United States will enter into a mild recession at the end of the year or early next year. After the rating downgrade, JPMorgan Chase (JPM) CEO Jamie Dimon mentioned that he believes the rating downgrade is ridiculous and that he believes the overall economy looks alright.
Personally, I believe a rating downgrade should have happened earlier, but the timing of Fitch today is odd, with the debt-to-GDP ratio decreasing after the massive spike we saw in Q1 2020 due to the fiscal stimulus we saw in the aftermath of the covid-19 outbreak. While this can’t be seen in the chart below, the United States debt to GDP ratio is currently higher than in the rebuild after World War II, which was 119%.
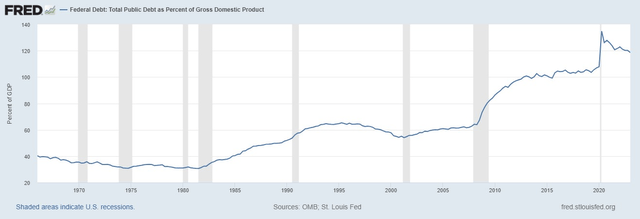
FRED
But, it is important to realize that a government doesn’t spend money like a household. As such, the United States government can accumulate quite a bit of debt as they are in control of the money supply. However, interest payments are obviously rising, but the U.S. doesn’t need to make a decision between spending money in the economy or spending on interest payments, due to the fact that their balance sheet simply doesn’t work like that of a company or normal household.
Nonetheless, the markets slipped on Wednesday following the news. The S&P 500 SP500) fell 1.4%, which was the largest daily decline since April 25th.
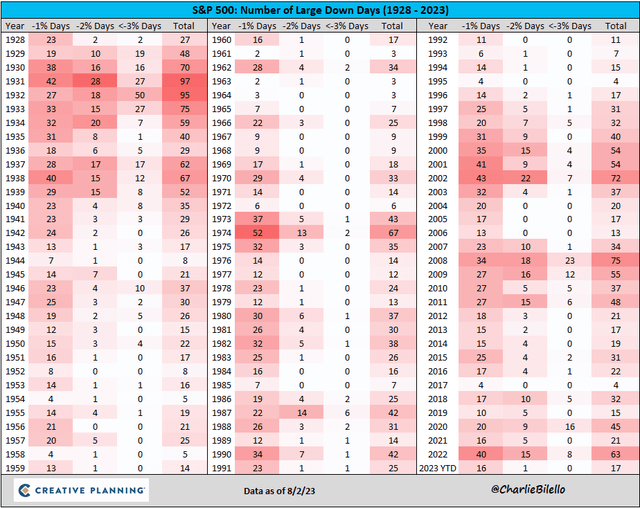
Charlie Bilello
So now, let’s take a look at what this actually means for your portfolio and how this downgrade affects us as market participants
Does It Really Matter?
While the United States’ Treasuries got downgraded they still have Fitch’s second-best rating at AA+ instead of the AAA rating they had previously. In addition, U.S. Treasuries remain the most widely used form of collateral in the world due to their high liquidity, deep repo market, and their high rating.
Now let’s have a look at how the big institutional investors are affected by this, which obviously affects the market as a whole.
Pension Funds: Pension funds are significant purchasers of treasuries. Pension funds use treasuries as long-duration assets to match their long-term liabilities and as collateral for other investments. A small downgrade from AAA to AA+ doesn’t really matter all that much due to the fact that an AA+ rating is still well within the specifications of a solid hedging instrument or defensive asset allocation for pension funds. As such, the impact of this downgrade on pension funds is likely to be minimal.
Commercial Banks: These banks are major buyers of Treasuries, using them as regulatory liquid assets (HQLA), collateral, and sometimes as a hedge against interest rate risks on their liabilities. Fortunately, the Basel regulatory framework, which was introduced a decade ago, imposes 0% capital requirements for government bonds rated between AAA and AA- under its standardized approach.

Bank for International Settlements
Moreover, many banks follow the internal-rating based (IRB) approach, and in this case, most jurisdictions grant an exception for investment-grade rated domestic government bonds, automatically assigning them a 0% risk weight. In essence, this downgrade should not significantly (if at all) affect commercial banks.
Collateral usage: Pension funds and insurance companies are actively involved in the repo market, lending their unsecured cash parked at banks against collateral to enhance the safety of their cash deposits.
Bonds rated between AAA and AA- all fall within the same category, making their downgrade less significant in terms of collateral usage. Some pension funds may have stricter demands and only accept AAA-rated collateral. However, even for these funds, the marginal impact of the Fitch downgrade is expected to be extremely minor.
Forex Reserve Managers: FX reserve managers, such as those from China and Brazil, typically accumulate USD from their corporates that conduct transactions in the United States. These USD deposits are then invested in safe and liquid assets, often in the form of U.S. Treasuries. While the rating considerations are essential for FX reserve managers, it’s worth noting that most countries treat governments rated AAA to AA in the same risk category.
When evaluating the alternatives to U.S. treasuries there are several options that come to mind:
- Japanese Government Bonds (JGBs): Notably, JGBs lack free float, which may raise concerns for some FX reserve managers about their liquidity and market dynamics.
- European Bonds: The European bond market features a smaller segment of AAA-AA rated bonds compared to the US, potentially limiting the available investment options for reserve managers.
- BRICS Bond Markets: While considering bonds from BRICS countries (Brazil, Russia, India, China, and South Africa) might be an option, these markets may not offer the same level of depth and liquidity as the U.S. Treasury market.
In addition, a lot of these options aren’t in the AAA to AA category either, so they aren’t an option for most Forex reserve managers anyway.
Now, let’s take a look at how this could affect your portfolio and the current state of the market.
How Does This Affect Your Portfolio?
It is important to note that this isn’t the first time a downgrade has happened, and looking at what happened historically could give us some good indications of what might be ahead of us. The Mark Twain saying, “History doesn’t repeat itself, but it often rhymes” seems like a great metaphor to prepare ourselves for the possible outcomes of the downgrade.
The last time a rating agency downgraded the United States was in 2011, when S&P (SPGI) downgraded the U.S. from AAA to AA+. It’s important to remember that at that time there was a sovereign debt crisis starting to show in Europe, and U.S. Treasuries were thus seen as an ideal safe haven investment. In addition, the turmoil in Europe was affecting the global equity markets as a whole.
Interestingly, the interest rates at the time were historically low and the markets weren’t as resilient as they seem to be right now. The environment was quite different back then, but still, let’s take a look at the market returns over that period.
For this, we will be looking at the returns from the 3rd of January 2011 (first trading day of 2011) till the 31st of December 2012 (last trading day of 2012). This gives us the returns of 2 years with the rating downgrade happening on the 5th of August 2011.
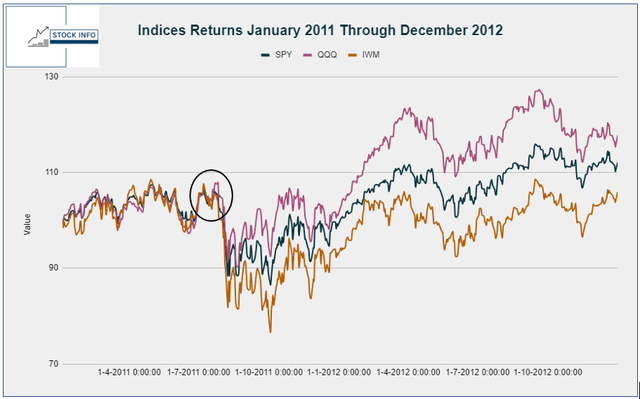
Stock Info
As you can see in the chart above, the S&P 500 (SPY), Nasdaq 100 (QQQ), and the Russell 2000 (IWM) were at a pretty similar level before the drop following the rating downgrade with each being up around 6% to 7% since January 3th, 2011. As you can see, a quick drop follows in all the indices, with the indices being down 12%, 8.5%, and 18% for the year respectively on the 8th of August 2011.
While the SPY and QQQ reached their lowest point of the year there, IWM dropped even lower and reached a low of 23.4% down for the year in October 2011. The markets pretty much continued to struggle, reaching breakeven again at the end of the year.
Nonetheless, the market subsequently rallied significantly, with the indices adding 11.5%, 24%, and 5.3% in the following 4 months. So what could we expect from the current downgrade? If the scenario would be similar, we could see a rough couple of weeks, but buying the dip would generate significant returns in the first half of 2023.
Now let’s take a look at how both Gold (GLD) and the iShares 20+ Year Treasury Bond ETF (TLT) performed during that same period.
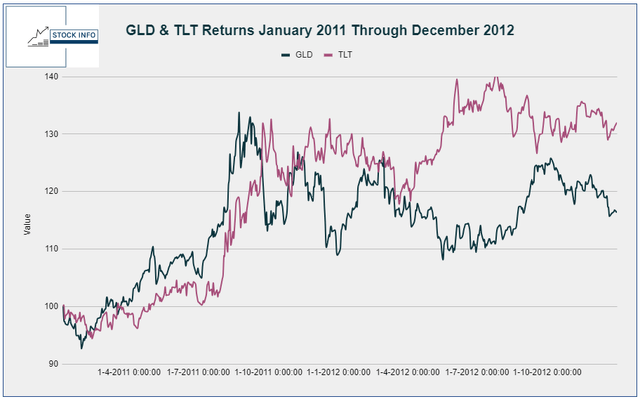
Stock Info
As can be seen, both GLD and TLT underperformed the indices a bit at the beginning of the year. Nonetheless, they started running up significantly one month before the rating downgrade was announced due to uncertainty in the markets and fiscal policies but started ballooning higher after the rating downgrade was announced.
On the 23rd of August, GLD was up close to 34% for the year with TLT reaching similar levels in October of 2011. While GLD went down quite a bit afterward it still ended 2012 with a 16% gain. Meanwhile, TLT remained very strong for the rest of the year with it being up over 40% at the end of July 2012, far exceeding the returns of SPY (14.5%), QQQ ( 27.15%), and IWM (8.5%) at the same time.
In summary, if a similar move happens it would be wise to slowly decrease some of your equity positions and buy some TLT or wait for a possible bottom in the next few weeks and buy the dip.
What Are The Differences And How Will This Affect The Market?
First of all, it is important to note that we are currently in a high-interest rate environment, and while many believe that there won’t be any more rate hikes, there aren’t any signs of rate cuts yet. By comparison, 2011 had a close to 0% interest rate environment and the 2008 recession was still very fresh, which left its scars on many families.
In addition, Europe was struggling with a significant debt problem and while debt ratios are swinging through the roof once again, the economy seems to remain quite strong. Similarly, the United States economy remains to be strong as well, as the employment numbers remain particularly strong. This could give the Fed the fuel to keep the United States in a “higher for longer” environment until something significant cracks.
As can be seen in the chart below, TLT has fallen by over 46% since its high back in March of 2020 and is now sitting at the same level as (yes, you guessed it) July 2011. As such, if TLT pulls a similar move, we can expect TLT to go up close to 30% in a month. Nonetheless, the initial reaction seems like this is unlikely to happen. But, it is important to realize that historical levels on open-ended funds such as TLT can be deceptive due to issued share count and the shifting nature of Authorized Participant Arbitrage.
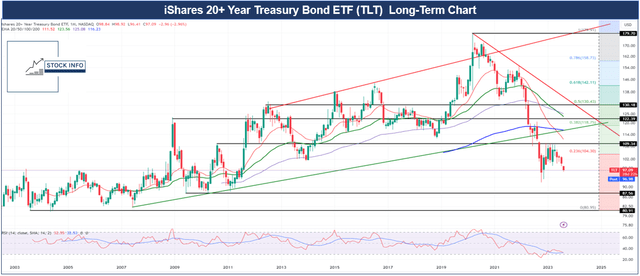
Stock Info with TradingView
Another important thing to mention is that the markets had a pretty solid year so far, with SPY, QQQ, and IWM being up 18.2%, 41.6%, and 12.5%, respectively year to date. For global stocks, this has been the best start since 2009, who would have expected that after the record tightening we saw last year?
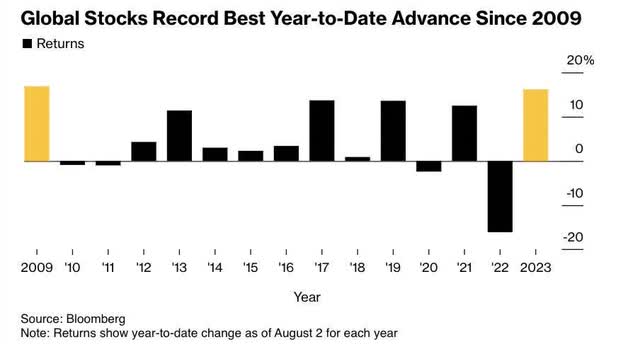
Bloomberg
In particular, big tech companies such as Apple (AAPL), Microsoft (MSFT), Nvidia, and Meta Platforms (META) drove the markets a lot higher. QQQ being up 41.6% YTD is very impressive and according to history, we shouldn’t expect QQQ to outperform. Keep in mind that August tends to be quite weak for the market, as can be seen in the chart below.
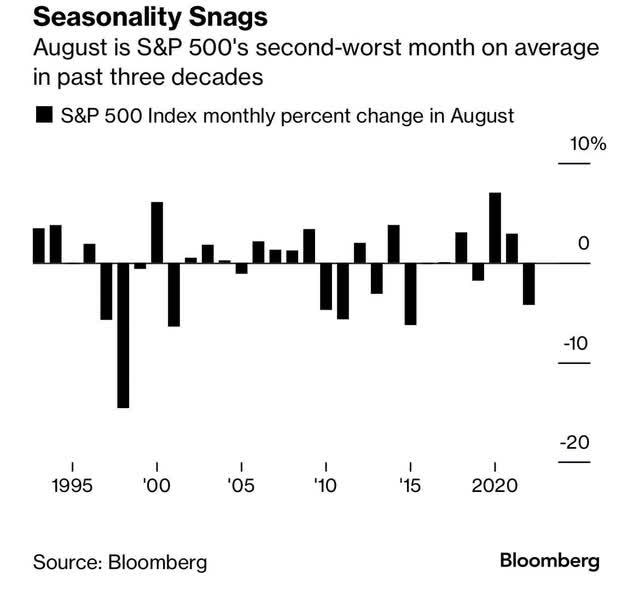
Bloomberg
In addition, valuations are quite stretched for the indices as well. When we take a look at the US Buffett Indicator Ratio with standard deviations, we can see that the market is currently 1.7 standard deviations above the trend or a 182% ratio of market value to GDP.
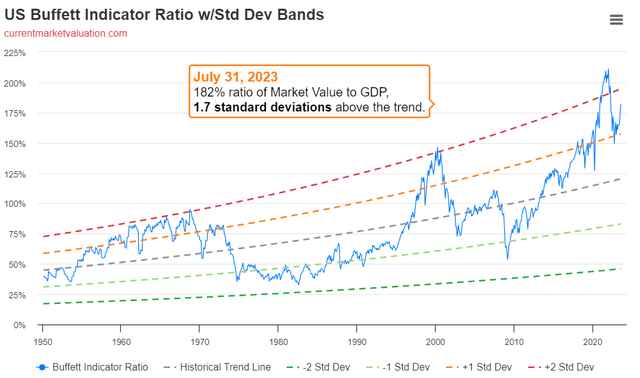
currentmarketvaluation.com
On the other hand, Gold is up 5% YTD, if this is similar to 2011, this would mean there is still plenty of upside ahead. We wrote an article on precious metals and the different ways to invest in them earlier this year, as our top pick in case of a recession. Feel free to check that article out by clicking here.
Conclusion
As we reflect on the recent downgrade of the United States by Fitch, it is natural to wonder about its implications for our portfolios and the broader market. However, before succumbing to fear and sensational headlines, let’s summarize the nuances and historical context of such downgrades.
Fitch’s downgrade was driven by concerns over expected fiscal deterioration, a growing debt burden, and erosion of governance. While this decision may raise eyebrows, it is vital to remember that the U.S. still holds a respectable AA+ rating. Additionally, U.S. Treasuries remain a widely used form of collateral globally, backed by their high liquidity, deep repo market, and strong rating.
The impact of this downgrade on institutional investors like pension funds, commercial banks, and forex reserve managers is likely to be minimal. These investors continue to view U.S. Treasuries as a solid hedging instrument and an essential part of their asset allocation strategies.
Drawing from historical examples, we can glean insights into possible market movements following a downgrade. While short-term volatility might occur, staying focused on the long-term perspective is crucial. Examining the performance of various assets during past downgrades can provide guidance for adjusting our portfolios appropriately.
Differences between the current economic environment and previous downgrades should also be taken into account. Presently, interest rates remain relatively high compared to the near-zero rates during the 2011 downgrade, and the U.S. and global economies show resilience despite mounting debt levels.
Tech companies have driven the markets substantially higher this year, and while valuations are stretched, historical patterns suggest August tends to be a weak month for the market. Precious metals like Gold have shown resilience in uncertain times and could be worth considering as a recession hedge.
In conclusion, the downgrade by Fitch demands thoughtful consideration, but it should not be a cause for panic. Staying well-informed, maintaining a long-term perspective, and carefully evaluating the potential impact on our portfolios will help us navigate the market’s twists and turns, making prudent investment decisions along the way. Remember, history may not repeat itself precisely, but it can certainly rhyme, providing valuable insights into possible outcomes.

