

Investors are faced with the prospect of volatility in asset markets being higher than it has been for much of the post-financial crisis era. Whereas central banks often had half an eye on asset prices in the 2010s, today the fight against inflation has taken precedence over all else. The Federal Reserve’s willingness to let both US equity and government bond prices collapse by nearly 20% last year was a statement of intent.
This regime shift to higher and more volatile inflation, and less accommodative central banks, mean that the strategies that worked in the past decade may come unstuck in more volatile asset markets in the years ahead.
An important caveat: volatility and risk of loss are not the same
Volatility is a measure of how bumpy the journey is. However, for many investors, that is less important than the risk of losing money. And these two are not always aligned as Figure 1 shows.
Figure 1: Lower volatility ≠ lower risk of losing money
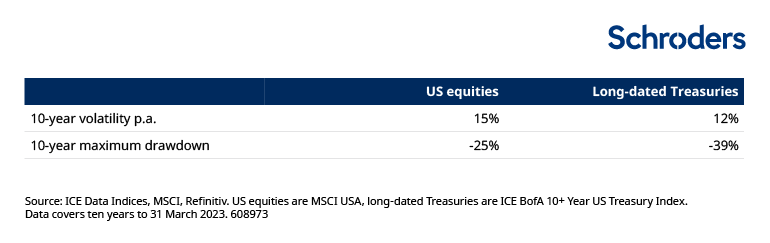
US equities are MSCI USA, long-dated Treasuries are ICE BofA 10+ Year US Treasury Index. Data covers ten years to 31 March 2023. Source: ICE Data Indices, MSCI, Refinitiv.
Risk can mean many other things too, depending on the investor. These include funding level risk for a pension fund (the risk that assets are insufficient to meet liabilities), or the risk that an endowment falls short of an inflation+ target. An investor’s time horizon is also an important factor.
When it comes to managing risk, investors need to be clear on what kinds of risk they are focussed on, as the tools, techniques, and appropriate responses will vary. Some strategies will help deal with volatility, some will deal with risks, while some deal with both volatility and risk.
Importantly, risk management rarely means risk elimination. Investors can easily get rid of volatility or the risk of capital losses (at least in nominal terms) by simply investing in cash – but this would come at the cost of forgoing potentially higher returns, likely resulting in investors falling short of their long-term objectives. Plus, even if cash feels low risk in nominal terms, it is higher risk in inflation-adjusted terms (Figures 2 and 3).
It is true that cash rates have risen a lot, as central banks hike rates to fight inflation, but they remain well short of inflation. Cash can have tactical value, especially for investors with shorter time horizons, but is less appropriate as a long-term strategic holding.
Figure 2: Equities are risky in the short run, less in the long run
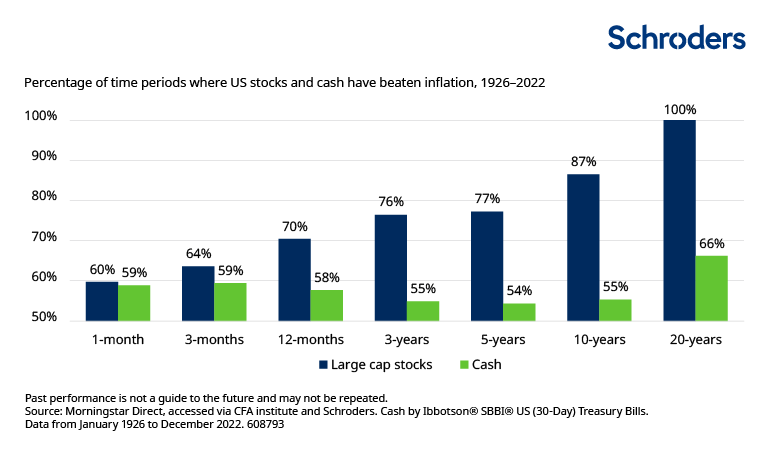
Figure 3: Cash is not the low risk asset you think it is: failed to beat inflation for the past 14 years
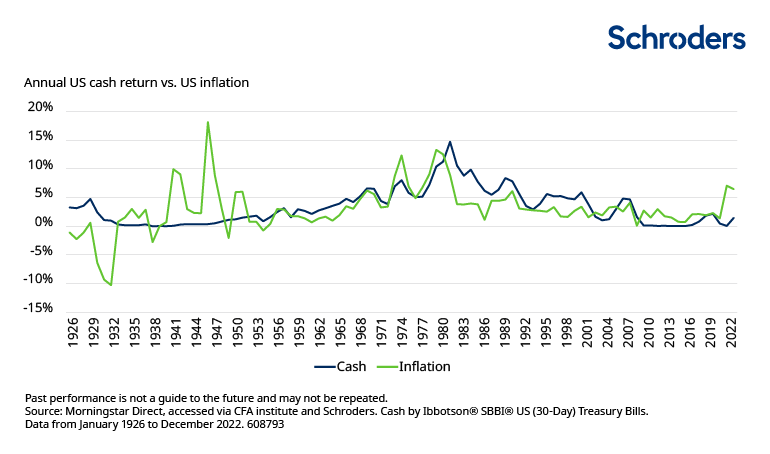
Past performance is not a guide to the future and may not be repeated
Cash by Ibbotson® SBBI® US (30-Day) Treasury Bills. Data from January 1926 to December 2022. Source: Morningstar Direct, accessed via CFA institute and Schroders.
In this paper we focus on risk management techniques from an asset-only perspective, taking account of both volatility and downside loss considerations. Investors with specific liabilities or risks to manage can make use of the approaches outlined but may also need to take additional factors into consideration. We highlight three approaches to managing risk:
- across asset classes
- within asset classes
- by using portfolio management techniques
- Asset allocation across asset classes
In the portfolio construction process, it is imperative to understand how various asset classes interact with each other, especially in ever-changing macroeconomic environments. With the regime shift bringing about higher inflation for longer, the traditional roles of asset classes are evolving. Investors need to be adept in their top-down allocations and accept that a different approach may be necessary.
When it comes to managing risk, government bonds are the usual asset class investors turn to. The 60/40 equity/bond portfolio has popular for so long for good reason. However, one of the main appeals has been the negative correlation between equities and bonds, meaning that government bonds have tended to well when equities have struggled and vice-versa. But this is actually a relatively modern-day phenomenon. For most of the past 25 years, inflation has not been a major worry, coinciding with the period when equities and bonds have been negatively correlated (for more more on the equity/bond correlation, see here). But inflation is the focus today, driving central bank policy and risk appetite. And, in this environment, bonds are likely to be less effective in diversifying equity risk (figure 4). Another asset class, which many investors have little exposure to, could play an increasingly important role: commodities.
As we’ve written recently, commodities can play a greater role in reducing portfolio risk when inflation is driving the market. Commodities/equities could potentially have lower correlations than bonds/equities when inflation is driving the market (Figure 4), and could potentially spark a revolution in terms of asset allocation.
Figure 4: Commodities could potentially be a shelter for investors

Source: Schroders, Refinitiv Datastream, Bloomberg, data from 31 December 1969 to 31 March 2023. Equity uses S&P 500 index, Bonds refers to US 10-year treasury bonds and Commodities uses Bloomberg Commodity Total Returns index. The ratio of change in US CPI and US GDP is used to determine whether the market is focusing more on inflation or growth.
Private assets can also play a role in managing volatility and risk. When their volatility is calculated in the traditional way, as standard deviation of historical monthly or quarterly returns, private assets appear relatively low risk, as Figure 5 shows. This feature can be appealing to investors who are concerned about the reported volatility of their portfolio. For example, it can limit the impact of changing asset valuations on a company’s pension expense in its profit and loss account. In such an instance, the stability of private assets is highly prized.
But investors should not confuse this low volatility with low risk. There can be fundamental reasons why certain private assets could be considered lower risk than their public peers, but their low volatility is heavily influenced by the way they are valued. Private asset valuations are only updated infrequently, if at all, and are not always tested against public market prices (“marked to market”). Both features dampen volatility.
It is more common for some private assets to be revalued annually than quarterly, so moving to estimating volatility based on annual returns rather than quarterly can overcome some of the smoothing of return profiles/volatility dampening.
Figure 5: Private assets can be less volatile than public assets
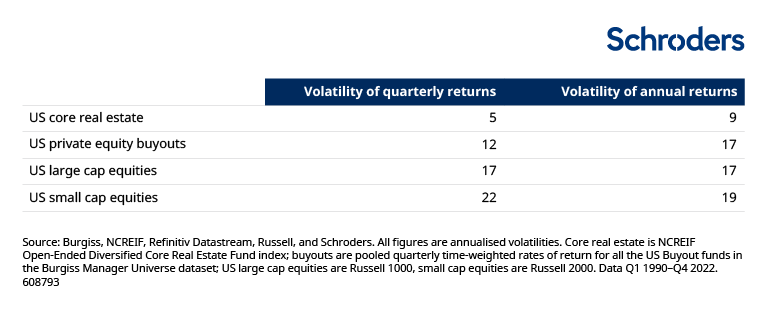
All figures are annualised volatilities. Core real estate is NCREIF Open-Ended Diversified Core Real Estate Fund index; buyouts are pooled quarterly time-weighted rates of return for all the US Buyout funds in the Burgiss Manager Universe dataset; US large cap equities are Russell 1000, small cap equities are Russell 2000. Data Q1 1990-Q4 2022. Source: Burgiss, NCREIF, Refinitiv Datastream, Russell, and Schroders.
Including private assets also brings on additional factors such as liquidity risk. Putting aside measurement issues, there are a number of fundamental drivers of volatility and risk of loss that can be qualitatively appreciated. A collection of some of these is below. This list is not exhaustive but its diversity highlights that there is more to risk when it comes to private asses than may be appreciated:
- Real estate leases normally run for several years and often have some form of indexation or upward-only rent clause which prevents downward adjustments during the term of the lease. This provides a more stable underpinning to returns than in public equities.
- The cashflows from infrastructure projects are less sensitive to the economic cycle than the broader equity market. Some also have an inflation-linkage. This provides stability to returns from both infrastructure equity and debt investments. This asset class historically also has low correlation to traditional asset classes. Additionally, infrastructure projects are often backed by governments or corporate entities with strong credit ratings.
- Renewable energy assets, such as windfarms often benefit from long-term contracts with government or government-affiliated entities. In some markets, such as the UK, these have contractual inflation-linkages.
- For a given asset, a more leveraged investment is riskier than a less leveraged one. The average private equity large buyout is around 55% debt financed whereas for the average S&P 500 company the equivalent figure is less than 50%. This would suggest that large buyouts are riskier than public equities.
- By the same argument, it is wrong to automatically jump to the conclusion that all private equity buyouts are riskier than public markets. Small- and mid-cap buyouts are less highly leveraged and some other strategies employ little or no leverage at all.
- Individual funds of private assets are less diversified than public market funds and so are riskier from this perspective. However, this risk can be mitigated at the portfolio level by spreading investments across a number of funds over time and/or by investing in funds of funds.
- The controlling stakes that private equity investors typically take in their portfolio companies afford them more access to information in a more timely manner than would be possible in public markets. This ability to do much deeper due diligence helps to mitigate the risk of any individual investment and thereby avoid unwelcome surprises.
- Real estate and infrastructure debt come with the advantage that they are normally secured on physical assets such as airports, toll roads or buildings. In the event of a default, an asset or assets can be sold and the proceeds used to repay the lender. This boosts recovery rates and limits losses. For example, recovery rates for infrastructure and real estate debt average around 75%, substantially more than the 40% level typical on corporate bonds.
Figure 6: Private assets have different underlying risks to public markets
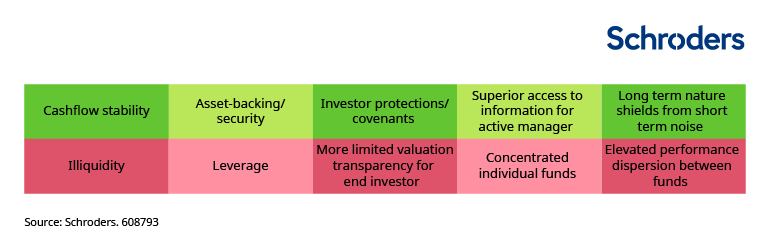
Source: Schroders
Other diversifying asset classes such as insurance-linked securities, or certain types of hedge funds, can also help investors manage risk at the overall portfolio level. For example, multi-strategy hedge funds and equity market neutral strategies can mitigate downside risk, dampening volatility and provide an additional source of returns. This article describes the role that these strategies can play, while this provides more details on the potential of insurance-linked securities.
Recommendation: Investors should consider adding non-traditional, diversifying asset classes to reduce risk and volatility, taking into consideration the nuances and additional factors it brings to portfolios.
2. Asset allocation within asset classes
At times, it felt like the last decade often did not reward diversification within asset classes. In equities, the US market was the top performing market in seven of ten years, handsomely outpacing the rest (Figure 7).
Figure 7: US equities trounced the rest over the past ten years
Performance leadership table in USD terms
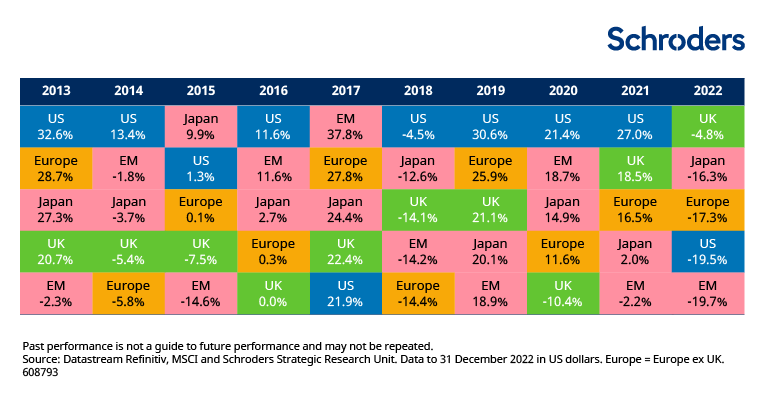
Past performance is not a guide to future performance and may not be repeated.
Source: Datastream Refinitiv, MSCI and Schroders Strategic Research Unit. Data to 31 December 2022 in US dollars. Europe = Europe ex UK.
However, the past decade has left many markets heavily concentrated. The US now makes up 68% of global developed markets (Figure 8), and its performance is increasingly being driven by a narrow band of mega-cap technology stocks. In emerging markets, the growth-biased Asian markets represents 79%, with the big three of China, Korea, and Taiwan making up 58% (Figure 9).
Figure 8: The US dominates developed markets
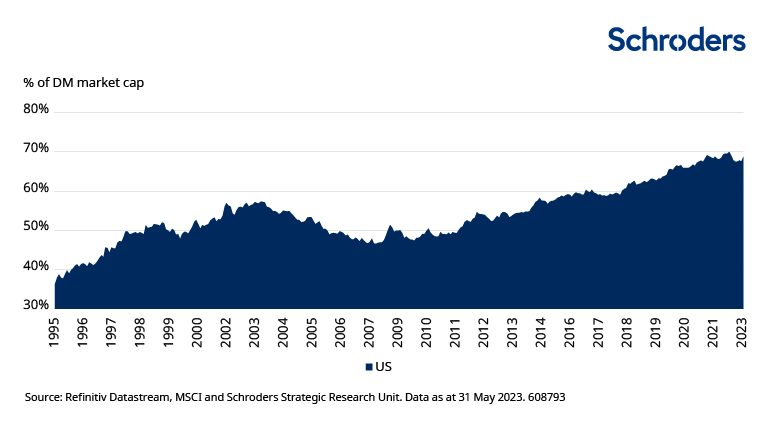
Figure 9: EM equities are dominated by Asia
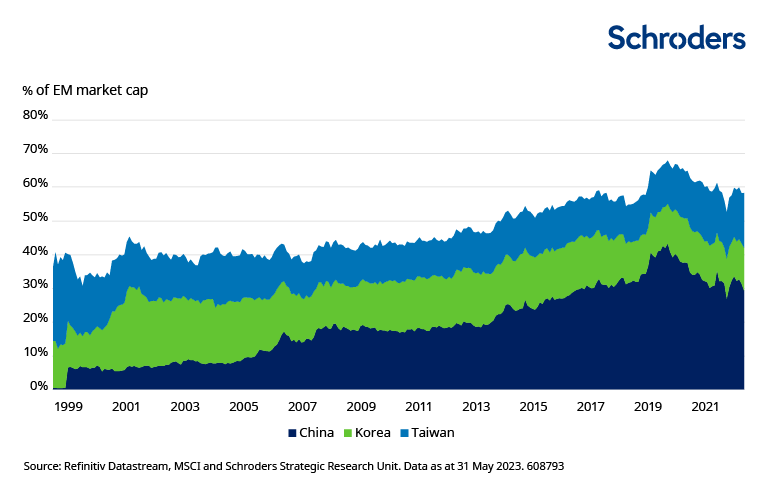
Source: Refinitiv Datastream, MSCI and Schroders Strategic Research Unit. Data as at 31 May 2023.
Heavy concentration can be an issue, and is often a fickle friend or foe. Seven large US companies (Figure 12) have driven almost all of US equities’ gain this year.
Figure 10: 2020-2021 big winners, Figue 11: 2022 big loser, Figure 12: 2023 YTD big winners
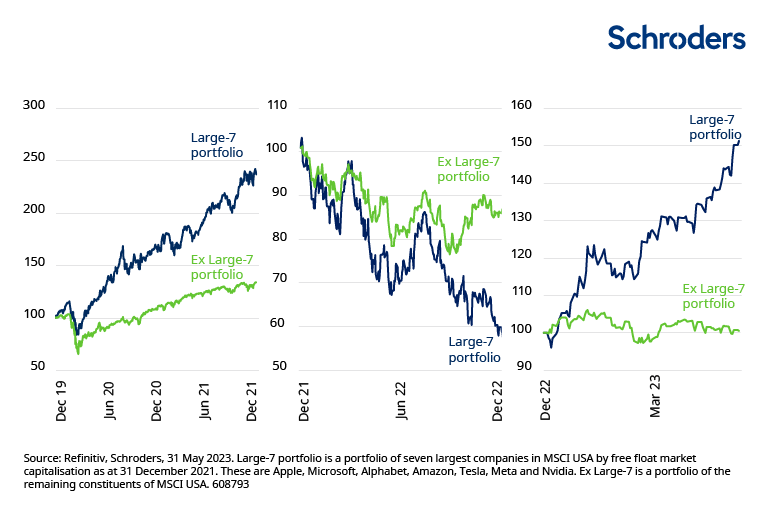
Global equity investors are likely to find that their portfolios have become heavily skewed by country, style, and stock. This brews up additional risk. To build genuinely diversified portfolios will require careful monitoring of these exposures, and a greater flexibility to diverge from benchmark indices when required.
What about bonds? While not discussed as often, issuer concentration risks also exist within corporate bonds. Within global corporate bond indices, the financials sector dominates with a 35% weight (Figure 13).
Figure 13: Financials taking a big chunk of the corporate bond pie
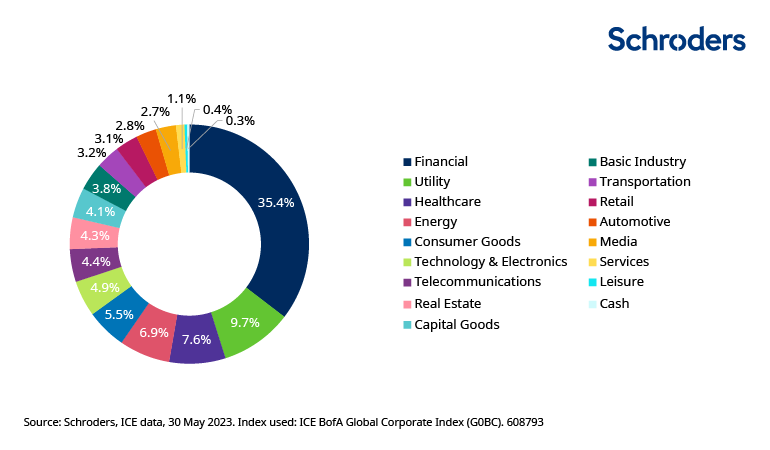
Source: Schroders, ICE data, 30 May 2023. Index used: ICE BofA Global Corporate Index (G0BC).
This can pose an issue, especially in times of markets crisis. Think back to a couple of months ago – when Silicon Valley Bank and Credit Suisse collapsed. Bond investors who were unknowingly overexposed to financial issuers may have felt the tremors, with US regional banks at the epicentre.
Recommendation: Investors should monitor the underlying country, style, sector, and issuer exposures in their portfolios. Consideration should be given to greater use of active management to deviate from benchmark weights, in order to build genuinely diversified portfolios and to adjust exposures to suit different market environments.
3. By using portfolio management techniques
Rebalancing of portfolios can help reduce portfolio volatility and keep asset allocation closer to the originally intended target. This is particularly important if certain assets outperform dramatically, leading to allocation drift. Drifts in allocation also causes portfolio volatility to deviate. In Figure 14, both portfolios started out with a 60% equity and 40% bonds allocation in 1980, but one is rebalanced monthly while the other is left “as is”. With equity outperforming through the years, its weight in the “as is” portfolio would have increased to 91% at 31 May 2023. Its volatility would have been 25% higher than the rebalanced portfolio over the past 12 months.
The appropriate rebalancing strategy also needs to take account of transaction costs. A detailed discussion of this is outside the scope of this article.
Figure 14: Portfolios left alone tend to exhibit higher volatility
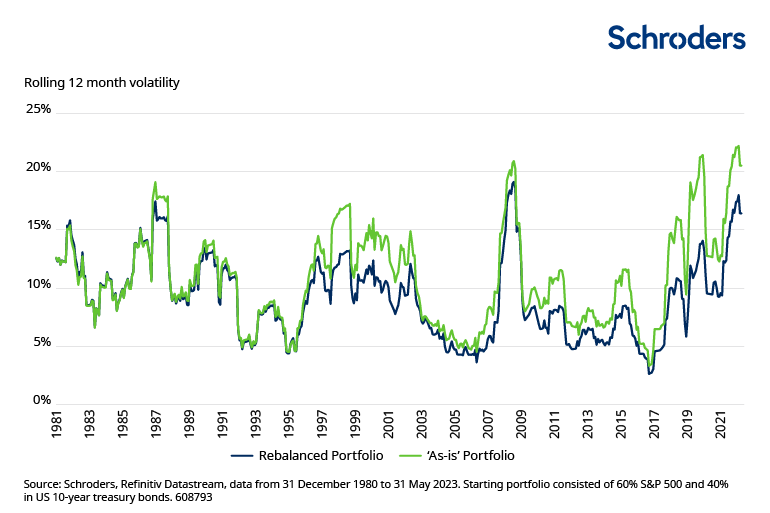
Source: Schroders, Refinitiv Datastream, data from 31 December 1980 to 31 May 2023. Starting portfolio consisted of 60% S&P 500 and 40% in US 10-year treasury bonds.
Another portfolio management technique is to implement a volatility cap. This is a fairly simply and effective mechanism: a maximum fixed level of volatility for the portfolio is set and whenever the volatility cap is breached, the portfolio manager sells risky assets (i.e. equities) and purchases less risky ones (i.e. cash). If the volatility of the risky assets continue to rise, then the risky asset will continue to be reduced. Subsequently, once volatility of equities subsides, we can gradually reinvest the cash back, taking care not to breach the volatility cap.
One caveat is that portfolios, having de-risked during tumultuous periods, often lag non-vol capped portfolios in market recoveries. The trade-off from lower volatility can be a reduction in long-term returns. Despite this limitation, this methodology is effective in systematically containing volatility within pre-defined limits.
Derivatives can also be used to limit downside losses. Put options enable investors to put a floor under losses , although come at the cost of paying option premiums over time (like an insurance premium). Ways to mitigate this cost-drag include collar strategies. These involve selling options to give up any upside over a certain level. This premium income can be used to fully or partially offset the cost of buying the downside protection. The investors’ return profile ends up with a floor on downside losses, and a cap on upside gains. A detailed discussion of derivative strategies is outside the scope of this article.
Recommendation: Asset owners should incorporate a rebalancing strategy. Those with more fixed views of the volatility or capital loss that they are willing or able to tolerate should consider portfolio management techniques. These can deliver more precise control of these risks.
In conclusion…
The world has changed and with that, portfolios need to evolve. Diversification is likely to become increasingly important, both between and within asset classes. Commodities have been shunned by many investors but have the potential to play an increasingly important role in managing risk at the overall portfolio level. Investors should also consider adding or increasing their exposure to private assets. These can reduce volatility and risk, but careful understanding of the drivers is important, as these vary from private asset class to asset class. A more active approach to monitoring and managing country, style, and stock-specific exposures within asset classes is also likely to be important, given how concentrated some markets have become. Finally, investors can utilise portfolio management techniques which can limit volatility and downside losses.
The appropriate combination of the levers will vary from investor to investor, depending on risk tolerance, objectives and constraints. We may be entering more unfamiliar territory – a higher volatility regime – but that does not mean there is nothing investors can do about it.


