Through July 2023 With Forecasts Through July 2024
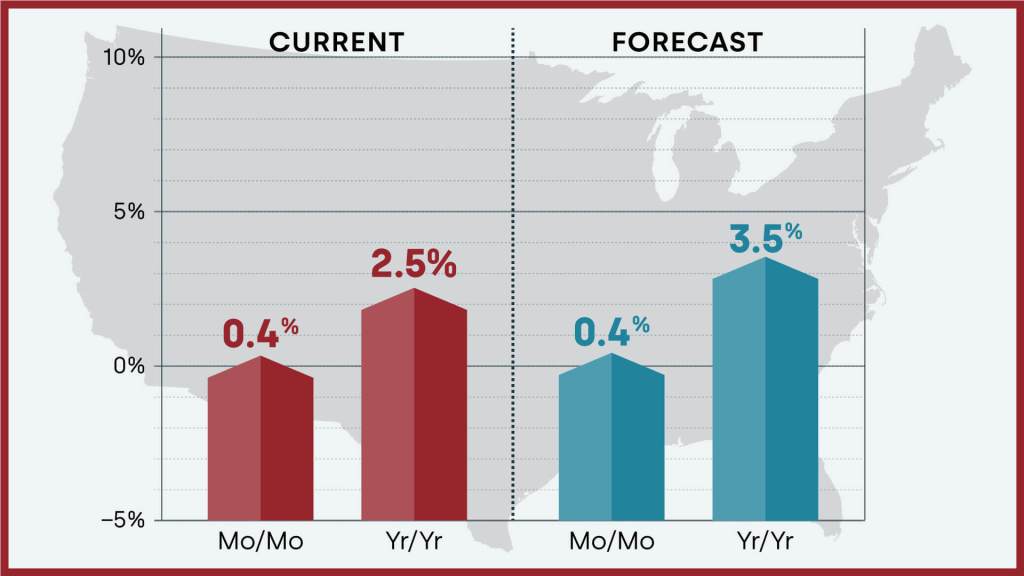
Home prices nationwide, including distressed sales, increased year over year by 2.5% in July 2023 compared with July 2022. On a month-over-month basis, home prices increased by 0.4% in July 2023 compared with June 2023 (revisions with public records data are standard, and to ensure accuracy, CoreLogic incorporates the newly released public data to provide updated results).
Forecast Prices Nationally
The CoreLogic HPI Forecast indicates that home prices will increase on a month-over-month basis by 0.4% from July 2023 to August 2023 and increase on a year-over-year basis by 3.5% from July 2023 to July 2024.
Annual U.S. Home Price Growth Rebounds in July
U.S. home price gains rebounded year over year in July, increasing to 2.5%, and following two months of 1.6% annual gains. The annual reacceleration reflects six consecutive monthly gains, which drove prices some 5% higher compared to their bottom in February. The 11 states that saw home price declines were all in the West, but since many of those markets have inventory shortages, that trend may be short-lived, and recent buyer competition will cause prices to heat up again. CoreLogic projects that all states that saw year-over-year losses in July will begin posting gains by October of this year.
“Annual home price growth regained momentum in July, which mostly reflects strong appreciation from earlier this year. That said, high mortgage rates have slowed additional price surges, with monthly increases returning to regular seasonal averages. In other words, home prices are still growing but are in line with historic seasonal expectations.
Nevertheless, the projection of prolonged higher mortgage rates has dampened price increase forecasts over the next year, particularly in less-affordable markets. But as there is still an extreme inventory shortage in the Western U.S., home prices in some of those markets should see relatively more upward pressure.”
Selma Hepp
– Chief Economist for CoreLogic
HPI National and State Maps – July 2023
The CoreLogic HPI provides measures for multiple market segments, referred to as tiers, based on property type, price, time between sales, loan type (conforming vs. non-conforming) and distressed sales. Broad national coverage is available from the national level down to ZIP Code, including non-disclosure states.
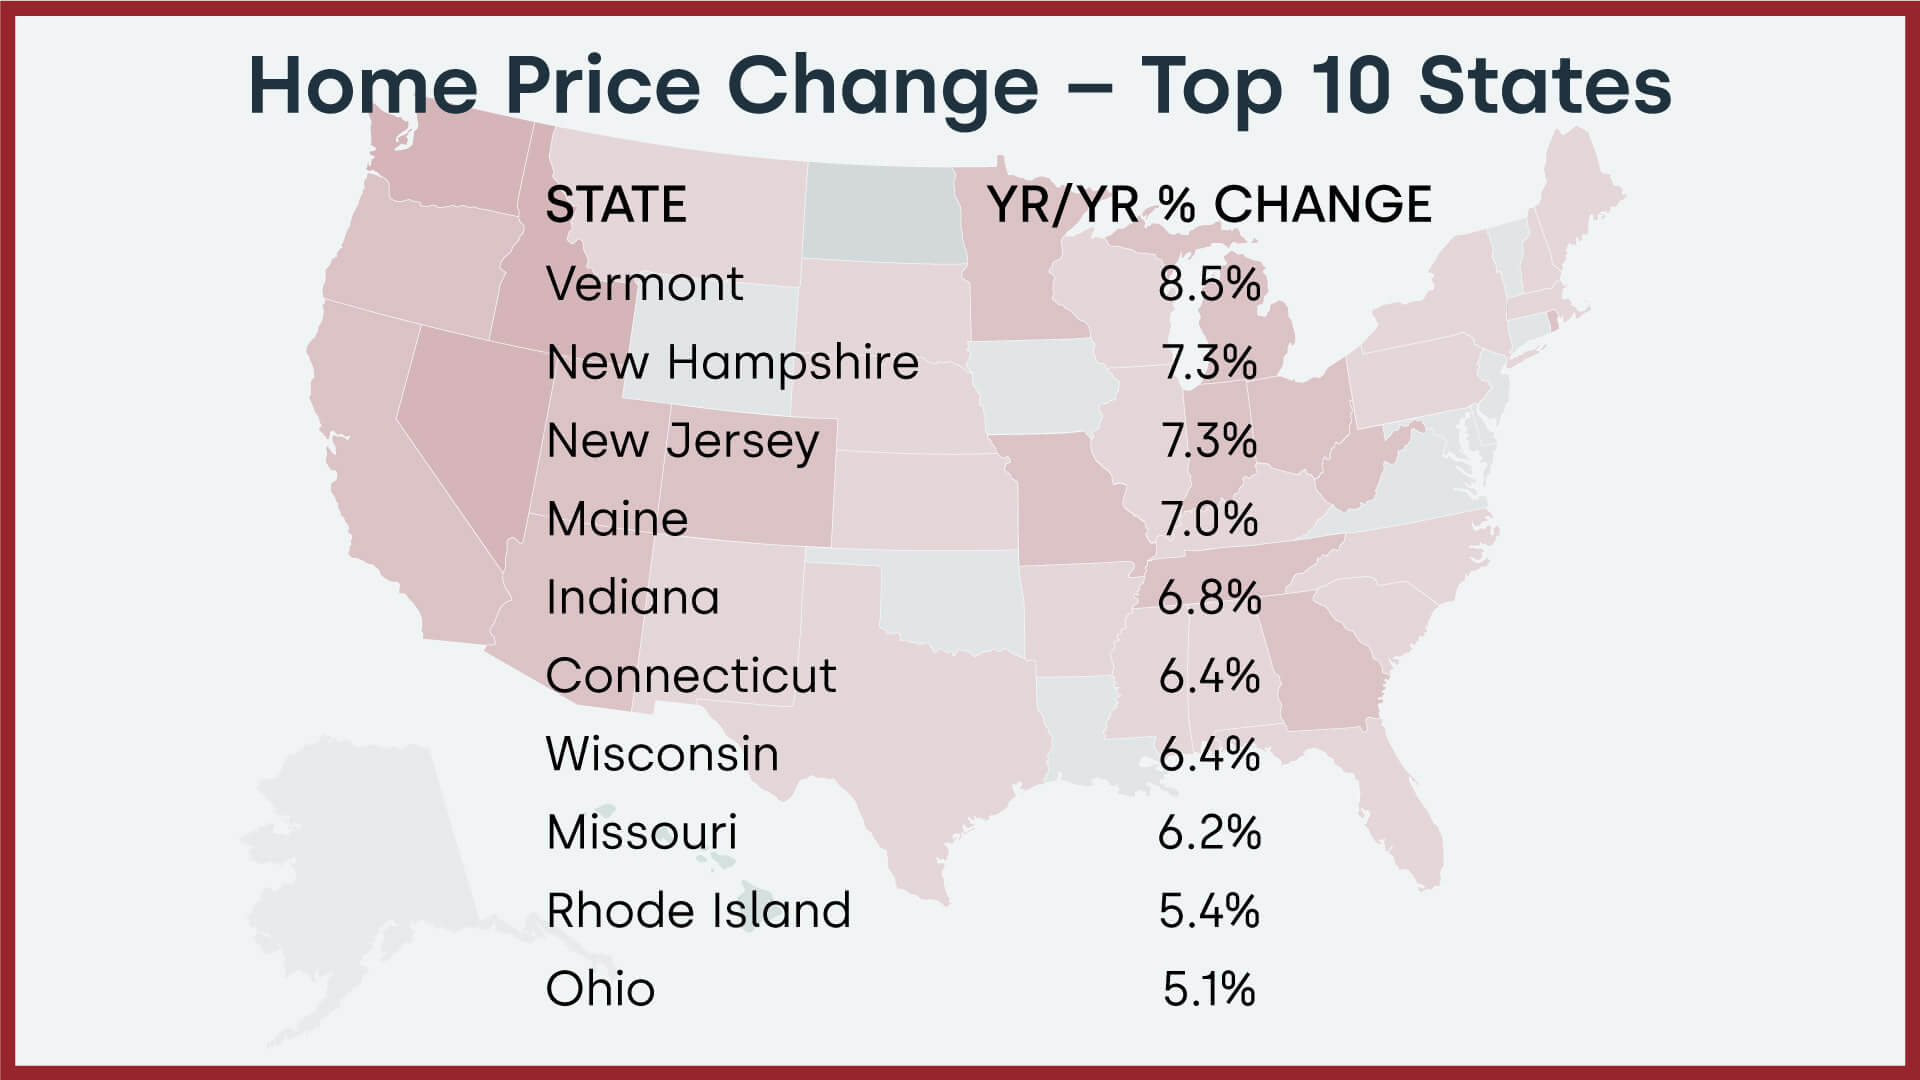
Nationally, home prices increased by 2.5% year over year in July. Arizona, California, Colorado, Idaho, Montana, Nevada, Oregon, Texas, Utah, Washington and Wyoming saw annual declines in home prices. The states with the highest increases year over year were Vermont (8.5%) and New Hampshire and New Jersey (both 7.3%).
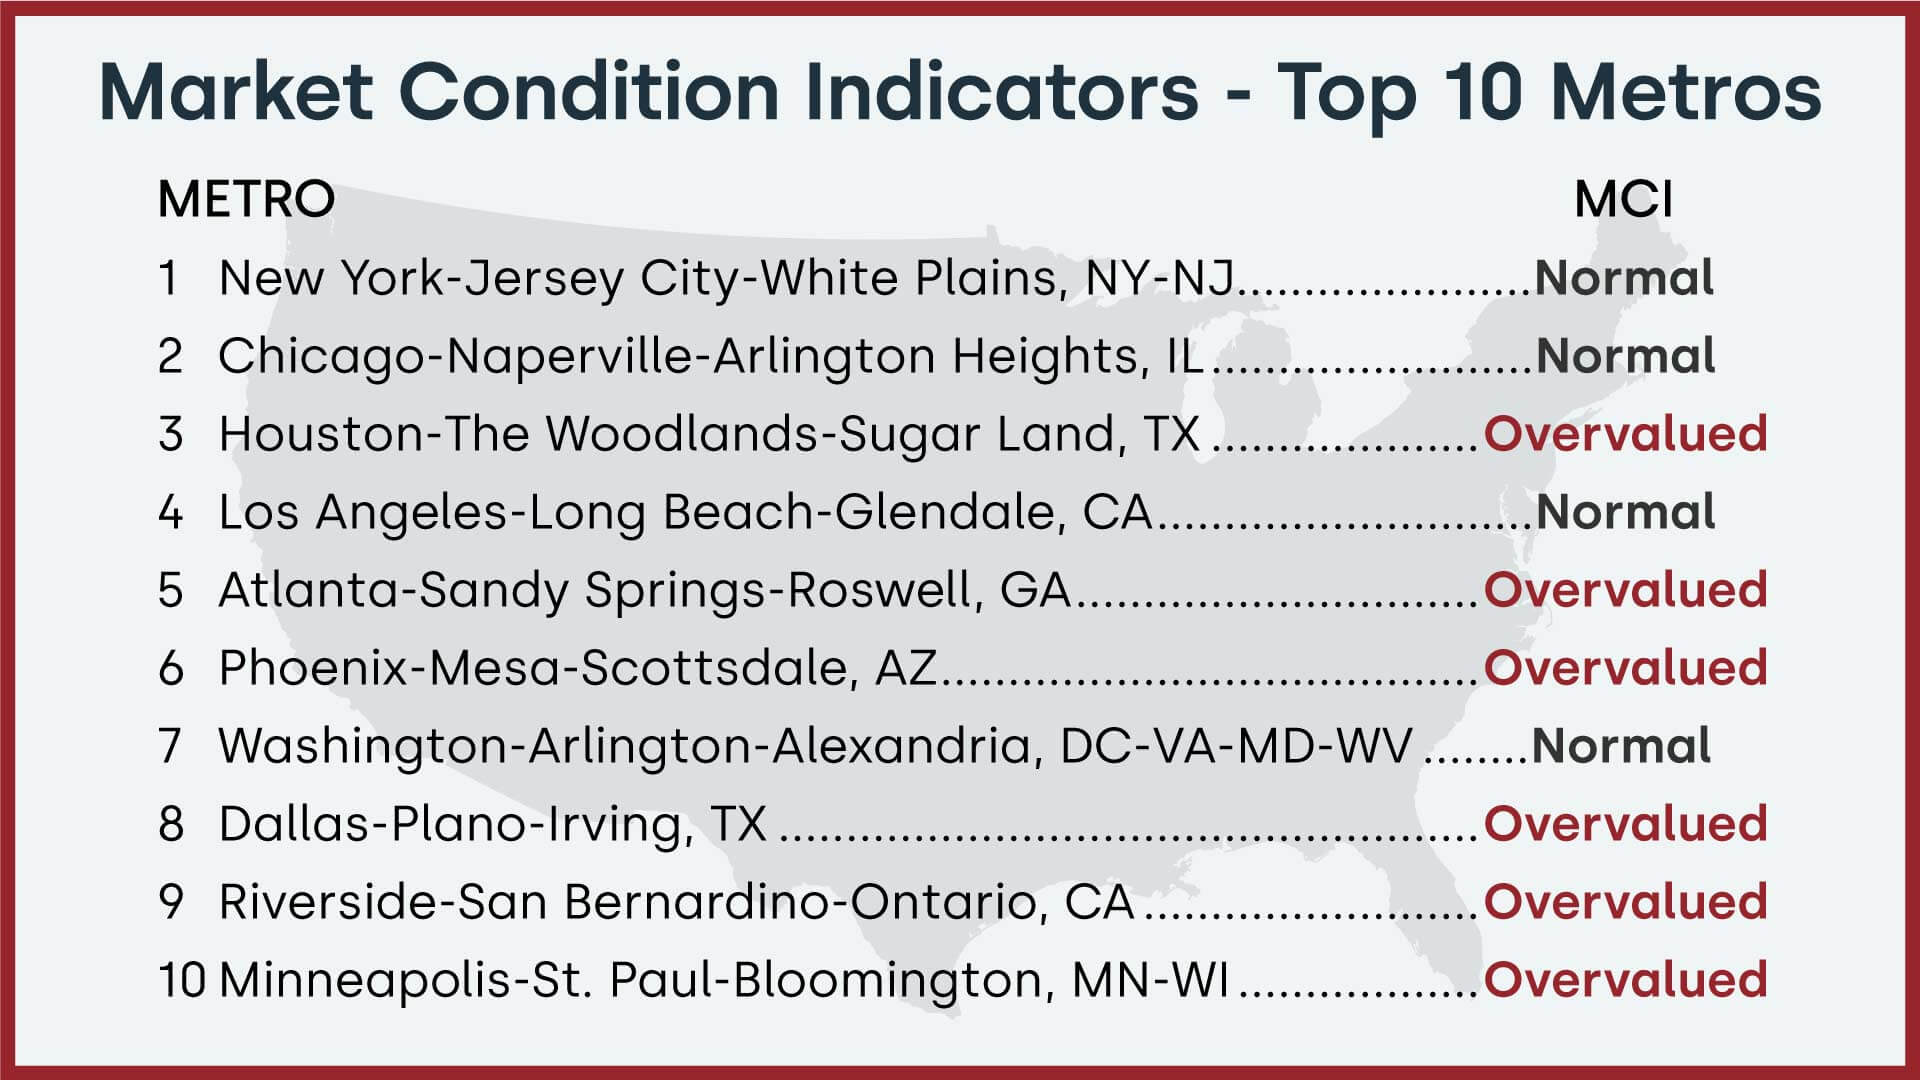
HPI Top 10 Metros Change
The CoreLogic HPI provides measures for multiple market segments, referred to as tiers, based on property type, price, time between sales, loan type (conforming vs. non-conforming) and distressed sales. Broad national coverage is available from the national level down to ZIP Code, including non-disclosure states. Below is a look at home price changes in large U.S. metros in July, with Miami again posting the largest gain at 9% year over year.
Markets to Watch: Top Markets at Risk of Home Price Decline
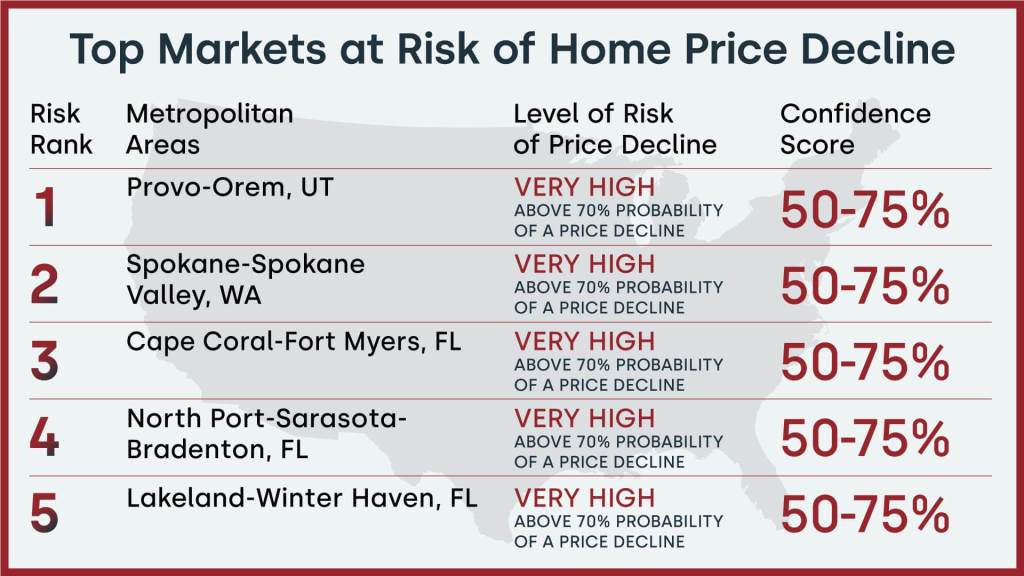
The CoreLogic Market Risk Indicator (MRI), a monthly update of the overall health of housing markets across the country, predicts that Provo-Orem, UT is at a very high risk (70%-plus probability) of a decline in home prices over the next 12 months. Spokane-Spokane Valley WA, Cape Coral-Fort Myers, FL, North Port-Sarasota-Bradenton, FL and Lakeland- Winter Haven, FL are also at very high risk for price declines.
Summary
CoreLogic HPI features deep, broad coverage, including non-disclosure state data. The index is built from industry-leading real-estate public record, servicing, and securities databases—including more than 40 years of repeat-sales transaction data—and all undergo strict pre-boarding assessment and normalization processes.
CoreLogic HPI and HPI Forecasts both provide multi-tier market evaluations based on price, time between sales, property type, loan type (conforming vs. non-conforming) and distressed sales, helping clients hone in on price movements in specific market segments.
Updated monthly, the index is the fastest home-price valuation information in the industry—complete home-price index datasets five weeks after month’s end. The Index is completely refreshed each month—all pricing history from 1976 to the current month—to provide the most up-to-date, accurate indication of home-price movements available.
Methodology
The CoreLogic HPI™ is built on industry-leading public record, servicing and securities real-estate databases and incorporates more than 40 years of repeat-sales transactions for analyzing home price trends. Generally released on the first Tuesday of each month with an average five-week lag, the CoreLogic HPI is designed to provide an early indication of home price trends by market segment and for the “Single-Family Combined” tier, representing the most comprehensive set of properties, including all sales for single-family attached and single-family detached properties. The indices are fully revised with each release and employ techniques to signal turning points sooner. The CoreLogic HPI provides measures for multiple market segments, referred to as tiers, based on property type, price, time between sales, loan type (conforming vs. non-conforming) and distressed sales. Broad national coverage is available from the national level down to ZIP Code, including non-disclosure states.
CoreLogic HPI Forecasts™ are based on a two-stage, error-correction econometric model that combines the equilibrium home price—as a function of real disposable income per capita—with short-run fluctuations caused by market momentum, mean-reversion, and exogenous economic shocks like changes in the unemployment rate. With a 30-year forecast horizon, CoreLogic HPI Forecasts project CoreLogic HPI levels for two tiers — “Single-Family Combined” (both attached and detached) and “Single-Family Combined Excluding Distressed Sales.” As a companion to the CoreLogic HPI Forecasts, Stress-Testing Scenarios align with Comprehensive Capital Analysis and Review (CCAR) national scenarios to project five years of home prices under baseline, adverse and severely adverse scenarios at state, metropolitan areas and ZIP Code levels. The forecast accuracy represents a 95% statistical confidence interval with a +/- 2% margin of error for the index.
About Market Risk Indicators
Market Risk Indicators are a subscription-based analytics solution that provide monthly updates on the overall “health” of housing markets across the country. CoreLogic data scientists combine world-class analytics with detailed economic and housing data to help determine the likelihood of a housing bubble burst in 392 major metros and all 50 states. Market Risk Indicators is a multi-phase regression model that provides a probability score (from 1 to 100) on the likelihood of two scenarios per metro: a >10% price reduction and a ≤ 10% price reduction. The higher the score, the higher the risk of a price reduction.
Source: CoreLogic
The data provided are for use only by the primary recipient or the primary recipient’s publication or broadcast. This data may not be resold, republished or licensed to any other source, including publications and sources owned by the primary recipient’s parent company without prior written permission from CoreLogic. Any CoreLogic data used for publication or broadcast, in whole or in part, must be sourced as coming from CoreLogic, a data and analytics company. For use with broadcast or web content, the citation must directly accompany first reference of the data. If the data are illustrated with maps, charts, graphs or other visual elements, the CoreLogic logo must be included on screen or website. For questions, analysis or interpretation of the data, contact Robin Wachner at newsmedia@corelogic.com. For sales inquiries, visit https://www.corelogic.com/support/sales-contact/. Data provided may not be modified without the prior written permission of CoreLogic. Do not use the data in any unlawful manner. The data are compiled from public records, contributory databases and proprietary analytics, and its accuracy is dependent upon these sources.
About CoreLogic
CoreLogic is a leading global property information, analytics and data-enabled solutions provider. The company’s combined data from public, contributory and proprietary sources includes over 4.5 billion records spanning more than 50 years, providing detailed coverage of property, mortgages and other encumbrances, consumer credit, tenancy, location, hazard risk and related performance information. The markets CoreLogic serves include real estate and mortgage finance, insurance, capital markets, and the public sector. CoreLogic delivers value to clients through unique data, analytics, workflow technology, advisory and managed services. Clients rely on CoreLogic to help identify and manage growth opportunities, improve performance and mitigate risk. Headquartered in Irvine, Calif., CoreLogic operates in North America, Western Europe and Asia-Pacific. For more information, please visit www.corelogic.com.
CORELOGIC, the CoreLogic logo, CoreLogic HPI and CoreLogic HPI Forecast are trademarks of CoreLogic, Inc. and/or its subsidiaries. All other trademarks are the property of their respective owners.


