

15

 By Prof. Viral V. Acharya, C.V. Starr Professor of Economics, Department of Finance, New York University Stern School of Business (NYU-Stern), and Satish Mansukhani, Managing Director, Investment Strategy, Rithm Capital
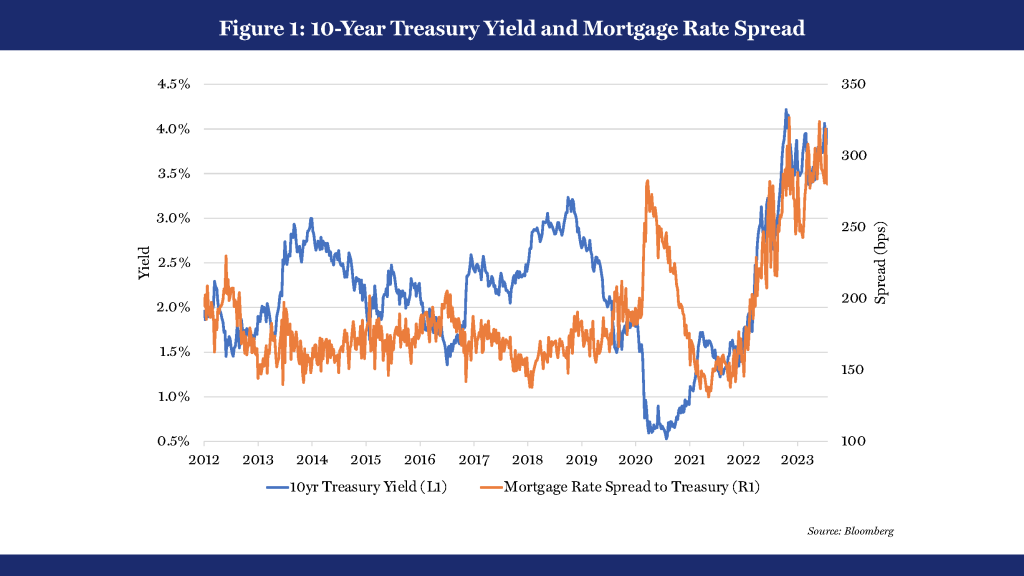
Since the onset of the Federal Reserve’s (the Fed’s) monetary tightening in 2022, the 30-year fixed mortgage rate in the United States (US) has gapped out to 7 percent. Around 300 basis points (bps) at present above the 10-year US Treasury yield (see Figure 1), this spread has historically been stable at around 200 bps; this was the case even during the pre-pandemic interest-rate hikes (2016-19) and quantitative tightening (QT, 2017-20) episodes.
Why is this time different?
We explain below that the current break from this trend is caused critically by the interplay of the Fed’s and domestic banks’ balance sheets. Changes in the risk appetites of institutional investors (bank and non-bank) and the profitability considerations of mortgage lenders have combined with this interplay to produce an unprecedentedly fast and amplified passthrough of monetary tightening to mortgage rates.
Deconstructing the 30-year mortgage rate
In addition to the 10-year Treasury yield, the 30-year primary mortgage rate serves as a commonly cited benchmark for the US economy and financial markets. Two contributors drive the spread between this mortgage rate and the Treasury yield.
The first contributor is the yield offered on the benchmark mortgage-backed securities (MBS) issued by government-sponsored enterprises Fannie Mae and Freddie Mac—the so-called “agency MBS basis”. This basis reflects the risk appetites of institutional investors to absorb or “warehouse” mortgage interest-rate risks on their balance sheets.
The second contributor is the profitability margin for mortgage lenders, known as the “primary-secondary spread”. It captures not only the market power of lenders in mortgage markets but also the banking sector’s balance-sheet constraints in intermediating for the real economy.
Consider, in turn, the 10-year Treasury yields and each of these contributors to the mortgage spread.
Punch #1: Higher 10-year US Treasury yields, driven up by real rates
Excessive monetary and fiscal stimulus throughout the pandemic combined with supply-side shocks to induce a surge in inflation since 2021. Until the last few months, this bout of inflation appeared rather unrelenting. In response, the Fed has tightened its monetary policy aggressively to cool inflation and the economy, and the 10-year Treasury yields, which were just 50 bps in 2020, are now close to 4 percent, a full 350 bps higher.
Viewed through another lens, the 10-year real rate has risen from a pandemic low of negative 100 bps to a post-GFC (Global Financial Crisis of 2007-08) high of 150 bps. Immediately before the pandemic, and even during the rate-hike and QT episodes of the mid-2010s, this real rate stood at barely 50 bps. The overall rise in real rates has also lifted mortgage rates.
Punch #2: A wider agency MBS basis, driven by higher volatility and a reversal in technicals
The agency MBS basis can be considered the market price of the unique option presented to US borrowers to refinance their mortgages or lock in attractive fixed rates (as is the case currently). The higher the volatility and the wider the outlook for the range of interest rates, the higher the price of this option. Compared to the mid-2010s’ rate hikes and QT, agency MBS spreads are 60 to 80 bps wider today.
For about 12 months after the onset of monetary tightening in March 2022, the 30-day rolling correlation of the agency MBS basis to interest-rate volatility (MOVE Index) remained high, ranging from 60 to 80 percent (that the two series were highly correlated until March 2023 can be seen in Figure 2).
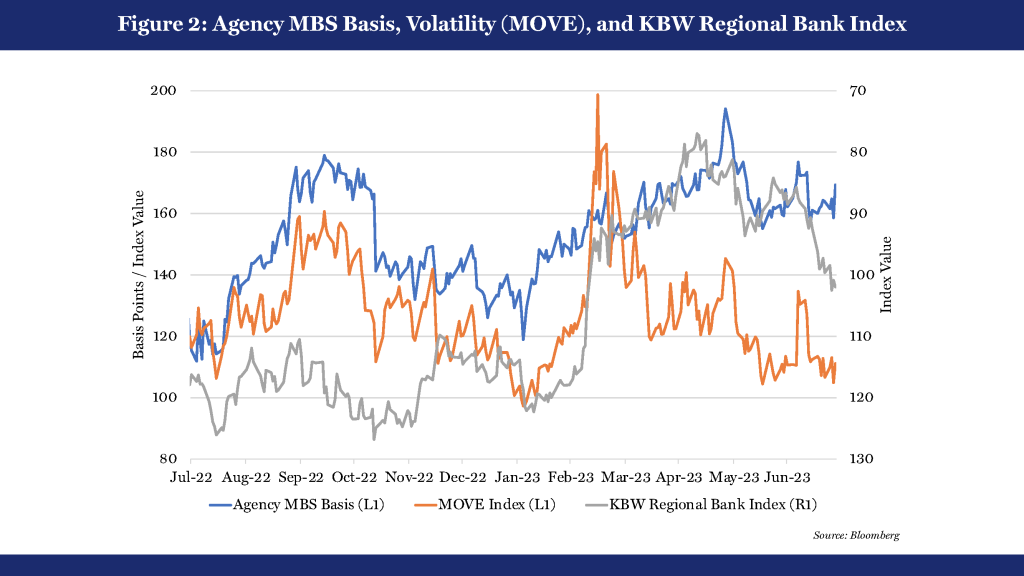
However, the “technicals” of the MBS market today have shifted dramatically, with the Fed and domestic banks as the largest holders of this asset class. A key US bank dynamic has emerged since March 2023, given the collapses of three regional banks: Silicon Valley Bank (SVB), First Republic Bank and Signature Bank. In their wake, the agency MBS basis’s correlation to rate volatility has dipped, as seen by the rising agency MBS basis and declining MOVE Index. In contrast, the correlation of basis to the inverse of the stock valuation of regional banks has risen (again, see the individual series in Figure 2), reaching a peak of 35 percent in May 2023, marking the low in the regional bank index and simultaneously a high in the basis.
Punch #3: Wider mortgage-lender margins, driven by low volumes and high volatility
Turning to mortgage-lender margins, mortgage lending is a volume business in terms of the profits it generates for lenders and largely depends on refinancing transactions. Today’s high mortgage rates place a significant disincentive in the economics of the majority of US borrowers who have “locked in” at post-pandemic ultra-low rates, shriveling down lender volumes to mostly purchase transactions. The resulting low volume of home sales is thus translating into high competition among mortgage lenders.
High competition suggests banks should be willing to tighten margins. However, lender margins are modestly higher today than in the mid-2010s’ rate-hike and QT episodes, ranging back then between 90 and 100 bps compared to the present 110 and 120 bps. A key factor driving this margin wider is (again!) higher rate volatility, which increases the pipeline hedging costs of mortgage lenders during the period they commit to making a loan to closing and eventually pooling the loan into an MBS through securitization. This balance-sheet effect seems to have swamped the competitive effect.
Amplifying it all: banks’ and the Fed’s balance sheets moving in tandem
An additional factor has, however, made the confluence of these three effects even more potent.
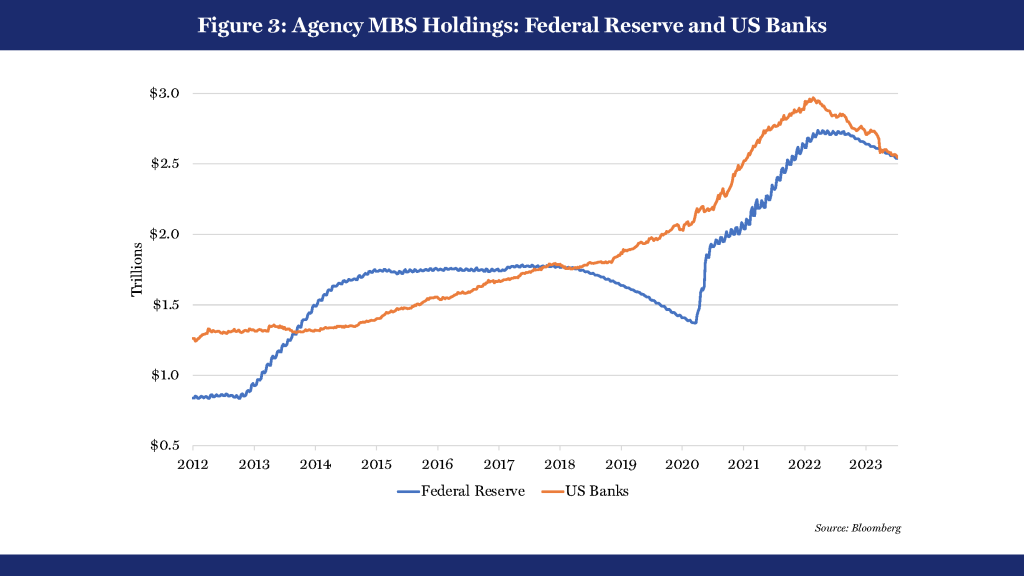
The GFC, notably the distress in the housing and mortgage sectors, depleted both the capital and liquidity of banks, the largest mortgage lenders then. The nature of the post-GFC regulations and rules, notably the Dodd-Frank Act (Dodd-Frank Wall Street Reform and Consumer Protection Act), has made it costlier for banks to step into mortgages and MBS. In fact, a number of banks stepped away altogether from mortgage lending and servicing. The Fed filled this gap with some of its post-GFC quantitative-easing (QE) programs to support the mortgage and housing sectors. This backdrop led to relatively low levels of stable growth in the bank ownership of mortgages and MBS leading into the mid-2010s (see Figure 3).
However, as the Fed then halted QE and eventually embarked on QT, other rules, especially the favorable treatment of agency MBS as “high-quality liquid assets” in calculating the liquidity coverage ratio (LCR), led to a rise in the banks’ demands for MBS. This helped stabilize the MBS sector. And although banks made some (unrecognized) losses on their securities holdings by the end of the tightening cycle, cumulatively, the losses remained in aggregate below $75 billion.
Progression from this period into the pandemic saw the balance-sheet holdings of banks and the Fed paralleling (again, see Figure 3). The substantial stimulus led to an abundance of deposits (insured and uninsured) and low-yielding reserves at banks—but due to low demand in 2020, also a relative absence of sufficiently higher-yielding corporate loans in which to invest. The ultra-low rates and flat yield curve thus led to a search for yields, driving banks to buy Treasuries and agency MBS instead.
The post-pandemic monetary tightening of 2022 thus started with a far greater concentration of liquid-asset holdings in the hands of two large, correlated sets of balance sheets—namely, the Fed’s and the banks’. At present, new MBS issuances essentially have demand from neither, implying that the agency MBS basis is driven almost entirely by the risk appetites of non-bank institutional investors. As these investors are far more prone to rollover risks from heightened volatility, they demand greater risk premiums than banks typically would. This has significantly amplified the triple punch delivered to mortgage rates by monetary tightening.
What’s next?
An important lesson is that the unprecedented scale of fiscal and monetary stimulus during the pandemic worked through the commercial-banking system, creating the path dependency in how monetary tightening is now playing out, especially for mortgage markets.
Paradoxically, as mortgage rates rise, the willingness of labor in the US to adjust to sectoral demands lessens as the lock-in effects of ultra-low mortgage rates keep households from moving. This, in turn, keeps labor markets tight, wages high and inflation stubborn.
The Fed is thus caught between a rock and a hard place, with the demand- and supply-side effects of its tightening working in opposite directions. Which way will the pendulum swing? It is hard to know, but this may precisely be why interest-rate volatility has remained high.
ABOUT THE AUTHORS
Satish Mansukhani is the Managing Director, Investment Strategy, at Rithm Capital, a financial-services firm headquartered in New York City. In his prior roles as a sell-side strategist at Bank of America, Credit Suisse and Bear Stearns, Satish was perennially ranked for his work by Institutional Investor magazine.


