EzumeImages/iStock via Getty Images
We better understand the essence of our macro-economic system, when black swans (like vultures) are circling, to inform our economic and investment choices. We need to dig right into the structuring of that system to identify the most likely macroeconomic outcomes when once again we are confronted by systemic risks. We need to cut right through the rhetoric and narratives which may cloud our understanding of what next to expect. This is an investment environment where getting it wrong can have devastating financial consequences.
The biggest, blackest, bald-headed, and the mother of all economic black swans circling in the present macroeconomic space is Debt. The data is readily available, and I sourced “official” global debt data from the International Monetary Fund (“IMF”) database. They depicted increased debt levels in shades of green which is somewhat disconcerting. I would normally associate debt with red rather than green. Red flags, deep in the red, all you see is red ink, my credit card is in the red, etc. Perhaps the debt would be less of a problem if we just see it as green rather than red. So, is there a green (or red) debt problem? A review of debt data in the largest global economies will reveal the facts.
Debt
Central Government Debt
The norm is to compare the public debt of countries to the size of their economies, which is represented by the Gross Domestic Product of a country or generally referred to as a country’s GDP. This variable is called the Debt-to-GDP ratio and is generally also used to assess a country’s ability to repay its sovereign debt. Public debt includes all government debt, but the IMF public debt data is very limited and basically useless in our opinion, so we are stuck with Central Government Debt data. Data is also only available up to the end of 2021, though it will suffice. It is, however, important to realize that Central Government Debt will be less than Total Public Debt and, in many cases, may well be materially less than Total Public Debt. This analysis will concentrate on the top 10 global economies by GDP as ranked by the World Bank to acquaint our insights on a global scale.
World Bank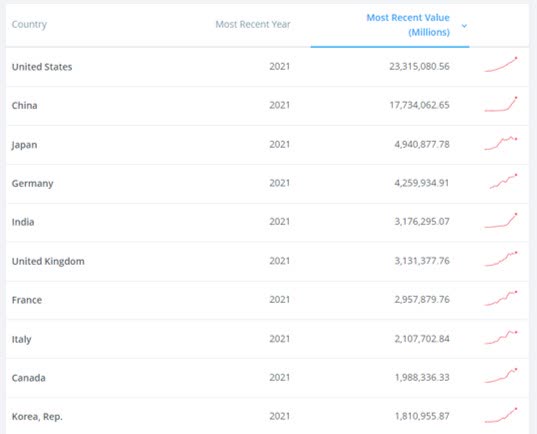
World Bank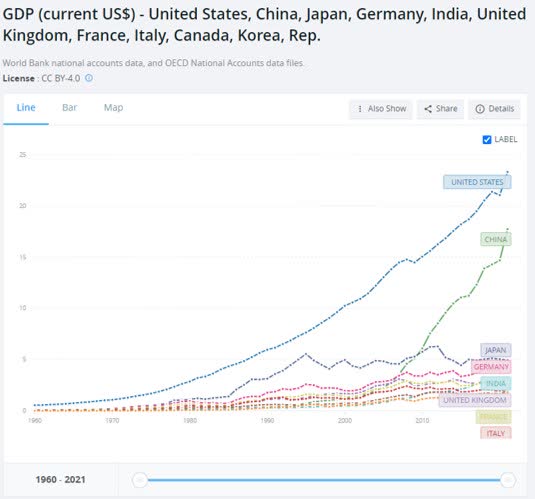
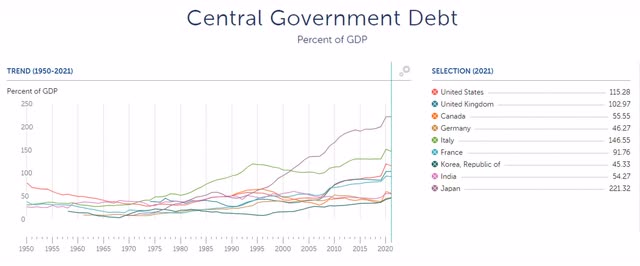
Central Government Debt data for the top ten global economies by GDP as at the end of 2021, as sourced from the IMF.
Data for China’s Central Government Debt is not published by the IMF. Statista estimates the China Government Debt-to-GDP ratio for 2021 at 71.48%.
Just looking at the data in isolation is meaningless. We need to know at what level of Debt-to-GDP ratio, debt becomes problematic, and we also need to evaluate how debt levels escalated over time.
The World Bank published a paper in 2010, after the 2008 Global Financial Crises, estimating that a country should not exceed a Debt-to-GDP ratio of more than 77%. (“Finding the Tipping Point-When Sovereign Debt Turns Bad”).
“The estimations establish a threshold of 77 percent public debt-to-GDP ratio. If debt is above this threshold, each additional percentage point of debt costs 0.017 percentage points of annual real growth.”
Historically the view was that countries should not exceed a 60% Debt-to-GDP ratio but with Modern Monetary Theory, that view as well as the World Bank view is challenged, and it is argued that counties can just infinitely print money to cover debt.
“The central idea of modern monetary theory (“MMT”) is that governments with a fiat currency system under their control can and should print (or create with a few keystrokes in today’s digital age) as much money as they need to spend because they cannot go broke or be insolvent unless a political decision to do so is taken.
… according to MMT:
Large government debt isn’t the precursor to collapse that we have been led to believe it is;
Countries like the U.S. can sustain much greater deficits without cause for concern; and
A small deficit or surplus can be extremely harmful and cause a recession since deficit spending is what builds people’s savings.”
We will need to look at some of the global data to assess the truths of MMT as it is now the (self-serving) dominant economic narrative of central governments and central banks in the major global “developed” economies.
Government debt as a percentage of GDP in the top 10 GDP sample has been growing at a brisk pace since after WW2, with Japan now perpetually above 200% of GDP. Germany, India, and the Republic of Korea holds below the World Bank 77% “bad” Debt-to-GDP barrier and China may also be within the 77%, unofficially.
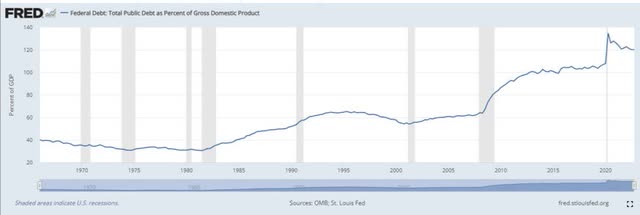
The St Louis FED do publish a Total Public Debt as a percentage of GDP for the USA which currently shows public debt in excess of 120% of GDP. We will later also take a look beyond “official” sources at the extent of total national debt.
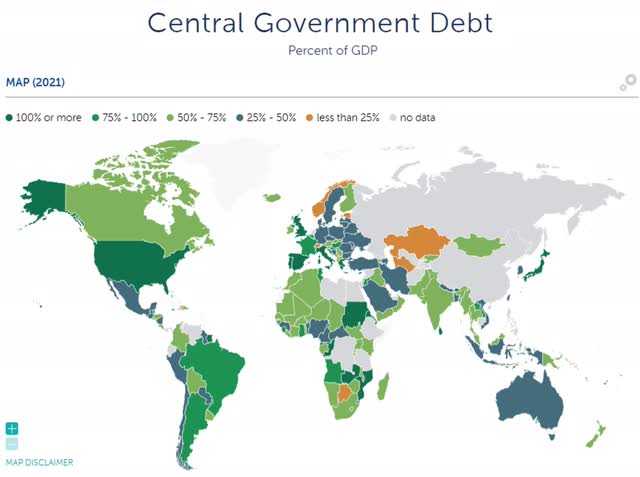
The global Central Government Debt to GDP% picture as represented in green by the IMF shows the concentration of Central Government Debt in the largest global economies with Japan, the USA, the UK and a number of EU countries leading the pack on Central Government Debt.
Central Government Debt or even Total Public Debt is still only half the “Debt” picture. What about the Private Debt of nations?
Private Debt, Loans and Debt Securities
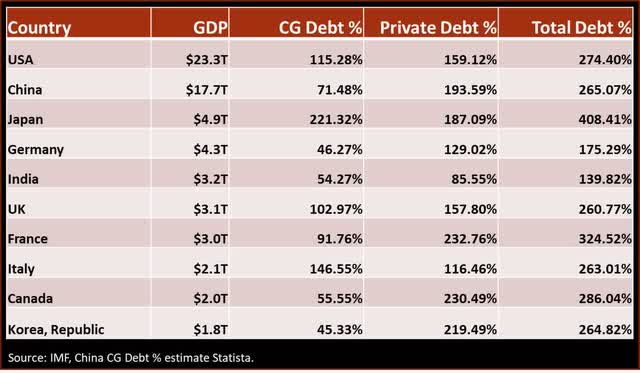
Total debt in a national economy would be the sum of public debt and private debt. The combined Debt-to-GDP ratio would then indicate the solvency health of that sovereign economy or economic block such as the EU.
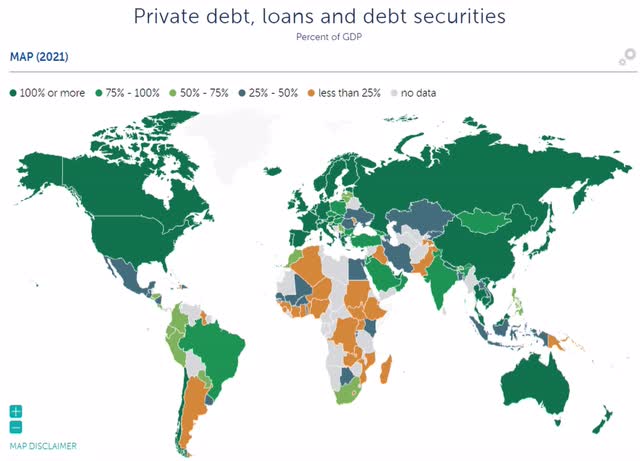
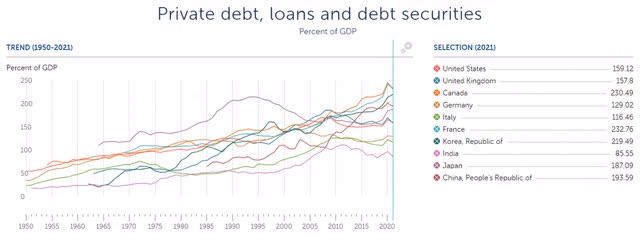
Lots are often said about Public Debt levels but the global chart on private debt and its concentration in the “developed” economies around the globe is much more alarming than Public Debt. The Private Debt-to-GDP ratio in the US, UK, EU, the UK, Australia, China and Russia all exceed the 100% of GDP ratio. It’s a sea of green (red?).
The IMF data on Private Debt is:
EU private debt is well represented and the growth in private debt is more pronounced than central government debt in most top economies. Japan stands out where government debt, since the 1992 to 1999 Japan asset bubble crises, muscled the private sector out of the debt market with a perpetual money printing Bank of Japan and saw private debt in decline since 1996.
Total Debt-to-GDP Ratios – 10 Largest global economies by GDP
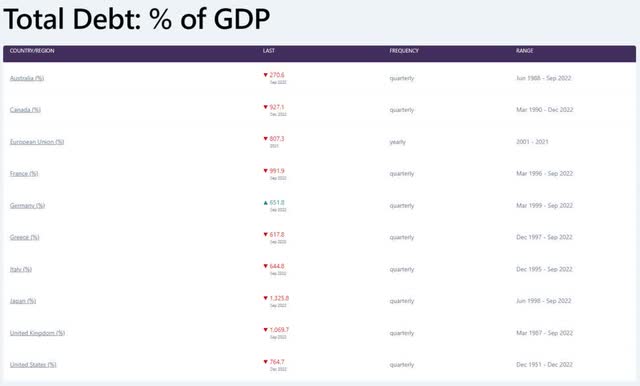
That is the “official” data. Data compiled by CEIC Data is much more comprehensive and paints a much darker picture of a world drowning in debt.
These levels of debt have grown to define our global economic system. CEIC Data provides Total Debt: % of GDP data for most countries globally, individually and over time (China once again is not represented). Is this an economic system or a debt system, when total debt reaches levels of over 1000% in top 10 economies and 765% in the largest global economy? Can we still say that we have an economy measured by a GDP when debt levels as a % of GDP are at 1000% and more? Which is the master, and which is the slave? The master must now be Debt and the economy a slave to that debt.
The debt overhang is not the much-touted myth of an overborrowed developing world. The developing world simply does not have the money creation powers of the developed world and that is the origin of this massive global debt overhang. The real humongous debt resides within the top developing countries.
This global economic system defined by an impossible-to-sustain debt overhang is becoming increasingly unstable. The “systemic” mini explosions have so far been wrapped in new money creation initiatives which, rather than solve any problems, just contain, and isolate any crisis hoping for, I’m beginning to think, an economic miracle which will keep the system from collapse. Let’s pause briefly at the four systemic warnings so far, only four lesser black swans circling. These are like the rumblings of a volcano, early warnings of increasing instability, and a warning that it may erupt into a full blow crisis at any moment.
- Japan, the third largest economy globally has reached an astounding total debt % to GDP of 1325.8%. Japan also have a stagnant economy, its GDP was $5.55T in 1995 and is at $4.9T as at the end of 2021, yet its debt keeps growing together with a declining and aging population problem. The World Economic Forum describes it thus: “Population decline is one of Japan’s most significant issues – it has been falling since 2008 and is estimated to dip below 50 million by 2100. Couple that with the country’s ageing population, the number of working-age people is expected to decline further to around half of the total population by 2060.” Japan used to be a net exporter, now it’s a net importer with increasing trade deficits. The stagnation or perhaps zombification of the Japanese economy with a growing debt burden is entering its final phase where ever increasing volumes of money printing must sustain an economy in decline. The Bank of Japan (“BOJ”) is at war with bond bears who are attacking its money printing policies. The BOJ is fighting a retreating battle while inflation has increased form negative rates to positive 4% and beyond and bond yields have had to increase. History is not on the side of the BOJ even though the trade against the BOJ is called the Widow-maker Trade (Japan’s ‘widow-maker’ trade has finally come good). The history of Japan with excessive public debt and economic decline, certainly supports the World Bank view that too much government debt has a negative effect on GDP growth.
- The UK, sixth largest global economy, with a total debt % to GDP of 1069.7% is not far behind Japan, but with its own uniquely government created debt problems in unfunded and underfunded pension schemes, which much like Japan’s economic issues have been around for a while. Systemic financial distress in the present growing economic crisis first emerged in the UK with its underfunded and government unfunded pension schemes’ exposure to rising yields on government debt, which in turn, caused bond losses for holders (Bank confirms pension funds almost collapsed amid market meltdown). The solution was for the Bank of England (“BOE”) to use a new round of money creation to wrap the pension crises in liquidity, but the problems remain, just placed in a liquidity stasis. The BOE also has a history of making war on the market and eventually losing. The most well-known loss is probably the tale of George Soros, How Did George Soros Break the Bank of England?
- The USA as the largest global economy nurses a 765% of GDP debt level and was the first country to experience a bank run in this developing global debt crisis. More important, and I will return to it in more detail further down, is the fact that this banking crisis has its origin in unrealized losses on government bonds based upon the repricing of assets in a higher interest rate environment. The repricing risk is a relatively small risk given debt levels, yet it has already decimated the capital held by banks in the USA (Monetary Tightening and U.S. Bank Fragility in 2023: Mark-to-Market Losses and Uninsured Depositor Runs?). The real monster risk for the banks and the system will not be the repricing of assets but the bad debts now building silently below the surface. It takes somewhat longer for the bad debts to emerge.
- The EU, as an economic block, had a GDP of $14.5T in 2021 placing the economic block 3rd globally just after the USA and China, but it also carries a debt to GDP percentage of 807% collectively. Switzerland, though not a direct EU member, is a member of the EU common market through bilateral treaties, and suffered a material banking crises with a forced merger between UBS and Credit Suisse, literally implemented over a week-end (UBS Agrees to Buy Credit Suisse for $3 Billion: What’s Next?). Next Germany had to put out fires on Deutsche Bank (Europe’s leaders battle banking crisis as market rout hangs over Brussels summit). Who puts out these fires? It’s the governments and the central banks, acting to protect the “system”. A sound system would not require damage control from the government and central banks.
Savings
Funding Debt through Savings
The traditional twin of Debt is Savings. Some persons save a surplus portion of their economic production, and those savings are then available to be deployed as debt to economic participants who have a shortfall. The essence of this economic principle is that Debt will always tend be equal to Savings.
Debt = Savings
The market price for debt, interest rates, will be established as the interest rate where Debt and Savings are in balance for any given timeframe.
This economic model of Savings and Debt in balance has generally been replaced with the advent of Central Banks. Central Banks as the money creating entity in any economy has the ability to now digitally, artificially, “create” money from thin air, money which has no link to any economic activity, and which is not the product of any saved economic surpluses. This new money from central banks competes with, and frankly easily outcompetes, Savings for distribution as debt, flooding supply and reducing interest rates at will. It is not a benign process, and the consequences will be discussed at length.
The immediate consequence is that money creation exponentially expands Debt and will, for as long as it exists, sustain dislocating Debt levels in a materially distorted economic framework. Exactly as we saw above in the Debt discussion.
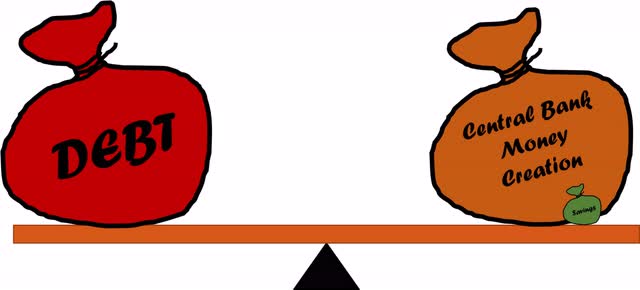
Debt = Savings + Central Bank Money Creation
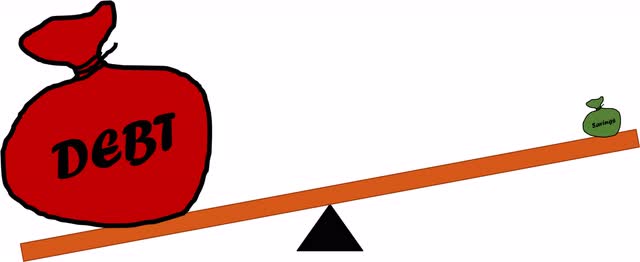
Debt levels against savings in a MMT economy look like this.
And these Debt levels are clearly unsustainable without the robust assistance of digitally created central bank money to balance the scales.
You may legitimately ask if the relationships are as dramatic as depicted?
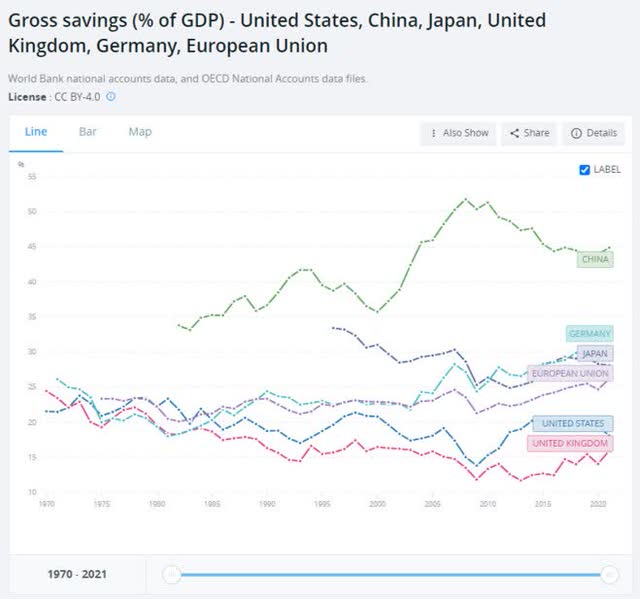
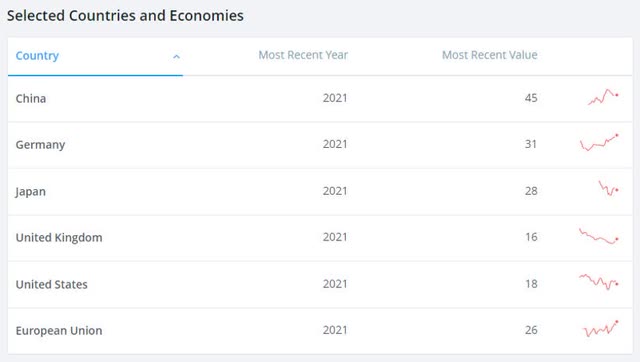
We know that Debt average at levels around 800% of GDP if we look at the USA, the EU and Japan. The World Bank publishes data for Gross Savings as a % of GDP for countries and for the EU collectively.
Data Table
World
World bank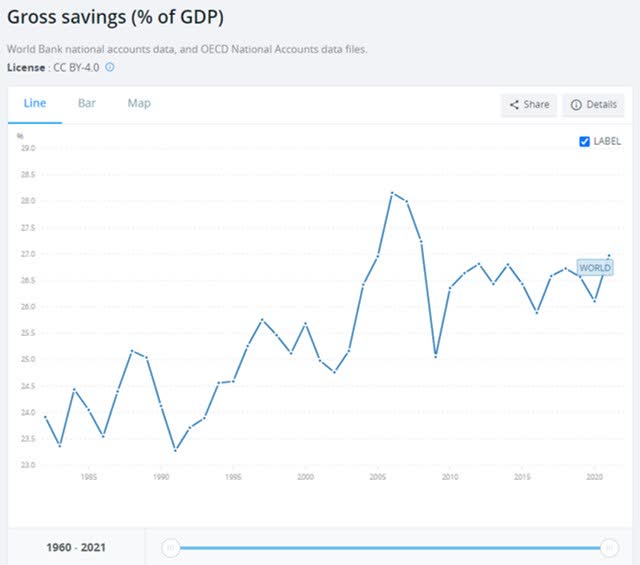
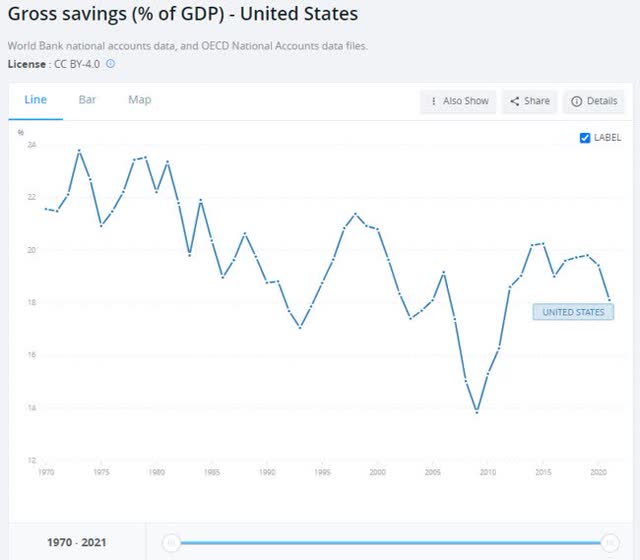
USA
It follows that we can easily establish to what extent countries are supplementing savings with central bank digitally created money.
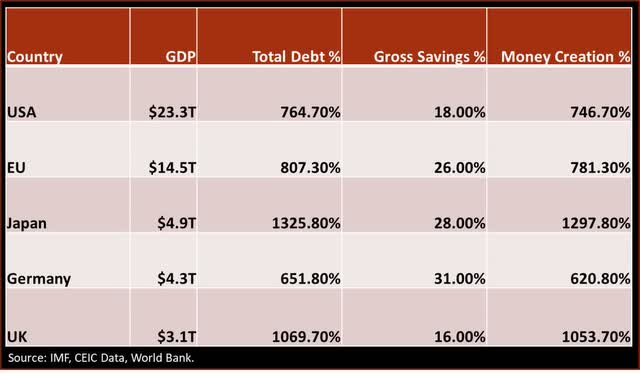
Total Debt, Gross Savings and Money Creation, all referenced as a % of GDP
It is clear from the above table that the tiny “Savings” in the money creation graphic is overstated rather than understated given how irrelevant it had become. Money creation has all but destroyed “Savings” and around 98% of debt is now financed through money creation in the USA and Japan, with the EU financing 97% of debt through money creation. Splitting hairs between 96%, 97% or 98% of debt financed through money creation has become irrelevant. This whole new global economic ecosystem is built upon central bank money creation facilitating a debt tsunami.
We can also see that new savings are not “built”, as is the narrative of MMT, in this debt driven economic system with unbridled money creation but the exact opposite has happened. Savings have been displaced almost in its entirety by money creation.
Central Banks love to mention that they have the necessary tools to manage any economic crises.
The Federal Reserve has a variety of policy tools that it uses in order to implement monetary policy.
The essence of each and every tool described is simply a variation of the money creation “tool”. Central banks have only one tool, money creation, where interest rate manipulation is a function of implementing money creation activities. This money creation tool of central banks is nevertheless a very powerful tool of brute force, in essence, its very nature is that of a hammer. The saying is that everything looks like a nail when the only tool one has is a hammer.
“The law of the instrument, law of the hammer,[1] Maslow’s hammer (or gavel), or golden hammer[a] is a cognitive bias that involves an over-reliance on a familiar tool. Abraham Maslow wrote in 1966, “If the only tool you have is a hammer, it is tempting to treat everything as if it were a nail.”
We can see from the above that the brute force of this central bank hammer has knocked savings right out of the debt markets. What other consequences are there to swinging this hammer on delicately balanced economic relationships?
The brute force of this tool makes it irresistible as the go-to solution for every economic problem and it combines brilliantly with the route of least resistance. Increase taxes and commit political suicide but prime the markets and economy with money creation and everybody loves it (until the black swans start circling).
The Hammer for Central Government Debt and Money Creation for Profit
Central banks will swear high and low that they are independent but in reality, are extensions of government pretending to be independent. Here is the proof.
- Control over any legal entity vests with whomever appoints its office bearers (boards of directors or boards of governors for example). This is obvious, whomever appoints those persons who would make all material decisions of that entity, controls that entity. “The seven members of the Board of Governors of the Federal Reserve System are nominated by the President and confirmed by the Senate.” The President and Senate of the USA controls the Board of Governors of the Federal Reserve System (the “FED” or USA central bank) and therefore obviously controls the FED.
- The activities or “mandate” of the FED is enacted in the Federal Reserve Act by the Congress of the USA Government. “The Federal Reserve Act of 1913 established the Federal Reserve System as the central bank of the United States to provide the nation with a safer, more flexible, and more stable monetary and financial system. The law sets out the purposes, structure, and functions of the System as well as outlines aspects of its operations and accountability. Congress has the power to amend the Federal Reserve Act, which it has done several times over the years.” The USA government instructs, and the FED must obey. No independence there.
- Any “profit” made by the FED is paid to Central Government other than a token dividend to “shareholders”. “The Federal Reserve Act requires the Reserve Banks to remit excess earnings to the U.S. Treasury after providing for operating costs, payments of dividends, and any amount necessary to maintain surplus. During a period when earnings are not sufficient to provide for those costs, a deferred asset is recorded. The deferred asset is the amount of net earnings the Reserve Banks will need to realize before their remittances to the U.S. Treasury resume.” This arrangement allows the US government to annually strip any profits from the FED, but should it make a loss then that loss is “carried” as a “deferred asset” until the loss is eliminated by new money creation activities.
The USA government controls the Board of Governors as well as the mandate of the USA central bank and as such it is impossible for it to claim “independence”. The most telling and important proof of ownership and control is answering the question, who gets the profit? The Fed “remit excess earnings to the US Treasury”. This is not a special arrangement applicable to only the USA, it is the general rule for central banks. Central Banks are “profit centers” for central government and governments generally profit handsomely from the money creation activities of the central banks. Nothing controversial about it, it simply is how this debt funded through money creation system has been built globally. I have discussed the principle of for profit money creation in detail in my previous article Inflation: Not Defeated But Waiting In Ambush.
Hammering redistribution of wealth and creating a cost-of-living crisis
Pity the economic participant who still believes in working hard, saving, and growing wealth the traditional way. It’s gone and has been replaced by access to cheap credit as the most efficient means to building capital, wealth, and a portfolio of assets.
The first consequence of unbridled money creation is to strip savers of their interest through the elimination of a market established interest rate which is replaced by an interest rate set by the central bank. That interest rate will be lowered as necessary to facilitate absorption of the newly created money, a process much appreciated by any deficit operating central governments. Interest due to savers are thus redistributed as interest subsidized debt to users of the credit. This is the well tested economic principle of lowering costs to clear new supply. Newly created money supply is placed on “Sale” to facilitate its absorption as new credit, everything must go. Zero interest rates are the ultimate bargain basement sale of credit as we saw above.
The more destructive effect is that of inflation. The inflation of money creation in modern economies is very carefully managed to spread it consistently over time, at usually no more than 2% per annum, to avoid sensitizing the economic participants to inflation. Economic participants must preferably ignore inflation, which they do, when it is trickled into the economy at 2% per annum.
The outcome, however, of inflation is ultimately the same whether it is trickled or whether it flares up beyond the 2%. Money creation dilutes the buying power of everybody in favor of those economic participants who gain the largest and earliest access to the newly created money supply.
The basic fact is that if one unit of money is the price of one item and another unit of money is added, then the price of the item must also double or else the creator of the new unit of money will lay claim to half of the value of an item, for free, while the previous holder of a unit of money will lose half its economic value.
Inflating the money supply through money creation across a national economy or even international economy as is the case with the US$, is easily achieved especially when it is trickled into the system, silently diluting buying power of incomes, buying power of savings, buying power of any money held.
Management of inflation is mostly directed into asset price inflation in these modern debt driven economic systems. Done to avoid the traditional inflation of all prices across an economy outcome and to prevent a cost-of-living crisis which emerges when too much dilution took place. It failed in 2008 and it is yet again failing in 2023.
The asset inflation inevitably migrates to shelter costs via a housing bubble. Newly created money accessed and deployed in the acquisition of fixed property drives shelter price inflation and eventually push prices beyond the affordability levels of most of the population. Here the Canadian property bubble is a good example, The Most Splendid Housing Bubbles in Canada: March Update on the Housing Bust.
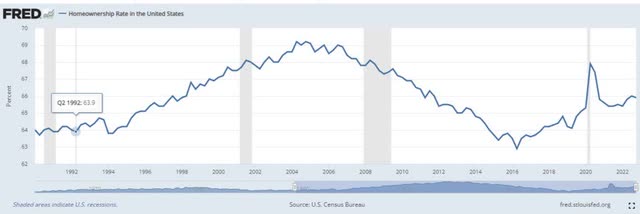
Cheap wholesale credit also encourages “corporate” ownership of shelter “for rental income”, exacerbating the lack of affordable access to homeownership. The build-up to the 2008 Global Economic Crises demonstrated how the creation of a property bubble and its collapse decimated homeownership.
Harvard University’s annual State of the Nation’s Housing report shows how shelter costs have inflated to levels much higher than even those prevailing during the 2006/7 housing bubble.
Harvard University: State of the Nation Housing Report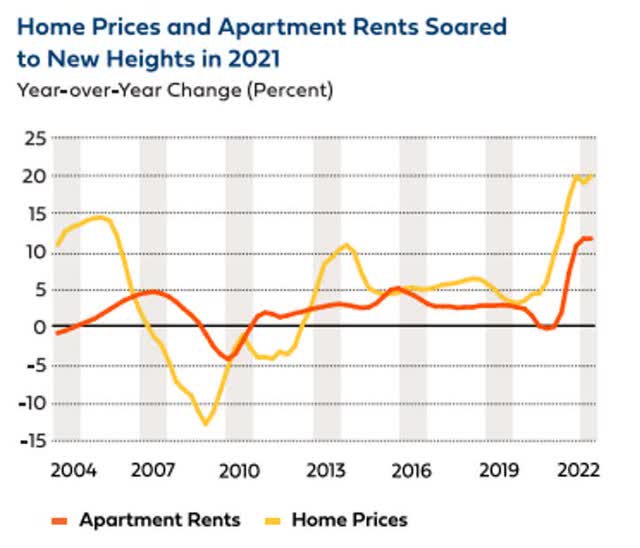
The dilution of purchasing power away from salary and wage earners towards the recipients of newly created central bank credit is the most powerful financial force for redistribution of wealth away from the poor to be concentrated increasingly in the richest 1%.
Cheap wholesale credit is distributed on the basis of collateral offered and inherently favors the asset rich over the asset poor. Expensive consumption credit further subsidizes the wholesale distribution of credit. The newly created money supply is mostly distributed to government, or via wholesale credit channels.
The end result of slowly chipping purchasing power away from the majority of the economically active population or an unexpected flare-up of inflation is the same. It will eventually result in a cost-of-living crisis. Shelter, energy, and food prices are inflated beyond affordability. The fact that the US inflation rate has dropped back to around 6% does not make shelter suddenly affordable nor does it bring any relief to those already caught in a cost-of-living crisis. Shelter is unaffordable, remains so, and worsens even if prices are now increasing at a slower price than before. It can only improve if prices deflate.
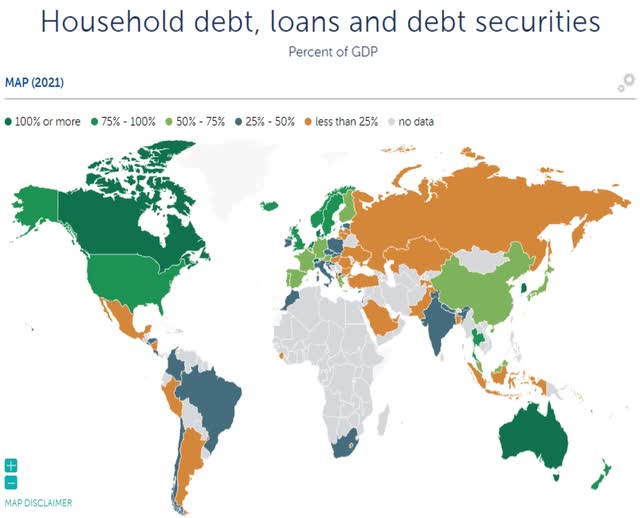
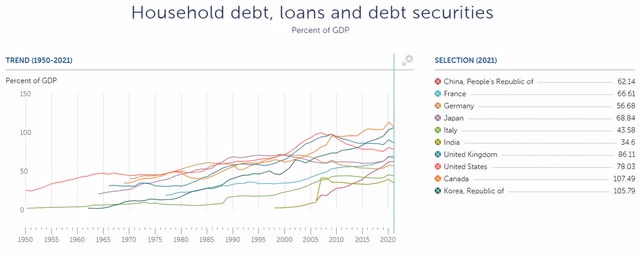
Do households get to share in the abundance of new central bank money creation? Turning back to the IMF data, we see that household debt as a % of GDP is significantly less than that of central government and is only a lesser portion of the private sector debt as a % of GDP. The economy ultimately exists to serve the needs of households, but households have been relegated to last in line in this central bank debt driven macroeconomic system.
The dominant debt of households is mortgage debt, and the housing bubbles of Canada, South Korea, and Australia shine bright in dark green (should really have been in neon red). The relegation of households is also equally evident in the data on the global top 10 economies, mostly as the growth of debt due to the asset inflation in the housing market. Still, the ability of households to absorb asset inflation at higher interest rates is very limited and would tend to pop the housing bubble.
The housing bubble has already started to collapse in South Korea where household debt on mortgages match that of Canada.
“Apartment prices in South Korea’s capital Seoul fell by more than 20 percent last year, the largest drop ever. The price decline was more than double the 10 percent drop in 2008 during the global financial crisis. Economists worry a continued decline could lead to a serious economic crisis and warn the issue is a global concern.”
South Korea Housing Crisis: Experts warn of overall economic crisis as property prices continue to fall – 15-Mar-2023
The pressure from inflation and the cost-of-living affordability combines with higher mortgage interest rates to threaten another global housing recession. A housing recession usually results in lower prices for residential properties and as we have seen in 2008, soon pushes households into negative equity on their houses. A housing recession, lower house prices and negative equity then migrate to banks as bad debts and loan losses. Households become even more asset poor, renting shelter, and accelerating the transfer of all economic assets to those with access to cheap central bank debt. Returning households to serfdom is a recipe for economic disaster yet this debt driven economic model is structured to achieve a new form of economic serfdom for households as asset poor perpetual tenants. Households are and will be positioned to bear the brunt of inflation and higher interest rate consequences yet never share in the cheap wholesale money creation scheme of the central banks.
The developing cost-of-living crisis in an economic debt driven system heavily tilted against serving the interests of households is the second most dangerous circling black swan in the current macroeconomic setup.
Banking Systemic Risks and the Hammer, Capital Coefficients, and Inflated Assets Collateral
It is inevitable that we must turn our focus to Banking Systemic Risks in a macroeconomic system built upon layers of debt. A system built upon debt and cheap money creation credit supply from central banks will also have pertinent rules for the allocation of that credit.
Banks traditionally held cash reserves to ensure liquidity should they be required to pay back depositors, but cash reserving was replaced by capital requirements during the 1980’s with the Basel Accords. The latest version is Basel III.
How is that different and why does it matter? It matters as capital requirements are the mechanisms and rules of the system for allocating debt. Banks must comply with capital requirements and must at all times have adequate capital in tiers 1, 2 and 3. The rationale of capital adequacy is what allows regulators to claim that banks are sound even when they are no longer sound at all, as will be discussed.
The basic principle of capital requirements is that a bank must reserve a certain percentage of its qualifying capital against any credit advances that it makes. The principles are not particularly complicated but the definitions of the assets and the value at risk can get very technical. I will keep it simplified. Credit supplied by banks are the bank’s assets and these assets are then subdivided into different risk categories. Each risk category is assigned a risk rating which will dictate its capital requirement.
It’s easier to simply use the allocations as per Basel I which have been adjusted, refined, and expanded in Basel III though the fundamental principles remain the same. Basel I sets an 8% capital requirement for assets held by a bank, but assets are risk classified as 100%, 50%, 20%, 10% or 0%. This means that a bank must have sufficient capital to allocate or reserve 8% of the notional value of the asset for an asset classified as 100%. Capital reserved reduces the ability of a bank to grow its assets indefinitely unless they buy 0% risk rated assets.
The numbers will look like this. Bank Capital available for reserving $1000. A new $100 loan in the 100% risk category requires an $8 capital reserving. The bank will then allocate that $8 against capital (it’s just a calculation, no money is moved around) and have $992 available for allocation to grow its assets.
A 50% risk allocation will require only 4% capital allocation (8%x50%), a 20% risk allocation will only require 1.6% capital allocation, and anything classified as 0% will require 0 capital reserving. Derivatives often carry very low capital allocations and banks can and do carry massive volumes of derivative risk coupled with counterparty risk chains on each other.
The capital allocation mechanism will limit the ability of the banker to expand its balance sheet. A bank with $1000 capital can grow its assets to $12,500 in the 100% risk category after which the full $1000 has been risk allocated. The banks can have twice that number in assets if that banker were to only acquire assets in the 50% risk category. The ultimate asset class is the 0% risk rated assets of which the banker can theoretically acquire an infinite amount without ever running out of capital to allocate.
Risk and return on assets are usually correlated so returns on assets in the 100% risk weighted category would generally have much larger interest margins than an asset in the 0% risk weighted category. Credit card debt would generally be 100% risk weighted and would be regarded as high margin, high risk assets for a bank. Government debt is generally classified as 0% risk weighted and would also carry lower margins. Mortgage debt would normally carry a risk weighting of 50% while general consumer debt will almost always carry a 100% risk weighting.
It must be very obvious how this system skews the allocation of newly created money supply first to government and then in a waterfall to trickle down last to households other than for mortgage loans. It also outright prefers governments, always having them at the front of the queue when new money creation is channeled into the economy.
It is this very arrangement which caught the regional banks swimming without pants when interest rates started to increase. Having had no restraint on their allocation of depositor’s money to government debt, encouraged them to overload their balance sheets with government debt just to get caught out on the repricing of that debt. Banking risk 101 but the system had been built to encourage exactly this type of risk taking. Being told that inflation would be “transitory” further encouraged them to simply sit on that risk.
The next asset section encouraged by this risk weighting system is fixed property, whether residential or commercial, it generally carries a lower risk weighting usually in the 50% risk category. Interest yields on mortgages are usually attractive. Thus banks will also load up on these loans and facilitate the development of property bubbles. The system is designed for this result. It carries repricing risk in the first round and bad debts from affordability and negative equity in the second round.
Negative equity develops very fast in commercial real estate with the advent of higher interest rates and during a recession. Commercial real estate prices are very sensitive to changes in interest rates and decline precipitously when higher interest rates combine with a drop in rental receipts. The real estate asset inflations generated during the declining interest rate phase and generous money creation supply, disappears when the property bubbles pop.
Banking systemic risk can be expected to migrate through several stages. The first stage is when there is a banking shock, like the sub-prime assets of 2008 or the excessive bond repricing risks and unrealized losses of 2023. It’s just a precursor for the next round. Banks are in communication with each other by the minute and know each other’s businesses and business styles very well. This activity is called the interbank market and its normal functioning is essential to the survival of the banking “system”.
That first shock to the system shatters a fragile trust which prevails in the interbank market. Banks become very paranoid about other banks for they know that a single bad counterparty risk can also drag them down. Any suspicion of risk spills over into the Credit-Default Swaps market where the cost of insuring against credit-default will spike upwards exactly as what had happened to Deutsche Bank recently.
“Deutsche Bank shares have since regained much of the ground they lost last Friday. The prices on Deutsche Bank credit-default swaps, however, have come down only somewhat and remain higher than before last week’s selloff.” Deutsche Bank Selloff Focuses Attention on Credit-Default Swap Market -WSJ, 29 March 2023.
This is the other banks, with much better insight into the affairs of Deutsche Bank, saying with their money, we do not trust Deutsche Bank, and it is better to trust the other bankers in this matter than to listen to politicians and regulators with a system protection bias. It follow that we have already had the shock and have moved on to the paranoid interbank market stage which is still early in its development but it already alludes to the next phase.
The rise of default risk is the next phase and it will manifest in further liquidity squeezes at banks identified as at risk by the paranoid interbank market. Aggressive government and central banker interventions can be expected to ward against this phase and to attempt to protect the system should this phase gain momentum.
The final stage is when the bad debts emerge, bad debts which are probably already simmering in the background. Its very disconcerting that the very first stage of unrealized losses on government debt had already mostly consumed the capital of the banking system which now have to face the next stages with wafer thin capital protection or even without sufficient capital. Unrealized losses are very real even though they are not passed through the income statement in an accounting entry. The loss will not go away unless the assets are repriced favorably in the short term. A special liquidity arrangement to help the banks carry the losses simply allows them to amortize the loss over time. It still wipes out the capital, nonetheless.
Systemic banking risk has only started, and it is considered the third most dangerous black swan circling.
Hammer the Bears and other Market Interventions
The money creation excesses of the Bank of Japan saw the collapse of the Japanese Stock Exchange as well as the collapse of its property market in the early 1990’s. The Japanese property bubble was inflated to such an extent that households had to take out multi-generational mortgage loans to afford shelter.
“A recent innovation in the Japanese real estate industry to promote home ownership is the creation of a 100-year mortgage term. The home, encumbered by the mortgage, becomes an ancestral property and is passed on from grandparent to grandchild in a multigenerational fashion.”
The 100-year Japanese residential mortgage: An examination, Journal of International Accounting, Auditing and Taxation, Volume 4, Issue 1, 1995, Pages 13-26.
Japan never abandoned its money creation spiral and just kept it up right through it economic collapse and 30 years of economic stagnation. The BOJ went to war against bond market bears whenever they attempted to trade against the interest rate distortions engineered by the BOJ, sinking ever deeper into economic stagnation. The tenacity of the BOJ and its willingness to accept the economic stagnation meant that bond traders who went up against the BOJ usually lost in what become known as the widow-maker trade. It is probably the most astounding demonstration of the economic destructive power of unrestrained money creation. 30 years of stagnation and a slow economic decline was the choice rather than to allow a system reset and to rebalance the economy in a much shorter and certainly a dramatically painful realignment. Now Japan has a sickly old economy rather than a vibrant healthy economy.
It is, however, important to recognize the power of a central bank to materially distort an economic system and then maintain that distortion even for 30 years, if need be. These are not forces to be trifled with by the average investor or market participant.
The stock exchanges should have been subdued in “risk-off” when the first banking shocks occurred in March 2023, but the liquidity injections by the central banks, acting in concert as they do in these circumstances, have had the opposite effect and have seen the stock indexes up 10% or more in a frenzy of “risk-on” buying.
“The Bank of Canada, the Bank of England, the Bank of Japan, the European Central Bank, the Federal Reserve, and the Swiss National Bank are today announcing a coordinated action to enhance the provision of liquidity via the standing U.S. dollar liquidity swap line arrangements.”
Board of Governors of the Federal Reserve System, Press Release, March 19, 2023, Coordinated central bank action to enhance the provision of U.S. dollar liquidity.
Central Banks are serial market interventionists who will use the money creation hammer to war upon any market participants who may oppose their desired market outcomes, whom they will usually label as “speculators”. These interventions distort the markets and destroy the market signals that investors rely upon to make rational risk decisions. The much desired price discovery function of the markets is also eliminated and the decisions of the central banks and their objectives become the driving force for market pricing. Everybody follows the speeches of the central bankers looking for clues to the next move in the markets. Economic fundamentals, discounted cashflow models, charting, technical analysis, whatever, none of it matters when central bank liquidity is unleashed upon the markets. They will never again be blamed for a market crash….
There are market participants with deep enough pockets to go toe-to-toe with central banks and attack the market distortions, which can be highly profitable as we have seen with the successful trade by George Soros against the Bank of England. It is, however, rare to see the central banks lose and taking the other side on a widow-maker trade against central banks should be avoided by most investors.
An African proverb says: “Ndovu wawili wakisongana, ziumiazo ni nyika” – When elephants fight, the grass gets hurt. It is good advice for investors in this market were black swans circle like vultures.
Conclusion
The take-aways of this discussion are:
- Debt, fueled by central bank money creation, has become the overwhelming macroeconomic force and every investment decision must be evaluated with due recognition of this dominant variable.
- This debt saturated economic system is unstable but will be protected unreservedly by even more central bank money creation actions, actively supported by governments. Every crisis will be drowned in liquidity and held in that liquidity fueled stasis for as long as necessary.
- The rational approach for most investors are to exploit the predictable opportunities presented by central banks when they act to achieve their goals rather than to attempt to catch the unpredictable events resulting from system instabilities.
- Understanding the mechanisms of the debt driven macroeconomic system, the mechanisms used for the allocation of central bank money creation and the mechanisms to inject liquidity into the markets are essential for successful investing in this system.
- This is a high-risk system and, as was demonstrated by Japan, can crash-and-burn so, being nimble is important. The sitting duck investing style may not be the best style in an unstable system. Run when it’s needed but also jump back in when the liquidity spigots are deployed.
- Pick and switch sides as required, trade with the central banks when they are in charge and follow the bears when the system fails. Respect the power of the central banks while being fully aware that they are not omnipotent and that this system may fail despite the power which they wield.
- Most important, be defensive rather than aggressive and walk away with a profit rather than a loss.

