Housing Bubble Woes: Home Sales Plunge, Prices Drop 7% in 3 Months, Price Reductions Surge. Mortgage Rates Spike
Investors are also pulling back.
By Wolf Richter for WOLF STREET.
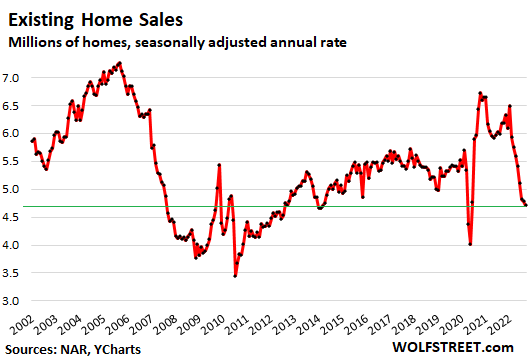
Sales of all types of previously owned homes – houses, condos, and co-ops – fell for the eighth month in a row, by 1.5% in September from August, to a seasonally adjusted annual rate of sales of 4.71 million homes, according to the National Association of Realtors in its report. Compared to the peak in October 2020, sales were down 30%.
Beyond the two lockdown months of April and May 2020, this was the lowest rate of sales since March 2014, and since the summer of 2012, indicating to what extent the housing market is frozen. Potential buyers refused to even look at prices that sellers want. Sellers refused to cut their aspirational prices to where the buyers might be – though there is a lot more price cutting going now than a year ago. And other potential sellers waited for a Fed pivot that would lead to lower mortgage rates and higher prices before they put their homes on the market – though the opposite is now happening (historic data via YCharts):
These are sales across the US that closed in September, based on deals that were made earlier. So they just about entirely predated Hurricane Ian which made landfall in Florida on September 28.
Compared to a year ago, the seasonally adjusted annual rate of sales was down 23.8%, the fourteenth month in a row of year-over-year declines (historic data via YCharts):
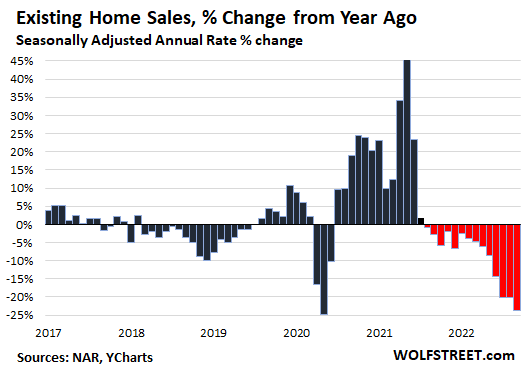
Sales of single-family houses dropped by 0.9% in September from August, and by 23% year-over-year, to a seasonally adjusted annual rate of 4.22 million houses.
Sales of condos and co-ops fell 5.8% in September from August, to 490,000 seasonally adjusted annual rate, down 30% year-over-year.
Sales by region: On a year-over-year basis (yoy), sales plunged in all regions. On a month-over-month (mom) basis, only the West showed no declines in sales from the desperately low levels in August:
- Northeast: -1.6% mom; -18.7% yoy.
- Midwest: -1.7% mom; -19.7% yoy.
- South: -1.9% mom; -23.8% yoy.
- West: 0% mom; -31.3% yoy.
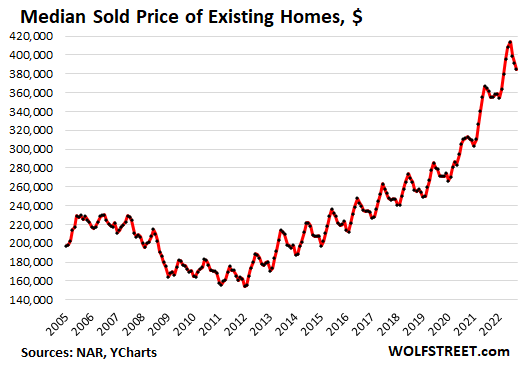
The median price of all types of homes whose sales closed in September dropped for the third month in a row, and is now down 7% from the peak in June.
In terms of seasonality, the 7% decline was the largest for this period since the end of Housing Bust 1, and more than double the 3.2% decline during this period in 2021. The average decline during this period over the prior 10 years was 4.2%. In 2020, prices jumped during this period. In 2019, prices fell 4.9% during that period. And in 2018, prices fell 6.2% during this period, but the housing market was weakening as mortgage rates were heading to 5% amid QT, rate hikes, and swooning stocks.
This monthly decline in prices whittled down the year-over-year price increase to 8.4%, down from the 20% to 25% increases at peak frenzy last year (historic data via YCharts):
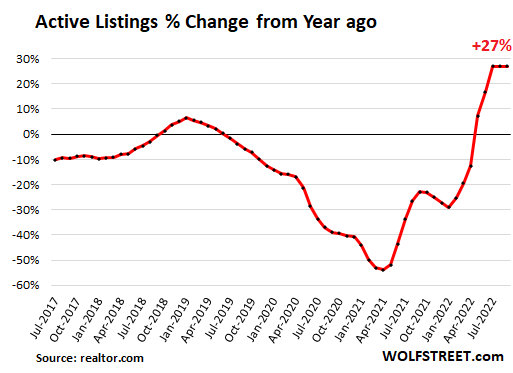
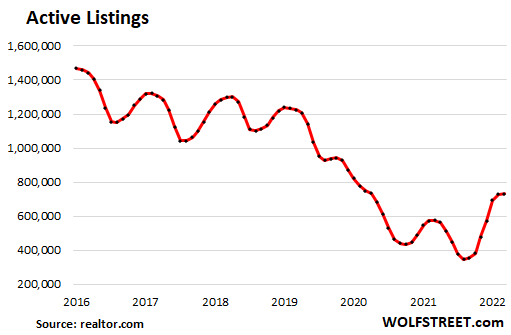
Active listings – meaning, total inventory for sale minus the properties with pending sales – rose to 732,000 homes in September, the highest since October 2020, up by 27% year-over-year for the third month in a row, according to data from realtor.com.

Compared to pre-pandemic years, active listings remain low, in a sign that the housing market is sort of frozen, with sellers not interested in selling at prices where the buyers might be; and buyers not interested in buying at prices where the sellers are, and so there is this standoff that shows up in the plunge in sales.
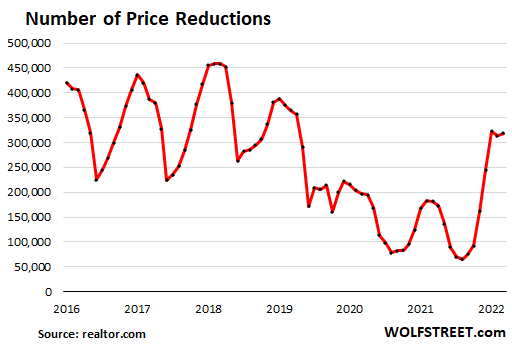
Price reductions have jumped from historic lows, a sign that some sellers are backing off from their aspirational prices and are cutting prices to where the buyers might be.
The number of price reductions jumped by 75% year-over-year from the mania-lows of the pandemic and is back in the range where it was before the pandemic:
Investors or second home buyers purchased 15% of the homes in September, down from a share of 16% in August, and down from the 17%-22% range in the spring and winter, according to NAR data.
“All-cash” buyers, which include many investors and second home buyers, declined to a share of 22% of total sales, down from a share of 24% in August, and down from a share of 25% to 26% earlier this year.
This declining share of sales to investors, amid plunging overall sales, shows that investors are losing interest in this market at these prices.
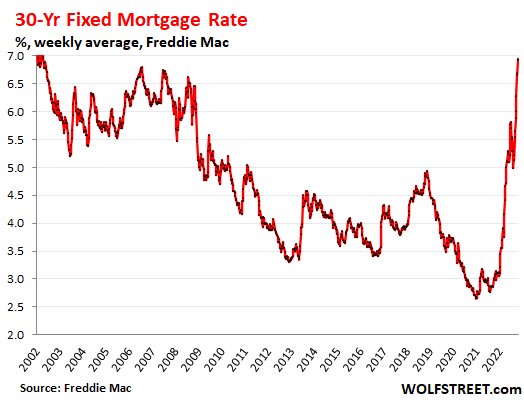
Holy-moly mortgage rates. After the fantasy-Fed-pivot-drop from 6% in mid-June to 5% by mid-August, mortgage rates are now at around 7%.
The daily measure of the average 30-year-fixed mortgage rate jumped to 7.37% today, according to Mortgage News Daily.
Freddie Mac’s weekly measure of the average 30-year fixed mortgage rate, released today, based on mortgage rates early this week, rose to 6.94%, over twice the rate a year ago.
But a 7% mortgage rate, as huge as it may be when applied to today’s crazy home prices, is still low, given that CPI inflation is over 8%. But it’s catching up:
Enjoy reading WOLF STREET and want to support it? Using ad blockers – I totally get why – but want to support the site? You can donate. I appreciate it immensely. Click on the beer and iced-tea mug to find out how:
Would you like to be notified via email when WOLF STREET publishes a new article? Sign up here.
![]()


