

Data Through Q4 2023
Introduction
The CoreLogic Homeowner Equity Insights report, is published quarterly with coverage at the national, state and metro level and includes negative equity share and average equity gains. The report features an interactive view of the data using digital maps to examine CoreLogic homeowner equity analysis through the fourth quarter of 2023.
Negative equity, often referred to as being “underwater” or “upside down,” applies to borrowers who owe more on their mortgages than their homes are worth. Negative equity can occur because of a decline in home value, an increase in mortgage debt or both.
This data only includes properties with a mortgage. Non-mortgaged properties (that are owned outright) are not included.
Homeowner Equity Q4 2023
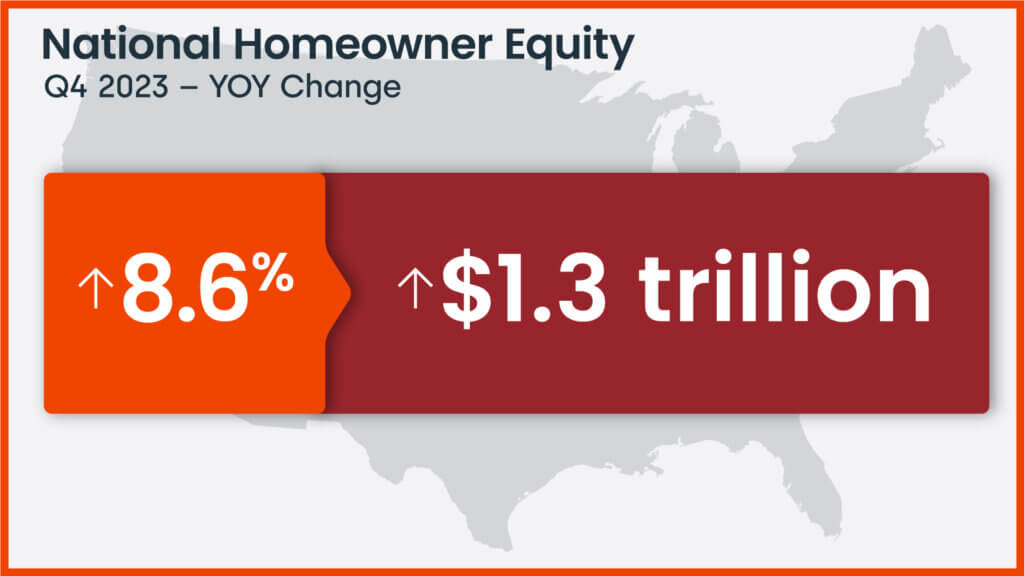
CoreLogic analysis shows U.S. homeowners with mortgages (roughly 62% of all properties*) have seen their equity increase by a total of $1.3 trillion since the fourth quarter of 2022, a gain of 8.6% year over year.
*Homeownership mortgage source: 2016 American Community Survey.
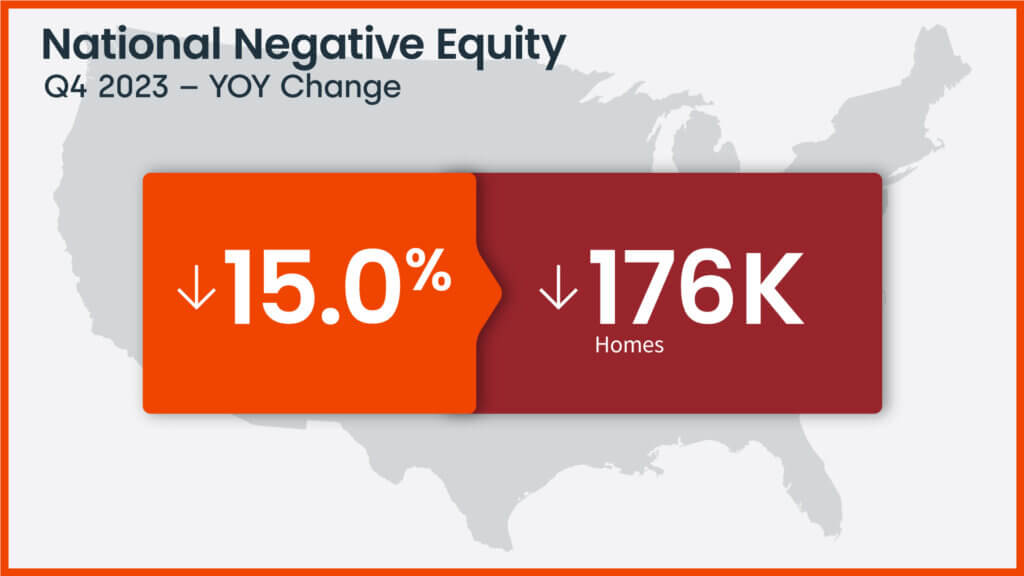
In the fourth quarter of 2023, the total number of mortgaged residential properties with negative equity decreased by 1.1% from the third quarter of 2023, representing 1 million homes, or 1.8% of all mortgaged properties. On a year-over-year basis, negative equity declined by 15% to 1.2 million homes, or 2.1% of all mortgaged properties, from the fourth quarter of 2022.
Because home equity is affected by home price changes, borrowers with equity positions near (+/- 5%) the negative equity cutoff are most likely to move out of or into negative equity as prices change, respectively. Looking at the fourth quarter of 2023 book of mortgages, if home prices increase by 5%, 114,000 homes would regain equity; if home prices decline by 5% 162,000 would fall underwater. The CoreLogic HPI Forecast TM projects that home prices will increase by 2.8% from December 2023 to December 2024.
Northeastern States Lead Annual Home Equity Gains in Q4 2023
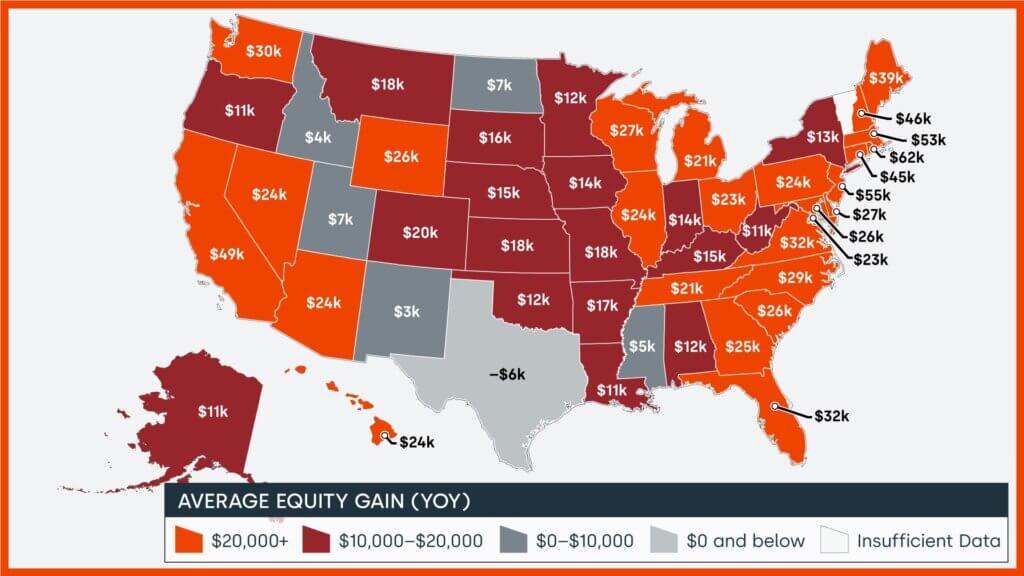
Home equity gains continued in the fourth quarter, providing owners with a solid financial cushion, particularly for baby boomers who have been in their homes for a while and thus accumulated substantial equity. Three Northeastern states posted the country’s highest annual equity gains in the fourth quarter: Rhode Island ($62,000), New Jersey ($55,000) and Massachusetts ($53,000). The equity growth in those states is thanks in part to the recent healthy home price increases in that area of the country. According to CoreLogic’s latest Home Price Insights report, Rhode Island and New Jersey led the nation for year-over-year appreciation in January, a respective 13.2% and 11.6%.
National Aggregate Value of Negative Equity: Q4 2023
The national aggregate value of negative equity was approximately $323 billion at the end of the fourth quarter of 2023. This is up quarter over quarter by approximately $9 billion, or 3%, from $314 billion in the third quarter of 2023 and down year over year by approximately $12.4 billion, or 4%, from $336 billion in the fourth quarter of 2022.
Negative equity peaked at 26% of mortgaged residential properties in the fourth quarter of 2009, based on the CoreLogic equity data analysis which began in the third quarter of 2009.
“Rising home prices continue to fuel growing home equity, which, at $298,000 per average borrower remained near historic highs at the end of 2023. By extension, at 43%, the average loan-to-value ratio of U.S. borrowers has also remained in line with record lows, which suggests that the typical homeowner has notable home equity reserves that can be tapped if needed. More importantly, home price growth over the last year has helped lift the equity of homeowners who were underwater because of 2022 price declines – meaning that their mortgage amount was higher than the value of their properties. Now, slightly more than 1 million borrowers are underwater, the lowest number recorded in CoreLogic historic data and significantly below the 12 million seen coming out of the Great Recession.”
-Dr. Selma Hepp
Chief Economist for CoreLogic
National Homeowner Equity
In the fourrth quarter of 2023, the average U.S. homeowner gained approximately $24,000 in equity during the past year.
Rhode Island, New Jersey and Massachusetts posted the largest average national equity gains, all at $50,000 or more. Only Texas posted an annual equity loss.
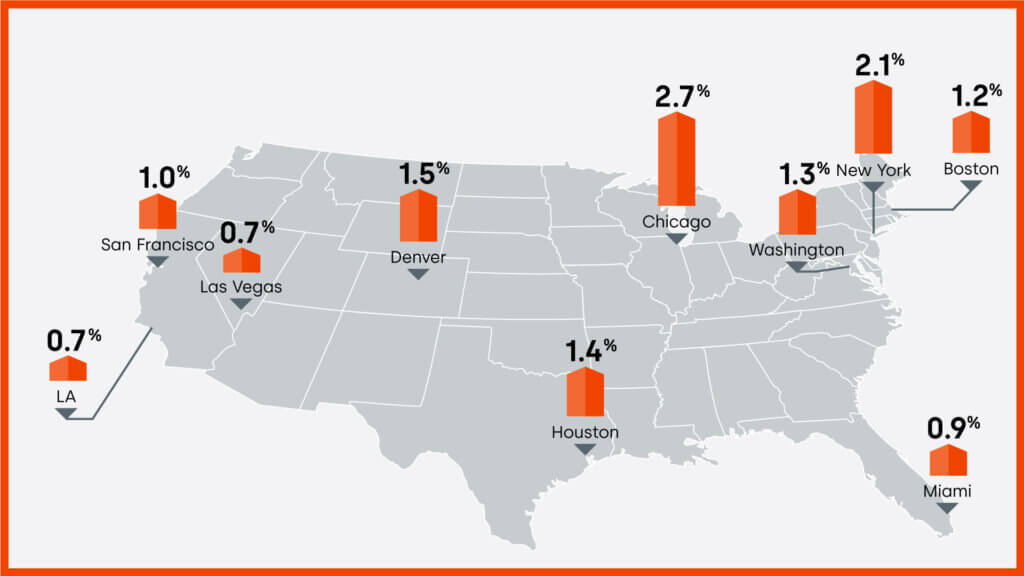
10 Select Metros Change
CoreLogic provides homeowner equity data at the metropolitan level, in this graphic 10 of the largest cities, by housing stock are depicted.
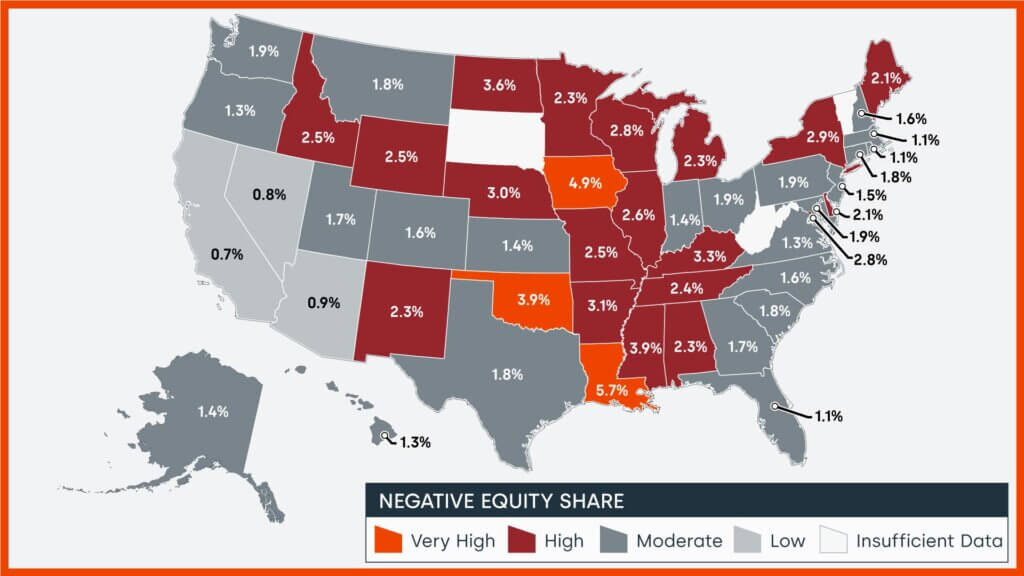
Negative equity has seen a recent decrease across the country. Las Vegas and Los Angeles are the least challenged, both with negative equity shares of all mortgages at 0.7%.
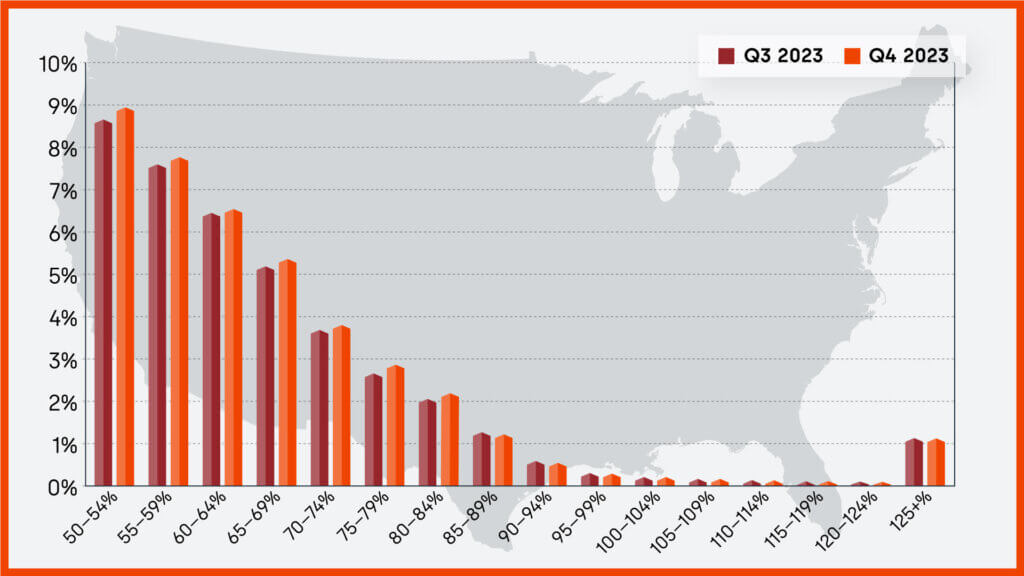
Loan-to-Value Ratio (LTV)
This chart shows national homeowner equity distribution across multiple LTV segments.
Summary
CoreLogic began reporting homeowner equity data in the first quarter of 2010; at that time, the equity picture for homeowners was rather bleak in the United States. Since then, many homes have regained equity and the outstanding balance on the majority of mortgages in this country are now equal to or in a positive position when compared to their loan balance.
CoreLogic will continue to report on homeowner equity as it continues to adjust in communities and states across the country. To learn more about homeowner equity, visit the CoreLogic Intelligence home page.
Methodology
The amount of equity for each property is determined by comparing the estimated current value of the property against the mortgage debt outstanding (MDO). If the MDO is greater than the estimated value, then the property is determined to be in a negative equity position. If the estimated value is greater than the MDO, then the property is determined to be in a positive equity position. The data is first generated at the property level and aggregated to higher levels of geography. CoreLogic uses public record data as the source of the MDO, which includes more than 50 million first- and second-mortgage liens, and is adjusted for amortization and home equity utilization in order to capture the true level of MDO for each property. Only data for mortgaged residential properties that have a current estimated value are included. There are several states or jurisdictions where the public record, current value or mortgage data coverage is thin and have been excluded from the analysis. These instances account for fewer than 5% of the total U.S. population. The percentage of homeowners with a mortgage is from the 2019 American Community Survey. Data for the previous quarter was revised. Revisions with public records data are standard, and to ensure accuracy, CoreLogic incorporates the newly released public data to provide updated results.
CoreLogic HPI Forecasts™ are based on a two-stage, error-correction econometric model that combines the equilibrium home price—as a function of real disposable income per capita—with short-run fluctuations caused by market momentum, mean-reversion, and exogenous economic shocks like changes in the unemployment rate. With a 30-year forecast horizon, CoreLogic HPI Forecasts project CoreLogic HPI levels for two tiers — “Single-Family Combined” (both attached and detached) and “Single-Family Combined Excluding Distressed Sales.” As a companion to the CoreLogic HPI Forecasts, Stress-Testing Scenarios align with Comprehensive Capital Analysis and Review (CCAR) national scenarios to project five years of home prices under baseline, adverse and severely adverse scenarios at state, metropolitan areas and ZIP Code levels. The forecast accuracy represents a 95% statistical confidence interval with a +/- 2% margin of error for the index.
Source: CoreLogic
The data provided is for use only by the primary recipient or the primary recipient’s publication or broadcast. This data may not be re-sold, republished or licensed to any other source, including publications and sources owned by the primary recipient’s parent company without prior written permission from CoreLogic. Any CoreLogic data used for publication or broadcast, in whole or in part, must be sourced as coming from CoreLogic, a data and analytics company. For use with broadcast or web content, the citation must directly accompany first reference of the data. If the data is illustrated with maps, charts, graphs or other visual elements, the CoreLogic logo must be included on screen or website. For questions, analysis or interpretation of the data, contact Robin Wachner at [email protected]. For sales inquiries, please visit https://www.corelogic.com/support/sales-contact/. Data provided may not be modified without the prior written permission of CoreLogic. Do not use the data in any unlawful manner. This data is compiled from public records, contributory databases and proprietary analytics, and its accuracy is dependent upon these sources.
About CoreLogic
CoreLogic is a leading provider of property insights and innovative solutions, working to transform the property industry by putting people first. Using its network, scale, connectivity and technology, CoreLogic delivers faster, smarter, more human-centered experiences that build better relationships, strengthen businesses and ultimately create a more resilient society. For more information, please visit www.corelogic.com.
CORELOGIC and the CoreLogic logo are trademarks of CoreLogic, Inc. and/or its subsidiaries. All other trademarks are the property of their respective owners.


