I have warned about this for some time. A European (and Chinese) recession does not impact the US economy much directly via trade but it does have an impact on the stock market. 40% of S&P500 revenues are offshore and 60% of the Nasdaq.
TS Lombard has more.
Recent data out of Europe have been causing a degree of concern among TS Lombard clients, with some emailing to ask “how worried” they should be about the latest trends. The popular PMI series have looked particularly troublesome because, after signs of improvement earlier in the year, they have now sunk to levels usually associated with outright recession. Even more worrying, this latest wave of destruction has not been confined to the manufacturing sector.
Now, services activity is deteriorating, too. Manufacturing weakness was easy to explain away. As we have been saying for two years, there was always going to be a bullwhip recession in global manufacturing and world trade after the pandemic: consumption patterns would shift, revealing an overhang of inventories.
But the deterioration in services activity suggests something deeper might be going wrong in the economy – just at the point where everyone had bought into the ”higher-for-longer” rates narrative. It could even be a sign that monetary policy has gone too far.
Advertisement

What should we make of these trends? It is important to remember that PMI data are far more reliable for Europe than for the US (at least when it comes to tracking the strength of the economy in real time). That is why European economists are so obsessed with them, whereas the same set of indicators tends to produce a collective shrug from market pundits in the US.
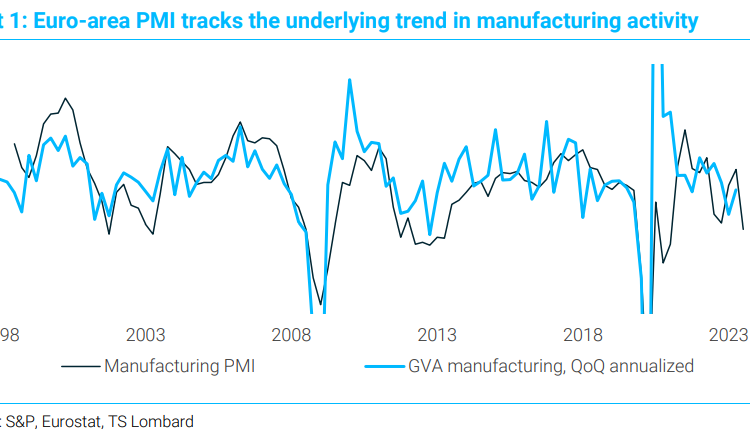
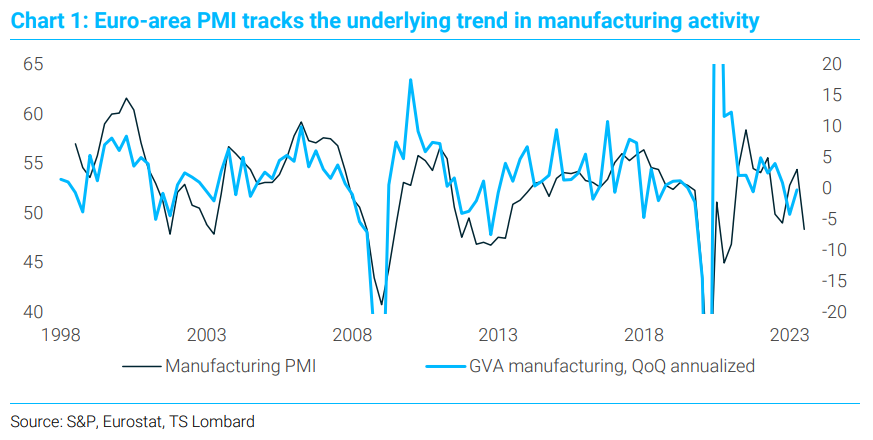
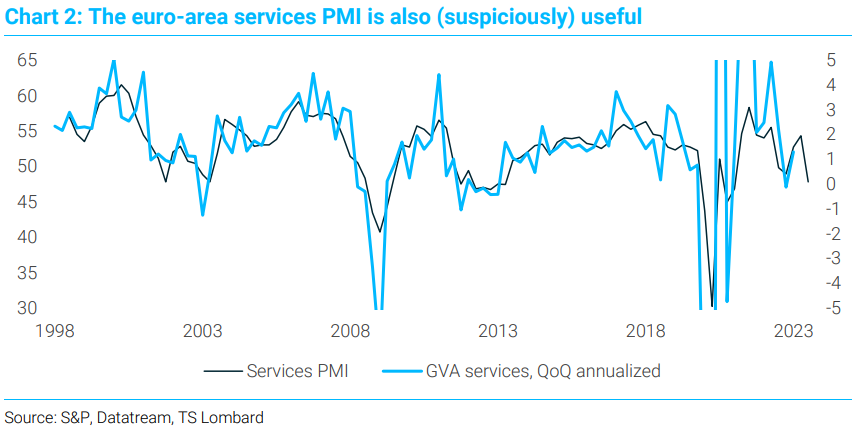
The best way to highlight this point is to compare the sectoral PMIs with their corresponding components of GDP. So, as Charts 1 and 2 show, we should plot the manufacturing PMI against manufacturing GVA, and the services PMI against services sector GVA. We focus on quarterly growth rates because – in theory – that is the horizon over which the two series should match.
Advertisement
Charts 1 and 2 suggest we can produce a pretty good “nowcast” for euro-area GDP just by aggregating the two PMIs. The services fit is so good it makes you wonder whether the Eurostat statisticians are secretly using these data as the main input to their own calculations (or, shall we say, “cross-checking” their official series with the PMIs).
An equivalent nowcast for the US, in contrast, would perform much less effectively. The US PMIs (like the ISMs, by the way) rarely track real-time movements in US GDP.
What explains this difference? One theory, from the app formerly-known-as-Twitter, is that early US GDP estimates put excessive weight on expenditure measures of GDP, which is why early vintages of US GDP data tend to be more volatile than their European equivalents (which use both output and income data).
Advertisement
But this explanation doesn’t seem satisfactory, especially as those sorts of differences should fade with successive US data revisions. We can’t match the PMIs with GDP even when we use later vintages of the official data.

The implication of our analysis is that while we can probably dismiss the weak PMI readings for the US, we should pay more attention to the data coming out of Europe. And although it is no surprise to see the manufacturing sector struggle, it is indeed worrying that post-COVID European industrial weakness is now seeping into services activity.
Advertisement
Part of the explanation undoubtedly comes from the sheer size of the industrial sector in Europe: a much larger share of output and jobs in the region depends on manufacturing, which naturally produces larger spillovers across the economy.
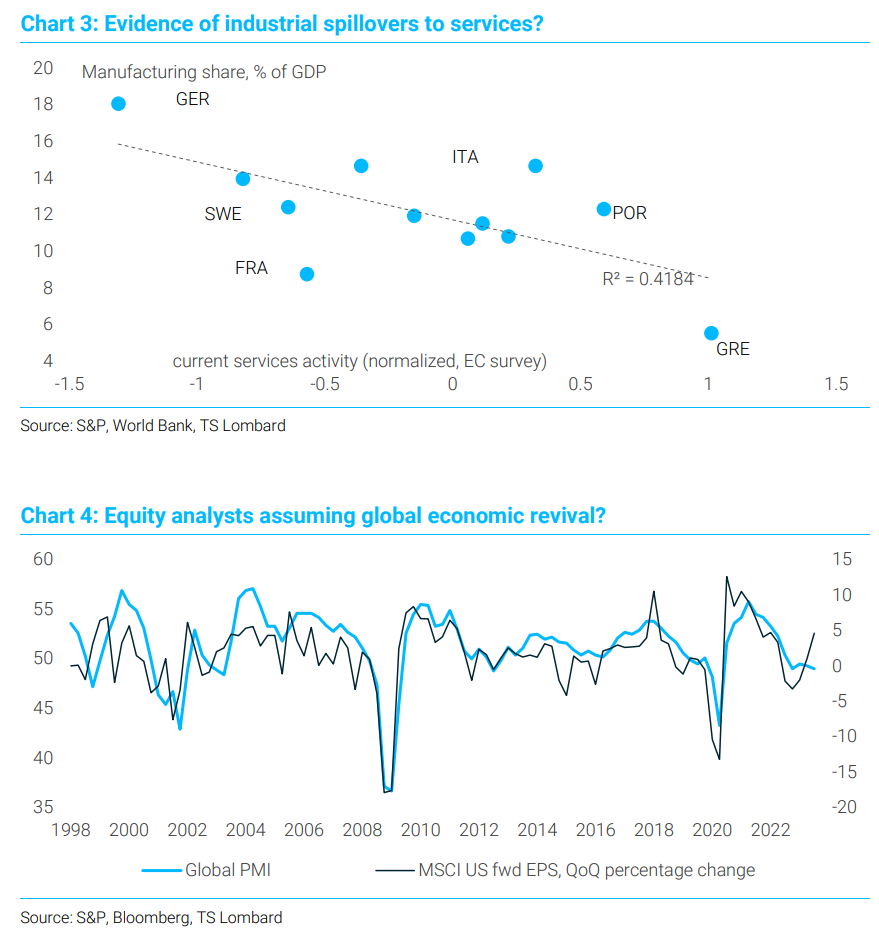
We can see evidence of these spillovers in Chart 3, which shows that services-sector weakness is now most pronounced precisely in those parts of the euro area that have the largest industrial base and the greatest export exposures. And it is not just the global bullwhip cycle that has been a problem.
Europe is facing additional pressures from China, with a toxic combination of weak domestic demand in China and China’s sudden success in the global EV market (thanks to its use of strategic industrial policy). And, of course, European energy prices are now climbing again, from levels that were already well above pre-Ukraine war levels.
Advertisement
The good news for Europe is that labour markets have not yet buckled, which suggests true recessionary dynamics have not yet kicked in. If global demand recovers soon, there is still a chance the region will avoid a more serious economic contraction.
But you have to wonder whether central banks in Europe have already tightened monetary policy too far. Not only have European central banks raised rates aggressively, but they have done so against a backdrop that wasn’t particularly “boomy” in the first place.
Given the popularity of flexible-rate mortgages and business loans, it is likely that monetary tightening in Europe is already causing significant demand destruction – possibly more than what we are seeing in the US (this week’s Macro Picture will address this issue in more detail).
Advertisement
So, it is no wonder that the ECB and BoE are keen to end their cycle of rate hikes. Perhaps they realize that they are now beating a dead horse.
One final point: Although the PMIs are not well correlated with US GDP, they do track US earnings remarkably well. Given recent upwards revisions to EPS estimates, it seems analysts are betting on an imminent global revival. European policymakers will be desperately hoping they are right…

Advertisement
What strikes me about that last chart is we appear to be dealing with a foolish generation of stock market analysts who bull up every time an accident approaches (2018, 2020 and today).
It is perhaps understandable after a decade of QE.


