Recent developments in the U.S. economy
The U.S. economy continued to grow at a strong pace in the third quarter of 2023, according to the advance estimate of Real Gross Domestic Product (GDP) by the Bureau of Economic Analysis (BEA). The economy expanded at a seasonally adjusted annual rate of 4.9%, which was the strongest GDP print since the fourth quarter of 2021 and reflects the resilience of the U.S. economy. Growth was led by consumer spending, which increased at a seasonally adjusted annual rate of 4.0% in the third quarter of 2023, compared to 0.8% in the second quarter. Private inventory investment and residential fixed investment also contributed positively to this growth. Residential investment reversed a streak of nine consecutive quarters of decline, increasing for the first time since the first quarter of 2021.
The labor market is showing signs of moderating as the economy added fewer jobs than expected in October at 150,000 jobs compared to the expectation of 190,000 jobs,1 according to the latest report from the Bureau of Labor Statistics (BLS). Along with the moderation in October, the September and August payroll gains were revised down by a combined 101,000 jobs. October job growth was led by health care, government and social assistance. Employment in manufacturing declined the most by 35,000, mainly led by a decline of 33,000 in the motor vehicle and parts category due to the United Auto Workers strike.
The unemployment rate ticked up to 3.9% in October, the highest rate since January 2022, as did the number of unemployed persons, which increased to 6.5 million. The labor force participation rate as well as employment-to-population ratio were relatively unchanged at 62.7% and 60.2% respectively. Despite slower job growth and the uptick in unemployment, the overall labor market remains strong. Job openings remain high at 9.6 million in September, according to the BLS Job Openings and Labor Turnover Survey (JOLTS). The ratio of job openings to unemployed persons continues to be relatively high at 1.5 as of September 2023.
While inflation has moderated, it remains elevated. The BEA’s estimate of Personal Consumption Expenditures (PCE) price index increased 0.4% month-over-month in September 2023, and 3.4% year-over- year. Core Inflation (PCE price index excluding food and energy) rose 3.7% from last September, and 0.3% from August 2023. While inflation has been trending lower, the annual growth rate remains well above the Federal Reserve’s longer run goal of 2%.2 In the press conference following the November Federal Open Market Committee (FOMC) meeting, Federal Reserve Chair Powell said that “the process of getting inflation sustainably down to two percent has a long way to go.”
Recent developments in the U.S. housing market
In the housing market, home sales remain moribund, with total home sales down 10% on a year-over-year basis in September 2023. Existing home sales, reported by the National Association of Realtors (NAR), were at their lowest level in thirteen years, down 2% month-over-month in September and down 15.4% year-over-year. With the rate lock-in effect keeping many existing homeowners out of the market, inventory of homes for sale remains lean. The number of existing homes for sale declined 8.1% year-over-year in September. New home sales have taken on increased importance for the housing market as the share of total home sales that are new increased to 16.1%, the highest share since 2005. The U.S. Census Bureau and U.S. Department of Housing and Urban Development reported that new home sales in September 2023 were at an annualized rate of 759,000, up 12.3% from August and 33.9% from September 2022. Overall, the inventory of new homes for sale has decreased 5.4% from last year.
Higher interest rates are also taking a toll on the confidence of homebuilders. The Housing Market Index, as reported by the National Association of Home Builders (NAHB), has declined for three consecutive months to its lowest level since January 2023.3 To support slowing sales, homebuilders have been offering incentives and price cuts. In October, 32% of builders reported cutting home prices with the average price discount at 6%, as per the NAHB. Pending contracts for existing home sales remain close to historically low levels as measured by NAR’s pending home sales index. The index increased 1.1% month-over-month in September 2023 and decreased 11% from September 2022, with all regions across the U.S. down year-over-year. To exacerbate supply side issues, housing starts and permits, reported by the U.S. Census Bureau, were both down 7.2% year-over-year in September.
Recent developments in the U.S. mortgage market
The U.S. mortgage market is stalled by higher mortgage interest rates. While the FOMC paused rate hikes for the third time this year in November, longer-term yields have been on the rise with the 10-year Treasury yield rising by more than half of a percentage point over the last couple of months. Long-term yields have been rising due to factors such as expectations that rates will remain higher for longer, rising government deficits, stronger than expected economic growth and tight labor markets. Mortgage rates followed these long-term Treasuries in their increases. The average 30-year fixed-rate mortgage, as measured by Freddie Mac’s Primary Mortgage Market Survey®, increased every week in September and October. As of the last week of October, the average mortgage rate hit a high of 7.79%, its highest level since November 2000.
According to the Federal Reserve Board’s Senior Loan Officer Opinion Survey on Bank Lending Practices (SLOOS) released in October 2023, banks reported tightening lending standards for all categories of residential real estate loans as well as Home Equity Lines of Credit (HELOC), except for government residential mortgages, which were unchanged. The percentage of banks tightening lending for all residential mortgages reached 13% as of the October 2023 release, up from around 3% in the October 2022 release. Between 20-50% of banks reported tighter lending standards for jumbo residential qualified mortgages (QMs), residential non-QMs as well as HELOCs. Furthermore, between 10% to 20% of the banks reported tighter standards on non-jumbo, non-GSE eligible residential QMs and subprime residential mortgages. Approximately 10% of banks reported tightening standards for GSE-eligible mortgages.
Tighter financial conditions reflected in both higher mortgage rates and the SLOOS have contributed to contractions in mortgage activity. According to the Mortgage Bankers Association’s Weekly Applications Survey, mortgage applications in October 2023 were the lowest since May 1995. We estimate that through the first three quarters of 2023, mortgage originations are down about 30% relative to the same period a year ago.
The higher rates and tighter financial conditions are also starting to impact consumer credit performance, particularly for credit cards. Credit card performance has been deteriorating with approximately 8% of credit card balances transitioning into 30 or more days delinquent while almost 6% of credit card balances transitioned into serious delinquencies. The uptick in the delinquencies for auto loans have been more modest, with around 4% of auto loan balances seriously delinquent and only a twelve-basis point increase in the transition to serious delinquency from 2.41% to 2.53%. On the other hand, mortgage performance remains pristine with the share of loans delinquent and those transitioning into delinquency very low as compared to other loan types.
The outlook
We expect U.S economic growth to decelerate in the fourth quarter of 2023 and remain tepid throughout 2024. Slower economic growth will result in slower payroll employment growth and an uptick in the unemployment rate. While the economy will avoid tipping into a recession, slower growth and weaker employment will dampen consumer spending. Inflation will continue to moderate but remain above the FOMC’s 2% target throughout next year and monetary policy will remain restrictive.
With inflation remaining stubbornly high and the FOMC refraining from cutting rates, longer-term Treasury yields will remain elevated in the near term. We expect the recent volatility in Treasury yields to abate which will allow modest reductions in mortgage rates. However, mortgage rates will likely not fall below 6% in the short run as the higher for longer narrative holds true.
Elevated mortgage rates and a slowing economy will present a challenge to the housing market. Home sales will remain near current levels and inventory will not increase substantially as the mortgage rate lock-in effect keeps existing homeowners locked into their current residence. Favorable demographics will keep the share of first-time homebuyers elevated and with limited inventory, upward pressure on house prices will remain. In this scenario, house prices will rise nationally, increasing 5.4% in 2023 and 2.6% in 2024.
Mortgage origination volumes are expected to remain low throughout 2024 before modestly increasing in 2025. Even though house prices have been on the rise, lower sales volume will keep purchase mortgage volumes lower. While mortgage rates remain above 6%, there will be very limited refinance activity. Overall, total mortgage origination activity will remain low through most of 2024 but start to increase at the end of the year and see modest increases in 2025.
NOVEMBER 2023 SPOTLIGHT:
Young adult homebuyers are cracking the homeownership code
Prospective first-time homebuyers (FTHBs) have faced elevated home prices and more recently, the highest mortgage rates in a generation. Yet despite these affordability challenges, young FTHBs have been a dominant driver of the housing market. From 2017 through 2022, there were over 12.6 million FTHBs in the United States, which is an increase of 4 million FTHBs compared to the previous 5-year period (2011 to 2016). How have they been able to crack the homeownership code?
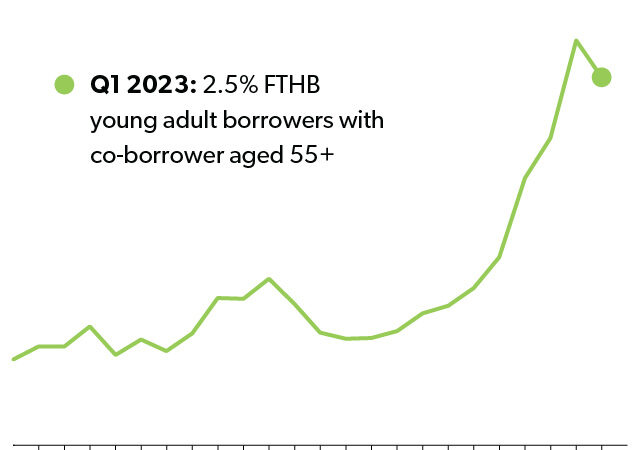
There are several ways homebuyers are getting help, especially when it comes to down payments. In our previous analysis, we show that while savings and inheritance are the number one sources for a down payment, help from friends and families is also a fundamental source of down payment assistance. In the latest available data, 22% of the borrowers in 2020 used family and friends’ help for a down payment, according to the National Survey of Mortgage Originations (NSMO).4 More interestingly, in our analysis using the latest available National Mortgage Database (NMDB),5 we find that the help from family goes beyond down payment assistance into the co-borrowing space. While co-borrowing with a spouse or a partner is the most common form of co-borrowing, there has been an increase in co-borrowing of 25–34-year-olds with a 55+ co-borrower (Exhibit 1, previous page). For example, in 2000, the share of young adult FTHBs with a co-borrower aged 55+ was 0.6%. At of the end of the first quarter of 2023, the share reached 2.5%.6


