For a while now, the Bank of Japan (BOJ) has been concerned about its weakening currency, and in the past, have gone so far as to intervene when they felt a change of direction was needed.
This time around though, they opted to raise rates, albeit a tiny amount, this still represents a seismic shift in historical policy.
The central bank also abandoned its yield-curve control and ended most of its asset purchases aimed at policy easing.
So, the question now becomes, are any of these changes impacting the direction of the JPY pairs at this time.
Keeping in mind that the trajectory of the is usually the most important one for Japan, as they consider the U.S. their primary trading partner and have a solid export economy.

Traders should eye the USDJPY both separately and together with other JPY crosses.
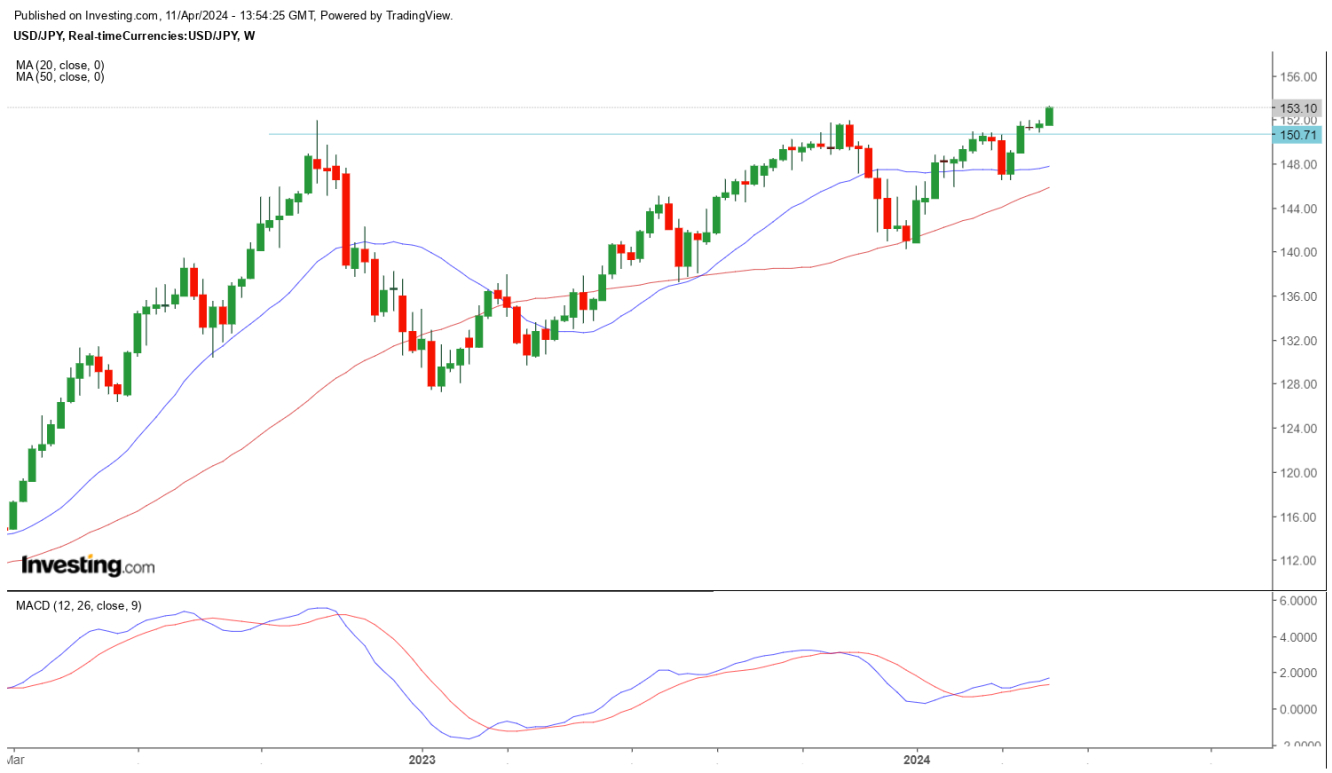
The USDJPY is still breaking higher (for now). Not really the BOJ’s preferred direction.
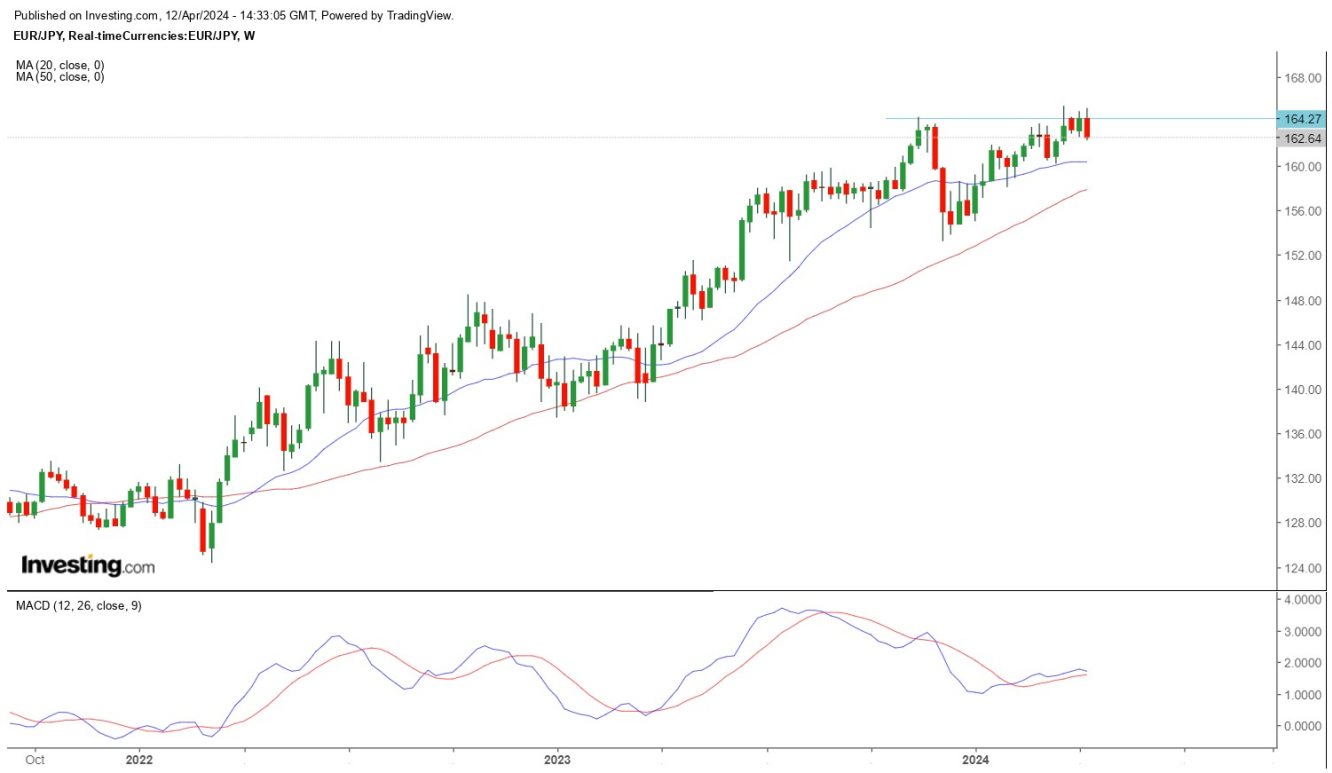
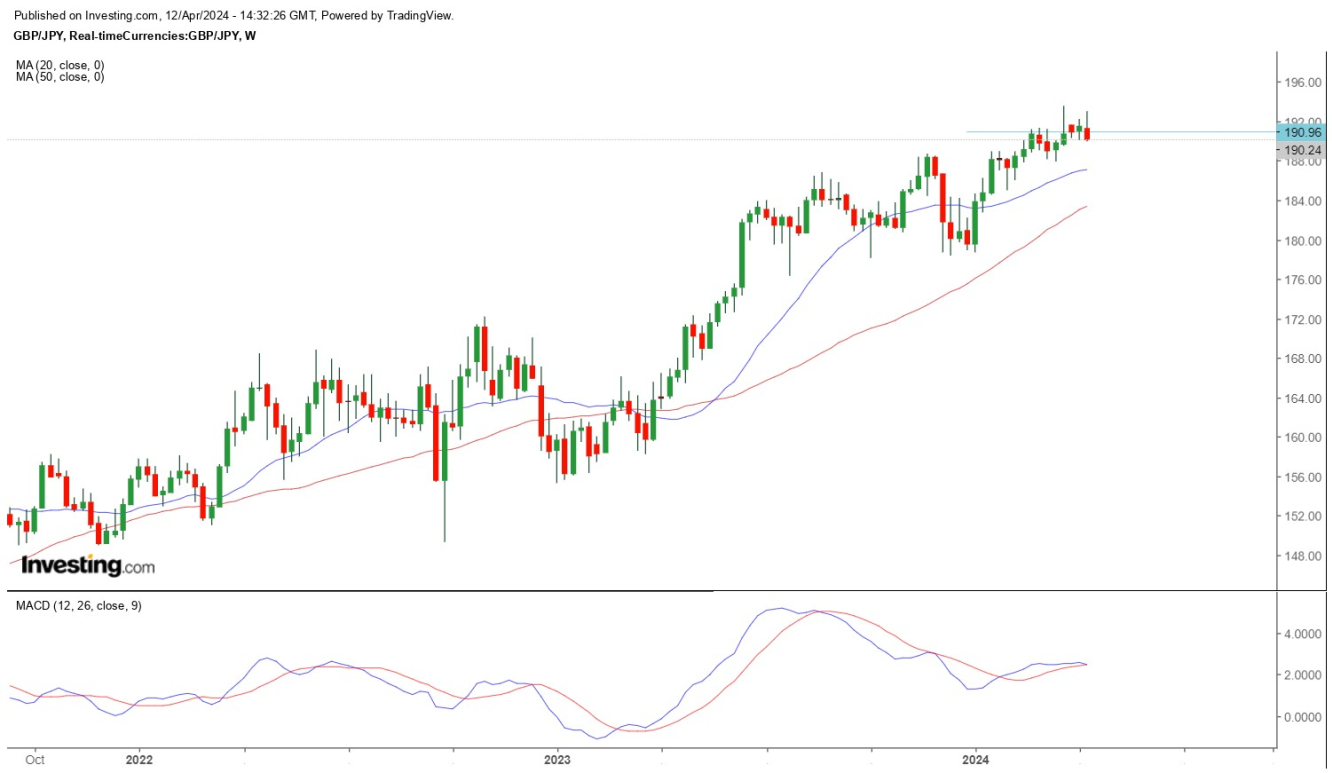
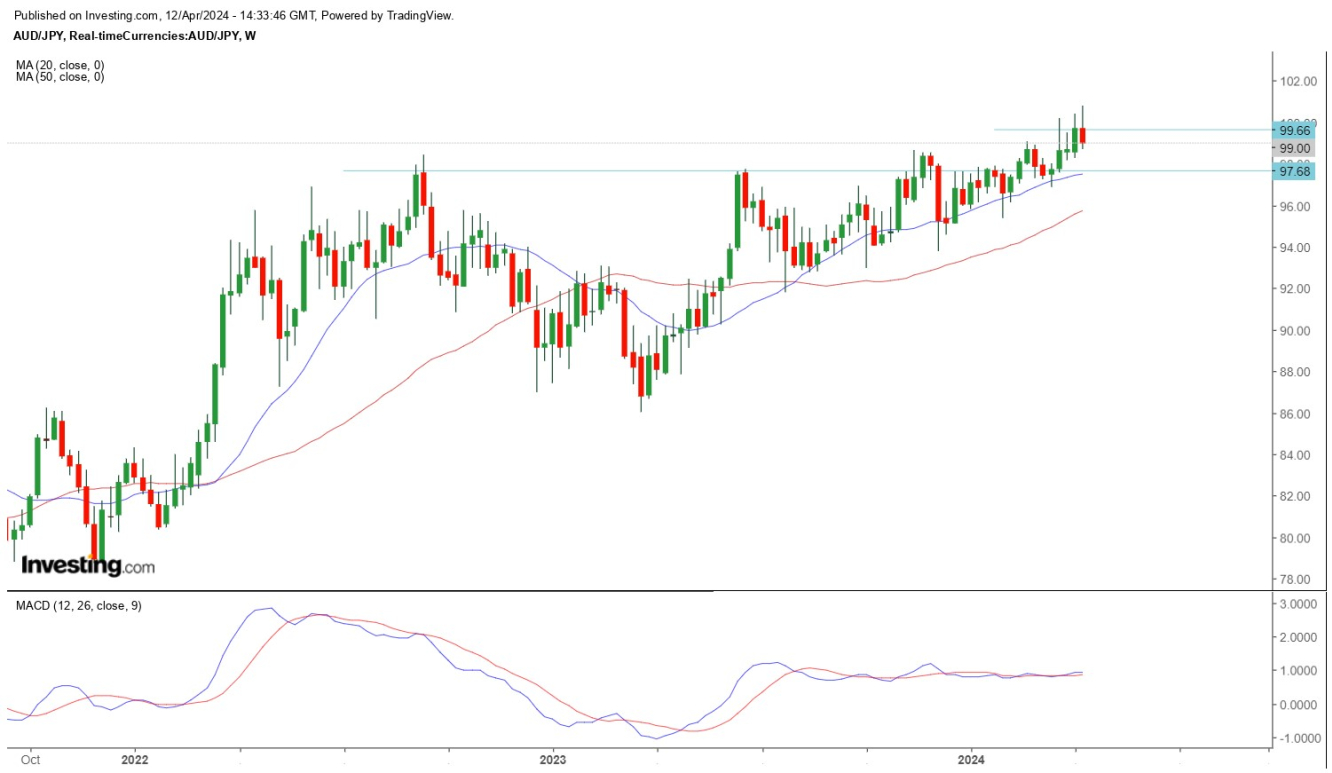
We can say without doubt that the last 3 years have shown a very consistent trend to the upside for almost all, if not all, JPY pairs.
Now we want to see if the initial, but significant policy changes, will change the course of this particular river.
The weekly chart is the best one to watch, as a clear close and move below the 50 moving average will likely confirm that the changes are having the desired impact. Especially, if we start to see respectable historical lows getting broken. I will update on this over the next few months, or if/when enough key levels have been broken.
A few other JPY crosses, shown below, are however struggling a bit.


It’s tricky, because for now the up-trend is still intact, but there are also clear signs of price action failing at the highs. That leaves us in an awkward position of having to ‘wait and see’, which could take several weeks.
As I wrap this up, traders are waiting for (on the weekly timeframe):
- Red rejection candles at clear resistance
- A strong push to the downside
- Price breaks below more than one significant recent swing low (maybe months old)
- Price switches to operating below the 50 moving average.
Stay tuned, I will update when enough of these have occurred on several pairs.
Alternatively, should the trends shake these attempts off and stay the course, then that will be visually obvious also.
Like this article? Read more from my Investing.com profile here:
https://uk.investing.com/members/contributors/256252463
Disclaimer: Any content in this article is purely financial markets discourse and not financial advice. Please consult a regulated professional before making any financial decisions.


