Unfortunately, it has been over two months since we last provided a public update on Ethereum () when it was trading at around $2300; see here. Back then, we expected ETHUSD to correct to ideally $1950+/-150 before it would stage a rally to ~$4400, contingent on “[However,] if ETHUSD continues to rally and breaks out above the January 12 high without going below the January 23 low, the grey W-iii is already underway to at least $4400.”
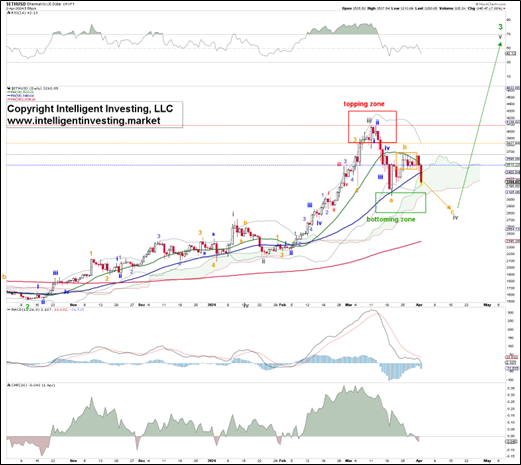
The latter is what happened, and the crypto topped on March 12 at $4093 and started to correct. As such, we have updated our Elliot Wave Principle (EWP) count accordingly, but the upside is most likely not done yet as we still expect a grey W-v to $5000+/-200. See Figure 1 below.
Figure 1. The daily resolution candlestick chart of ETH with several technical indicators

Thus, as stated in our last update
“We cannot predict the future, but with the EWP, we know above or below which price levels, specific patterns, and paths become operable.” The breakout above the January 12 high was the queue for our premium members who swing trade to go long again and enjoy a 50% gain as we turned cautious again in mid-March. Thus, Ethereum will have to break above at least last week’s bounce highs (the orange W-b in Figure 1) to signal the correction is already over. Otherwise, we continue to view Ethereum in the orange W-c of grey W-iv to ideally $2950+/-150 before the grey W-v of the green W-3 to ideally $5000+/-200 kicks in. Besides, all the technical indicators (TI) like the RSI, MACD, and CMF point lower: weakness.
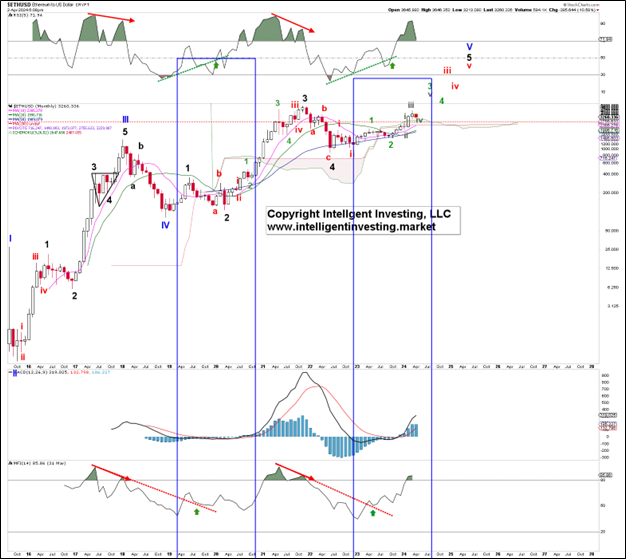
In addition, our big-picture EWP count, see Figure 2 below, shows that Ethereum still needs to wrap up the green W-3, -4, and red W-iii, iv, -v to complete the larger Blue W-V, contingent on holding above the grey W-i high at around $2700: red dotted horizontal line. However, ETHUSD only kicked off Bear markets on negatively diverging RSI and MFI readings (red solid arrows), while the price action in the blue boxes shows the recent RSI and MFI breakout is like that for the 2019-2021 Bull. Thus, based on this TI analysis, we don’t expect a significant top in.
Figure 2. The monthly resolution candlestick chart of ETH with several technical indicators


