
Investors in U.S. Physical Therapy (NYSE:USPH) have unfortunately lost 21% over the last five years

The main aim of stock picking is to find the market-beating stocks. But the main game is to find enough winners to more than offset the losers At this point some shareholders may be questioning their investment in U.S. Physical Therapy, Inc. (NYSE:USPH), since the last five years saw the share price fall 26%. The falls have accelerated recently, with the share price down 13% in the last three months. We note that the company has reported results fairly recently; and the market is hardly delighted. You can check out the latest numbers in our company report.
Now let’s have a look at the company’s fundamentals, and see if the long term shareholder return has matched the performance of the underlying business.
See our latest analysis for U.S. Physical Therapy
To quote Buffett, ‘Ships will sail around the world but the Flat Earth Society will flourish. There will continue to be wide discrepancies between price and value in the marketplace…’ One imperfect but simple way to consider how the market perception of a company has shifted is to compare the change in the earnings per share (EPS) with the share price movement.
While the share price declined over five years, U.S. Physical Therapy actually managed to increase EPS by an average of 1.8% per year. Given the share price reaction, one might suspect that EPS is not a good guide to the business performance during the period (perhaps due to a one-off loss or gain). Alternatively, growth expectations may have been unreasonable in the past.
Based on these numbers, we’d venture that the market may have been over-optimistic about forecast growth, half a decade ago. Looking to other metrics might better explain the share price change.
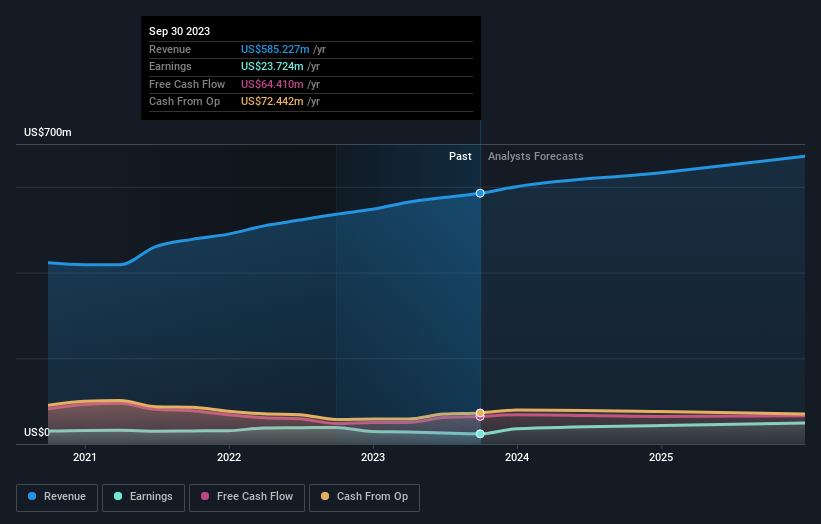
We don’t think that the 2.0% is big factor in the share price, since it’s quite small, as dividends go. In contrast to the share price, revenue has actually increased by 5.4% a year in the five year period. A more detailed examination of the revenue and earnings may or may not explain why the share price languishes; there could be an opportunity.
The image below shows how earnings and revenue have tracked over time (if you click on the image you can see greater detail).
We’re pleased to report that the CEO is remunerated more modestly than most CEOs at similarly capitalized companies. It’s always worth keeping an eye on CEO pay, but a more important question is whether the company will grow earnings throughout the years. So it makes a lot of sense to check out what analysts think U.S. Physical Therapy will earn in the future (free profit forecasts).
What About Dividends?
When looking at investment returns, it is important to consider the difference between total shareholder return (TSR) and share price return. The TSR incorporates the value of any spin-offs or discounted capital raisings, along with any dividends, based on the assumption that the dividends are reinvested. It’s fair to say that the TSR gives a more complete picture for stocks that pay a dividend. In the case of U.S. Physical Therapy, it has a TSR of -21% for the last 5 years. That exceeds its share price return that we previously mentioned. And there’s no prize for guessing that the dividend payments largely explain the divergence!
A Different Perspective
U.S. Physical Therapy shareholders gained a total return of 5.3% during the year. Unfortunately this falls short of the market return. But at least that’s still a gain! Over five years the TSR has been a reduction of 4% per year, over five years. So this might be a sign the business has turned its fortunes around. It’s always interesting to track share price performance over the longer term. But to understand U.S. Physical Therapy better, we need to consider many other factors. To that end, you should be aware of the 3 warning signs we’ve spotted with U.S. Physical Therapy .
We will like U.S. Physical Therapy better if we see some big insider buys. While we wait, check out this free list of growing companies with considerable, recent, insider buying.
Please note, the market returns quoted in this article reflect the market weighted average returns of stocks that currently trade on American exchanges.
Have feedback on this article? Concerned about the content? Get in touch with us directly. Alternatively, email editorial-team (at) simplywallst.com.
This article by Simply Wall St is general in nature. We provide commentary based on historical data and analyst forecasts only using an unbiased methodology and our articles are not intended to be financial advice. It does not constitute a recommendation to buy or sell any stock, and does not take account of your objectives, or your financial situation. We aim to bring you long-term focused analysis driven by fundamental data. Note that our analysis may not factor in the latest price-sensitive company announcements or qualitative material. Simply Wall St has no position in any stocks mentioned.


