
Investing in Places Historically Left Behind: Foreign Direct Investment in U.S. Clean Energy Manufacturing | CEA
In recent decades, amidst competition with Chinese imports—often referred to as the “China Shock”—some towns and cities in the United States experienced steep manufacturing job loss and declines in economic activity. To address this, the Biden administration has made a deliberate effort to align its broad industrial strategy with the goals of revitalizing U.S. manufacturing and boosting local economies in areas distressed by import competition. The Administration has made strategic investments in infrastructure, clean energy, and semiconductors that have crowded in significant private investment, both from domestic and foreign firms. In this analysis, we pay special attention to the latter group, prompted by the massive investments made by global chip fab operators, solar panel manufacturers, and firms in other clean energy sectors.
As the largest recipient of foreign direct investment in the world, the United States has experienced a dramatic increase in clean energy manufacturing investment, with regional economic development organizations and federal initiatives playing key roles. Specifically, this CEA blog highlights that foreign direct investment from partners and allies is making up a sizable share of overall investments spurred by the Biden Administration’s industrial strategy. We also find preliminary evidence that these investments have disproportionately gone to areas ill-affected by the “China shock” – underscoring how investments can promote growth overall as well as equity and fairness.
Investors headquartered in foreign countries play an important role in boosting clean energy investments in manufacturing
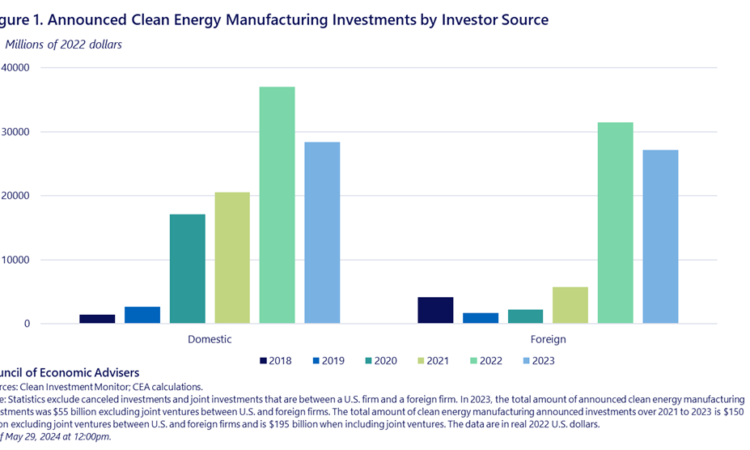
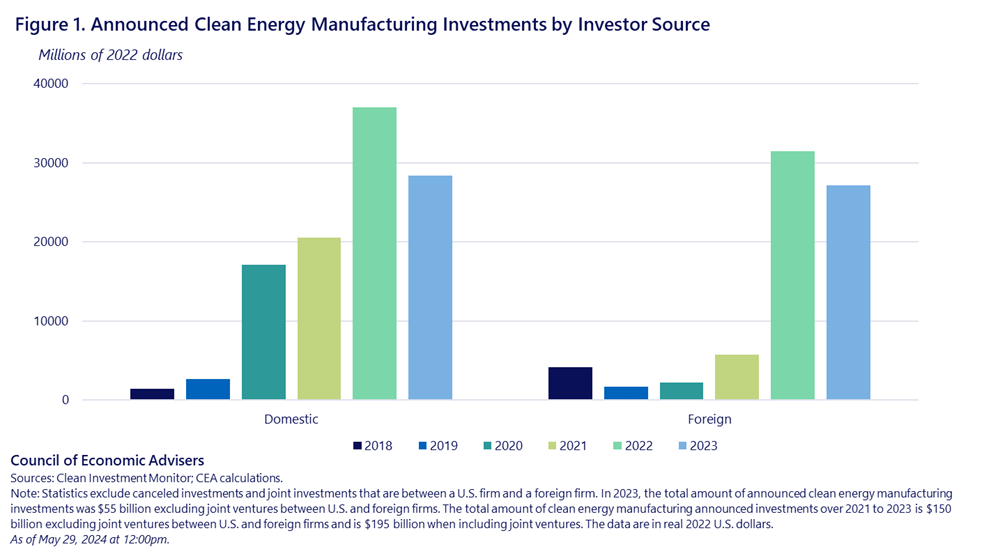
Since President Biden took office, private companies have announced $866 billion in investment commitments in strategic industries such as semiconductors, EVs, and clean power. Of this total, some projects remain in the planning stage, but many investments have entered construction and production. Focusing on just clean energy manufacturing technologies, a joint Rhodium-MIT database estimates new announcements of clean energy manufacturing investments in 2023 totaled over $68 billion – more than 10 times 2019 manufacturing investments and nearly double their 2021 level, though down from the $87 billion announced in 2022. Investors with headquarters in foreign countries accounted for over 45 percent (58 billion) of the value of new clean energy manufacturing investment announcements in 2022 and 2023, excluding domestic-foreign joint ventures (Figure 1).
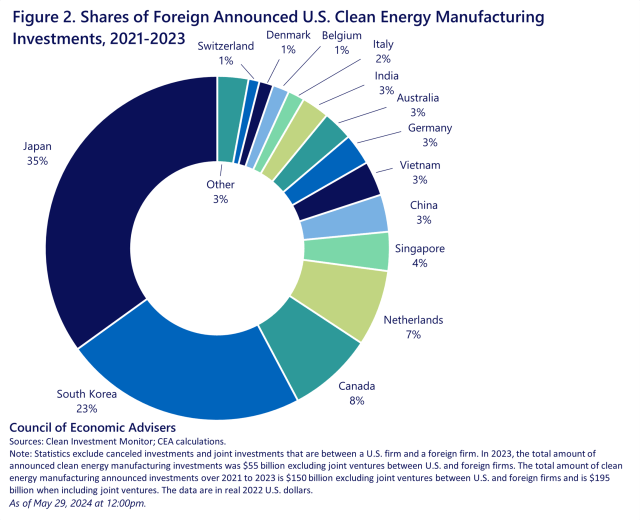
Recent clean energy foreign investments in manufacturing are concentrated amongst our closest trading partners and strategic allies. Amongst the top 20 largest clean energy foreign investments between 2021 to 2023, Japanese and South Korean firms account for some of the largest (e.g., in batteries and electric vehicles) alongside European firms (e.g., the Netherlands and the Germany). Meanwhile, Canadian firms are making large investments in critical minerals (Figure 2). Since 2021, none of the top 20 manufacturing investment announcements have been from firms headquartered in China. Furthermore, those manufacturing investment announcements from companies that were headquartered in China comprise only 1.5 percent of all investments – which include Energy and Industry – from 2021 to 2023, and only around 3 percent of all foreign manufacturing investment announcements over the same time horizon (Figure 2).
New clean energy manufacturing FDI is likely to contribute to manufacturing employment gains in regions that historically experienced disinvestment.
The United States experienced a sharp decline in U.S. manufacturing employment in the 2000s, driven in part by increased import penetration, especially from China. Communities hardest hit by these forces experienced larger declines of their employment bases (Autor, Dorn, and Hanson 2013; Galle and Lorentzen 2024.) Figure 3 maps historical manufacturing employment changes across commuting zones over 1990–2007. Areas that incurred higher job losses are indicated in darker shades of gray. After dropping projects without confirmed geographical locations, CEA analysis finds that between 2021 to 2023, firms with foreign headquarters made up 82 of the total 220 manufacturing investment projects. These investments (as well as U.S. domestic investments) are shown as bubbles on the map; they are sized to correspond to the estimated value of manufacturing clean energy projects over 2021 to 2023 and are colored to indicate the investor’s headquarters country.
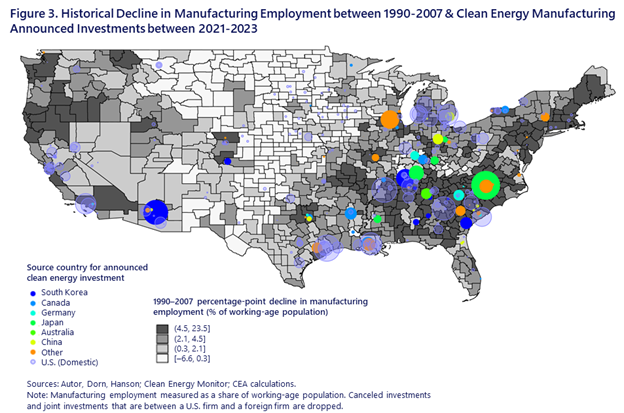
Table 1 shows economy-wide average FDI value by quartiles of manufacturing employment decline—the fourth quartile being communities that lost the most jobs. There is an increasing relationship between average FDI and areas that experienced larger employment declines. Statistical analysis further corroborates a robust, positive correlation between communities that experienced higher employment declines between 1990-2007 and inflows of FDI in clean energy, both in the number and total size of clean energy manufacturing FDI projects.
Table 1: Average Value of Clean Energy Manufacturing FDI by Commuting Zone
| Manufacturing Job Loss by Commuting Zone (Quartiles, 1990-2007) | Average Value of Clean Energy Manufacturing FDI by Commuting Zone (Million USD, 2021-2023) |
| 1st Quartile | $0.54 |
| 2nd Quartile | $35.56 |
| 3rd Quartile | $81.89 |
| 4th Quartile | $158.19 |
Conclusion
FDI, especially from firms headquartered in Japan, South Korea, Canada, and several European countries, represents a large share of the manufacturing investment announcements since 2021. Foreign investment is an important complement to investment from American firms in reversing the deindustrialization that has taken place in some regions of the country in recent decades.


