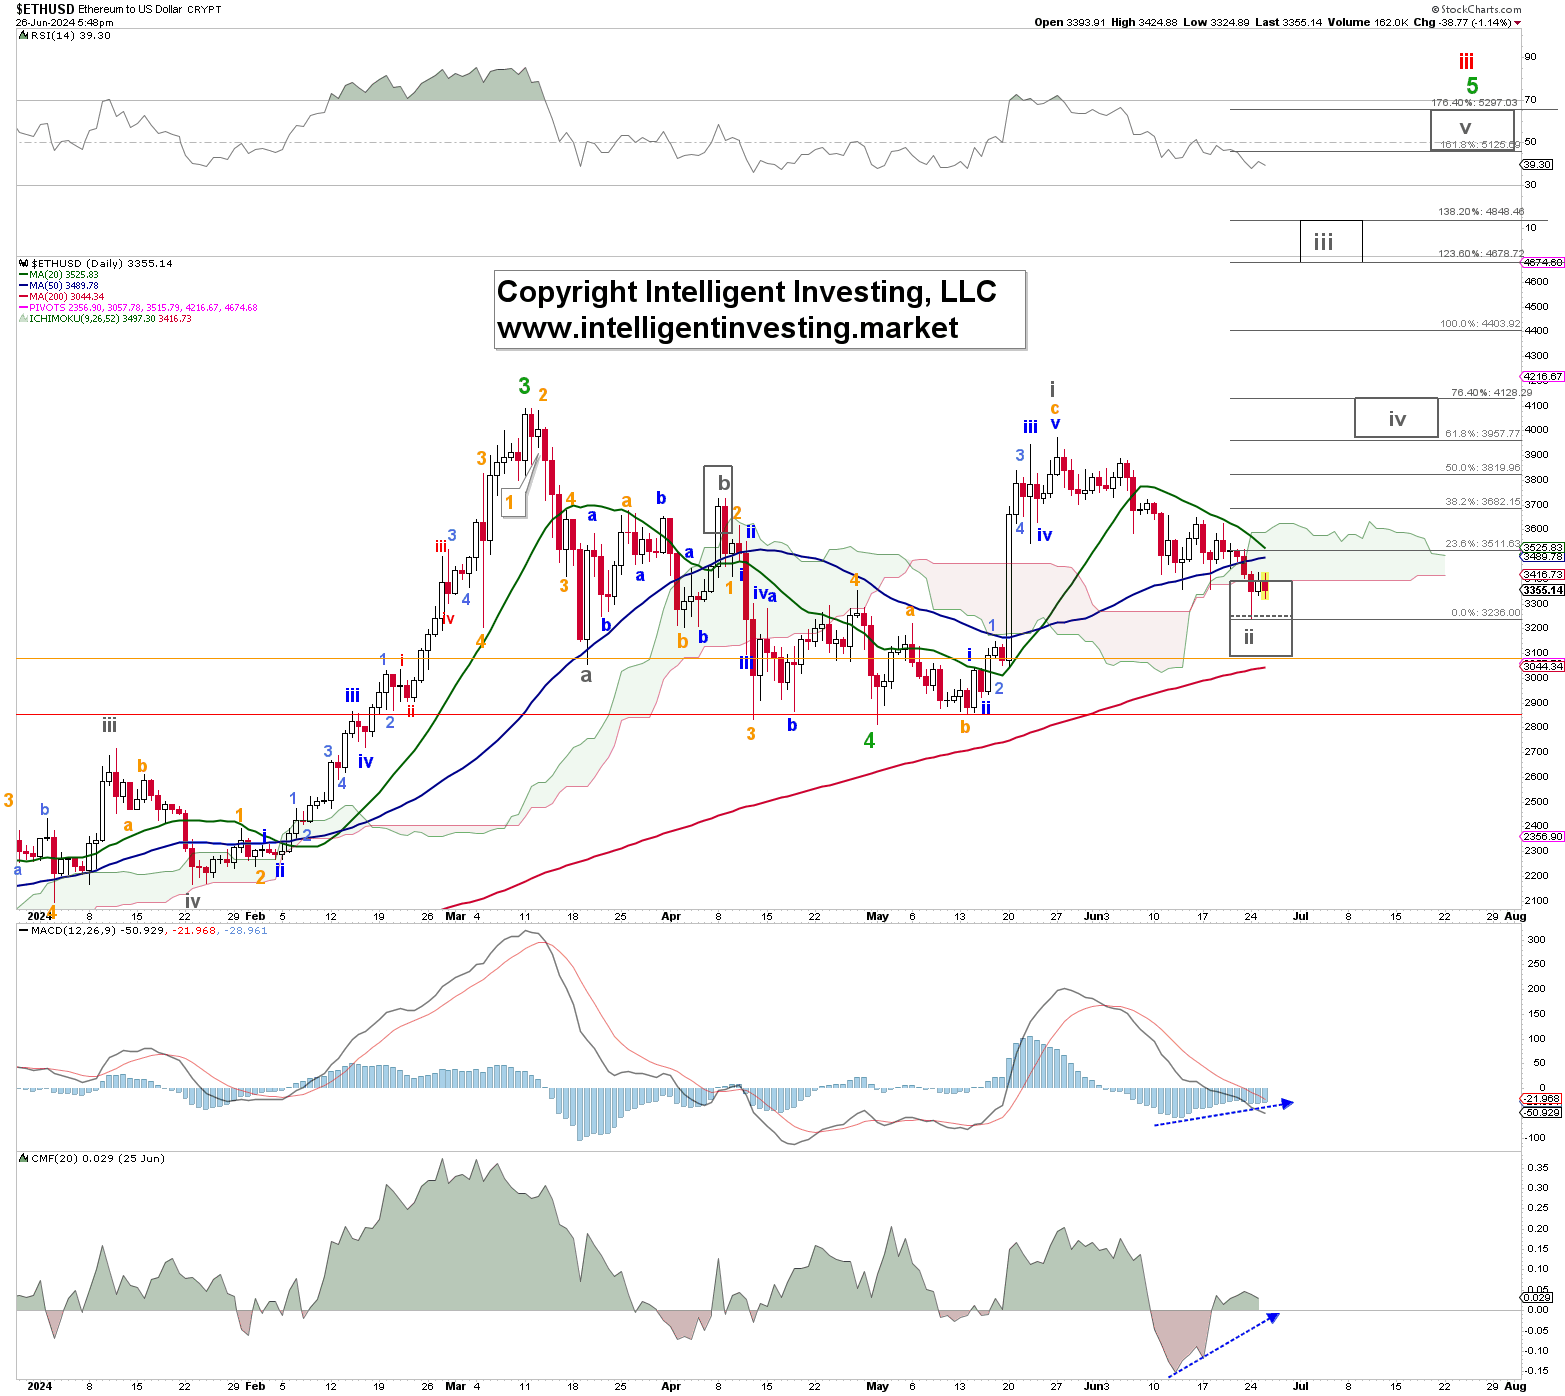
Over the last several months, we found using our Elliot Wave Principle (EWP) count that Ethereum () was most likely gearing up for a rally to $4800-5400. We tracked it as a standard impulse pattern “contingent on holding above key price levels because there are no certainties. Only probabilities.”
On Monday, May 20th, the second-largest cryptocurrency by market cap rallied strongly but has since given up most of those gains. See Figure 1 below. Hence, Ethereum failed to hold above several key price levels we had laid out, so we must adapt our preferred POV. Allow us to explain below.

The rally from the green W-4 low made on May 1 now counts best as three (orange a, b, and c) waves up. In ending diagonals (see here). The ending diagonal is a special type of wave that can occur in Wave 5 of an impulse. The wave structure of an ending diagonal is different from that of the impulse wave. Where the impulse wave had a general structure count of 5-3-5-3-5, the ending diagonal most often has a structure count of 3-3-3-3-3. All five waves of an ending diagonal break down to only three waves each, indicating exhaustion of the larger degree trend. Also, Wave 1 and Wave 4 may overlap each other.
Thus, the current rally and decline could be (grey) W-i and W-ii of the (green W-5), contingent on holding above the orange and red horizontal warning levels. Namely, second waves, also in an ED, tend to bottom out around a 50.0-76.4% retracement of the preceding same-degree 1st wave. On Monday, ETHUSD reached the 61.80% retracement and—so far—bounced off it. Thus, although Ethereum can move even a bit lower to ~$3045, it should not move much below it to keep the ED pattern alive. A break above the (blue) 50-day Simple Moving Average and its Ichimoku Cloud can trigger the grey W-iii, iv, v per the Fibonacci-target zones, as shown.
Meanwhile, positive divergences (blue dotted arrows) are forming, suggesting exhaustion of the current downtrend, but it is a condition, not a trigger. Suppose the Ethereum Bulls fail to show up over the next few days. In that case, they risk a breakdown to as low as $2900+/-200 before starting their next attempt for that rally to $4800-5400. Namely, we remain long-term Bullish on this cryptocurrency, which started its Bull run towards ideally $10+/-2.5K in 2022, contingent on holding above $2150.


