
andresr/E+ via Getty Images
Searching for viable high-yield income vehicles in 2023?
Closed-end funds generally offer high dividend yields, but buying them has an interesting wrinkle. As CEFs have a fixed amount of shares, they can sell at premiums or discounts to their net asset values – NAVs.
Their NAV/share is calculated at the end of each day, giving investors the current premium or discount the CEF is selling for. A useful strategy when buying CEFs is to try to buy them at deeper discounts or lower premiums than their historical averages due to mean reversion.
The two CEFs we’re covering in this article, Liberty All-Star Equity (NYSE:USA) and its sister fund Liberty All-Star Growth (ASG), were both selling at discounts to NAV/share, as of the 5/11/23 close, but ASG had a much deeper discount.
USA’s -0.17% price/NAV is cheaper than its one-year and three-year price/NAV of 1.79% and 0.53%, but not as cheap as its five-year -1.48% price/NAV, whereas ASG’s -4.91% price/NAV was much cheaper than its one-, three-, and five-year average price/NAV of -0.25%, 2.90%, and 1.50%, respectively:

Hidden Dividend Stocks Plus
Combining a significantly lower than average price/NAV with an oversold reading on a CEF’s long-term stochastic chart also can help you buy at the right price.
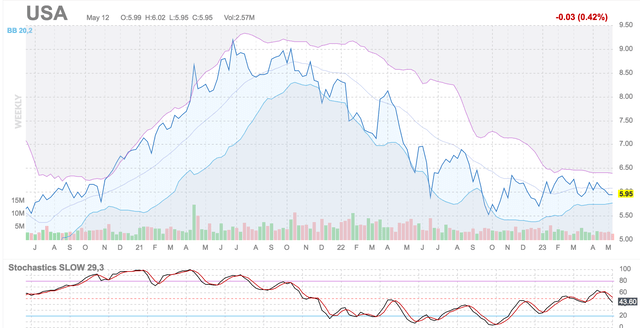
USA has declined considerably from its $9-plus price in July 2021, to ~$5.95, but is ~43.6 on its long-term slow stochastic chart, not that close to the oversold bar:
fnvz
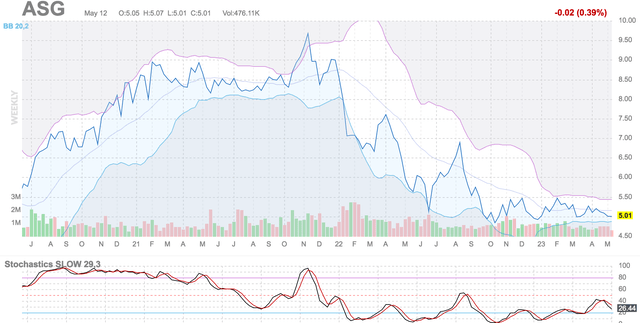
ASG has taken a tumble all the way down to ~$5.00 since November ’21 when it was over $9.50. At ~26.40, it’s quite close to the oversold 20 threshold on its long-term slow stochastic chart:
fnvz
Fund Profiles:
USA uses a multi-faceted approach to its investments, using three value portfolio managers and two growth managers with expertise in different slices of the market. Its portfolio holds 60% in value equities and 40% in growth equities.
ASG specializes in growth equities, utilizing three managers, each focusing on either small, mid, or large market cap equities.
Both funds were launched in 1986, and both pay variable quarterly distributions. USA’s policy is to pay distributions on its shares totaling ~10% of its NAV per year, payable in four quarterly installments of 2.5% of the fund’s NAV. ASG’s policy is to pay distributions on its shares totaling ~8% of its net asset value per year, payable in four quarterly installments of 2% of the fund’s NAV.
USA is much larger than ASG, with $1.5B in net assets, and 823K in average trading volume. Its expenses are a bit lower, at 0.93%, vs. 1.14% for ASG, and it has 148 holdings, vs. 119 for ASG. Both funds pay quarterly.

Hidden Dividend Stocks Plus
Dividends:
USA has a higher dividend yield, at ~10%, vs. 8.75% for ASG, whereas ASG has a much higher five-year dividend growth rate of 11.48%, vs. 6.81% for USA.
With NAV’s falling, both funds trimmed their dividends in 2022.
USA’s payouts declined from $.21 in Q3 2021, to $.15 in Q4 ’22. ASG’s distributions also fell from $.21 in Q3 ’21, to $.10 in Q4 ’22, and then rose to $.11 in Q1 ’23. ASG also paid a special $.34 distribution in Q4 ’21 to avoid excise tax.

Hidden Dividend Stocks Plus
Taxes:
The most recent tax info from USA shows its distributions from Q4 ’21 – Q3 ’22 were characterized as 55.2% long-term capital gains, and 40.11% return of capital, with 4.69% as qualified dividends.

USA site
Holdings:
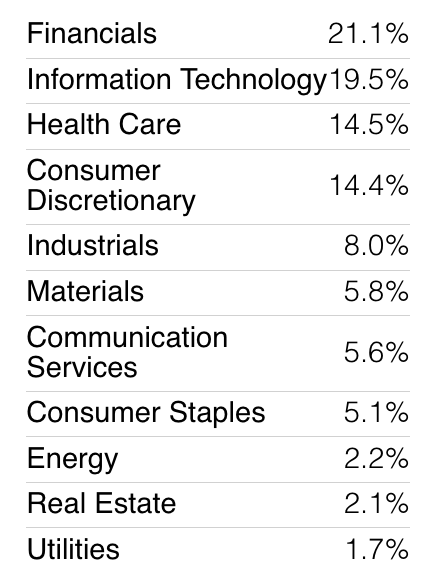
As of 3/31/23, USA’s top sector exposures were financials, tech, healthcare, and consumer discretionary, forming ~70% of its portfolio. Notable changes vs. 9/30/22 were: Financials – up ~14%; tech – down ~9%; down ~8%; and industrials – down ~4%.
USA site
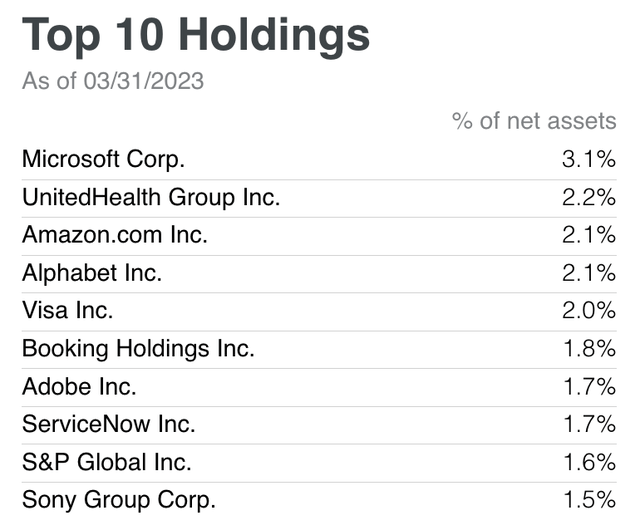
Since 9/30/22, USA’s top 10 added Booking Holdings (BKNG), ServiceNow (NOW), and Sony (SNE), while dropping Charles Schwab (SCHW), Danaher (DHR), and Dollar General (DG):
USA site
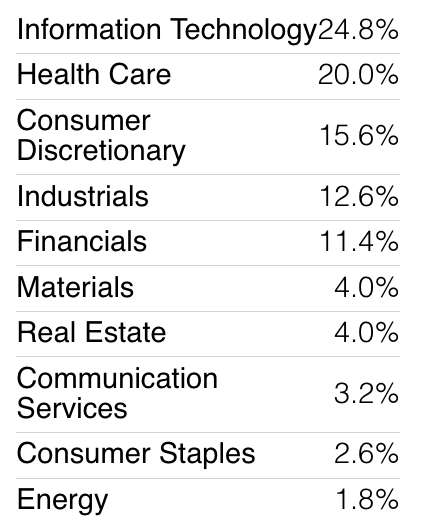
ASG’s top five sector exposure formed ~84% of its portfolio, as of 3/31/23. Its biggest exposure changes were: Tech – down ~3%, healthcare – down ~2%, consumer discretionary – up ~2%, and financials – up 2.4%:
ASG site
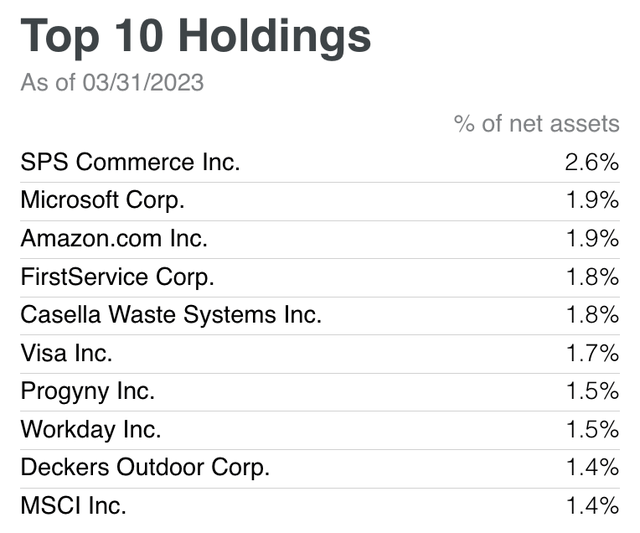
ASG’s top 10 holdings formed 16.5% of its portfolio, as of 3/31/23. Notable changes vs. 9/30/22 were: UnitedHealth (UNH), Montrose Environmental (MEG), and Globant (GLOB) came off of the top 10, and were replaced by Deckers (DECK), Workday (WDAY), and Progyny (PGNY).
ASG site
Performance:
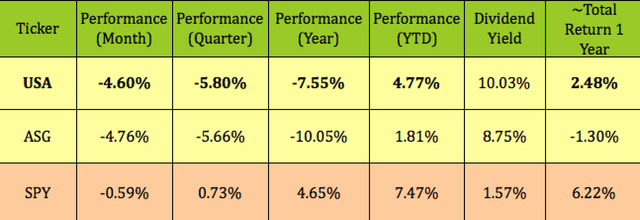
USA has outperformed ASG so far in 2023 and over the past year. However, both funds have trailed the S&P 500 during all of the periods listed below.
Hidden Dividend Stocks Plus
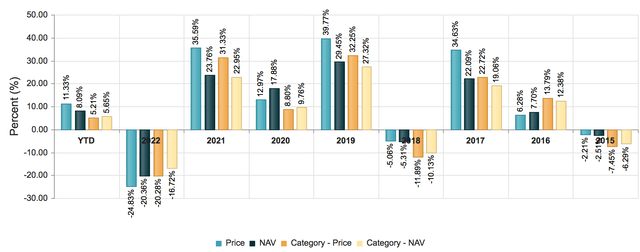
USA outperformed the Morningstar US CEF US Equity category in 2017-2021 and 2015, but lagged in 2022:
cfcnt
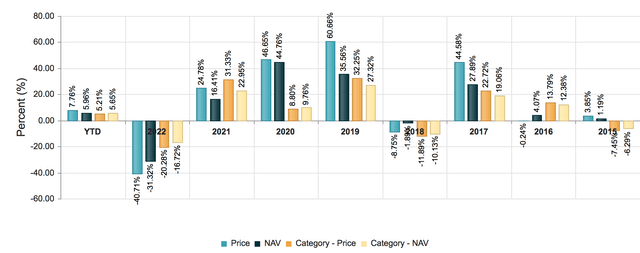
ASG outperformed in 2017-2020, but lagged in 2021 and 2022:
cfcnt
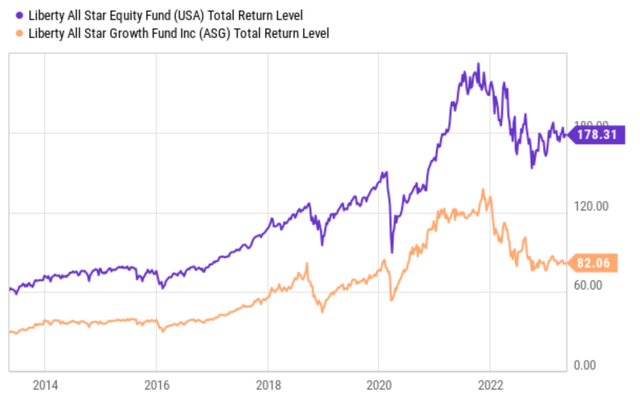
The 10-year chart shows USA outdistancing ASG by a wide margin on a total return basis:
Ycharts
Parting Thoughts
ASG looks like it’s better positioned for a short/near term buy now than USA, with a deeper than average discount to NAV, and a nearly oversold reading on its stochastic chart.
All tables furnished by Hidden Dividend Stocks Plus, unless otherwise noted.

