

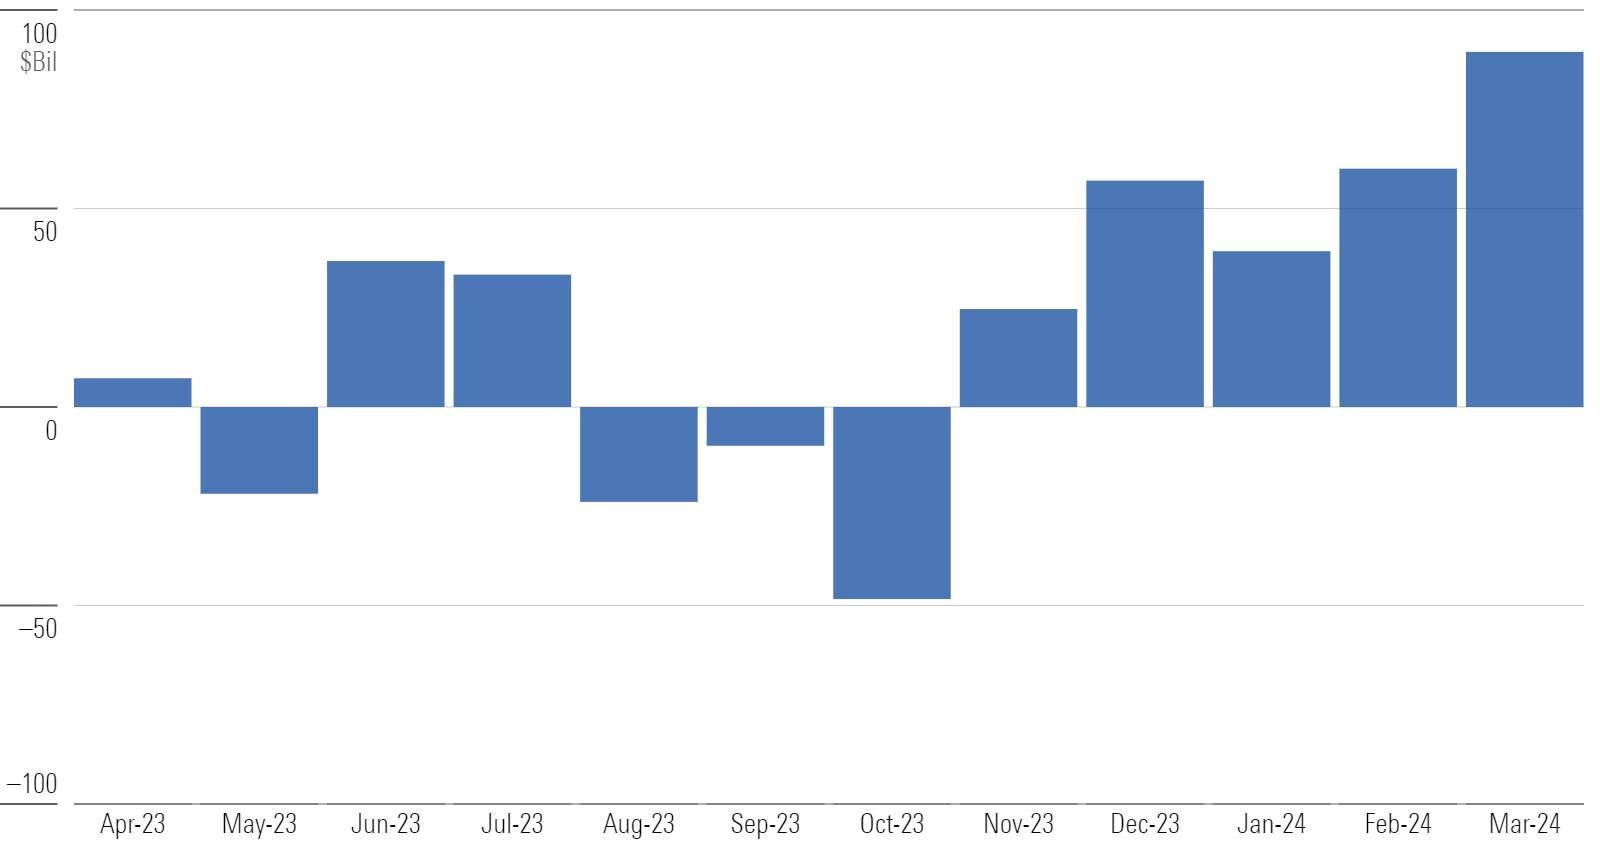
Investors plowed about $89 billion into US mutual funds and exchange-traded funds in March 2024, the highest total since August 2021. For the first quarter, US funds gathered $189 billion, also the most since 2021. Demand was broad-based in March as all but two of the 10 category groups enjoyed inflows.
US Equity Funds Put Up a Strong Month in March
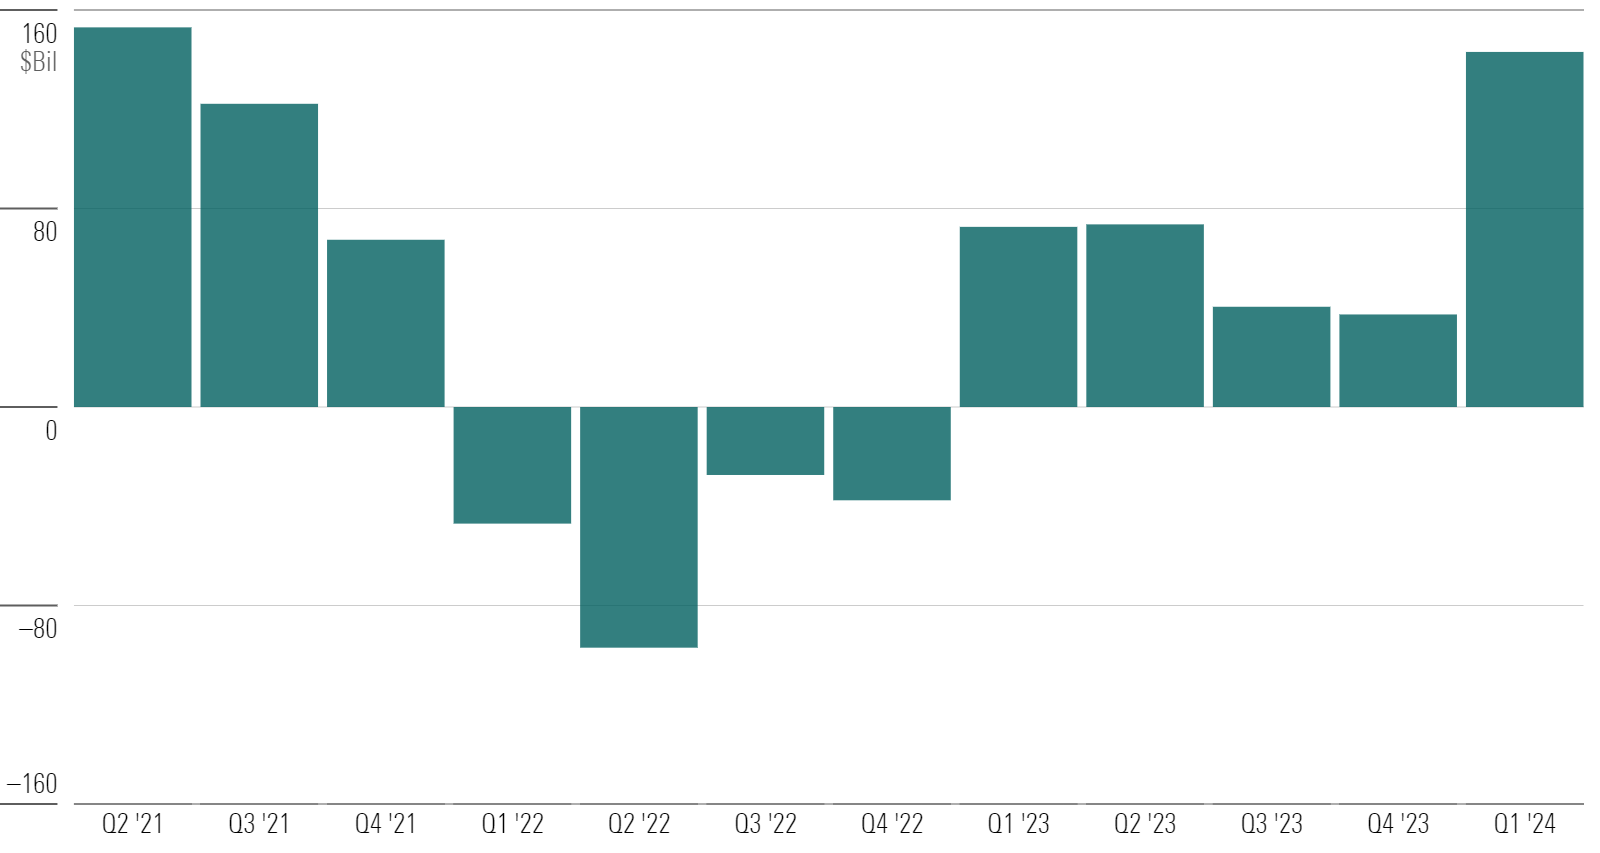
Investors plowed $32 billion into US equity funds in March, the second-highest total since May 2022. As usual, index funds led the way with a $46 billion intake. Active US equity funds shed about $14 billion. Six of the nine categories in the group enjoyed inflows, including $1.2 billion to large-growth funds—their first monthly inflow since 2022.
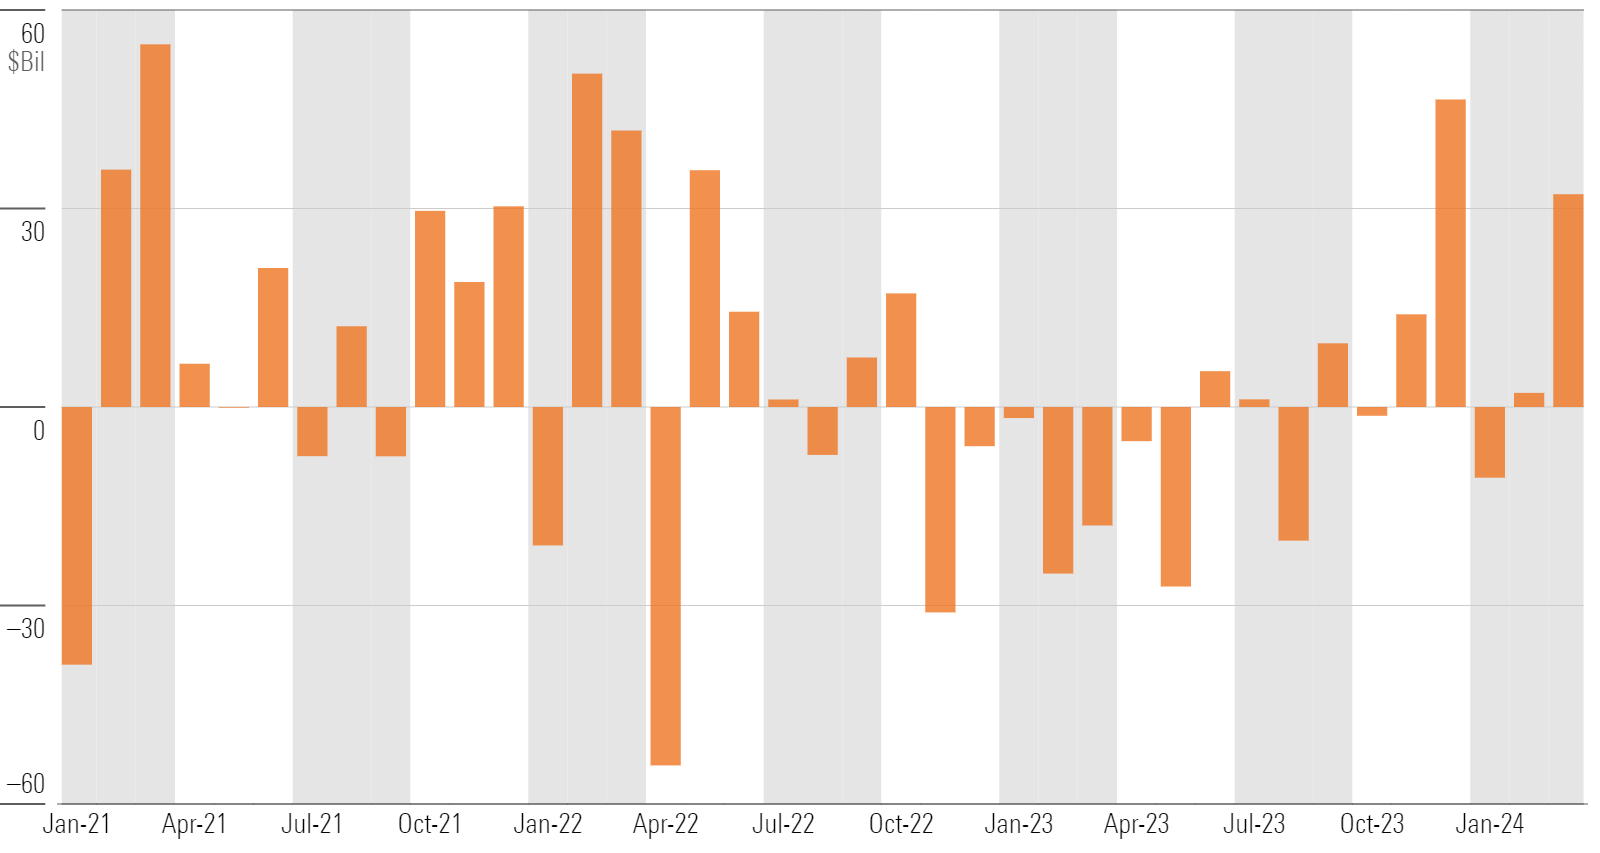
Taxable-Bond Funds Cap Off Stellar Quarter
Taxable-bond funds added $44 billion in March to push their first-quarter haul to $143 billion—their best since 2021′s fourth quarter. The intermediate core and intermediate core-plus bond categories led the way with about $73 billion in combined net flows. Short-term bond funds righted the ship with nearly $2 billion of inflows after their $62 billion exodus in 2023 hurt the broader cohort.
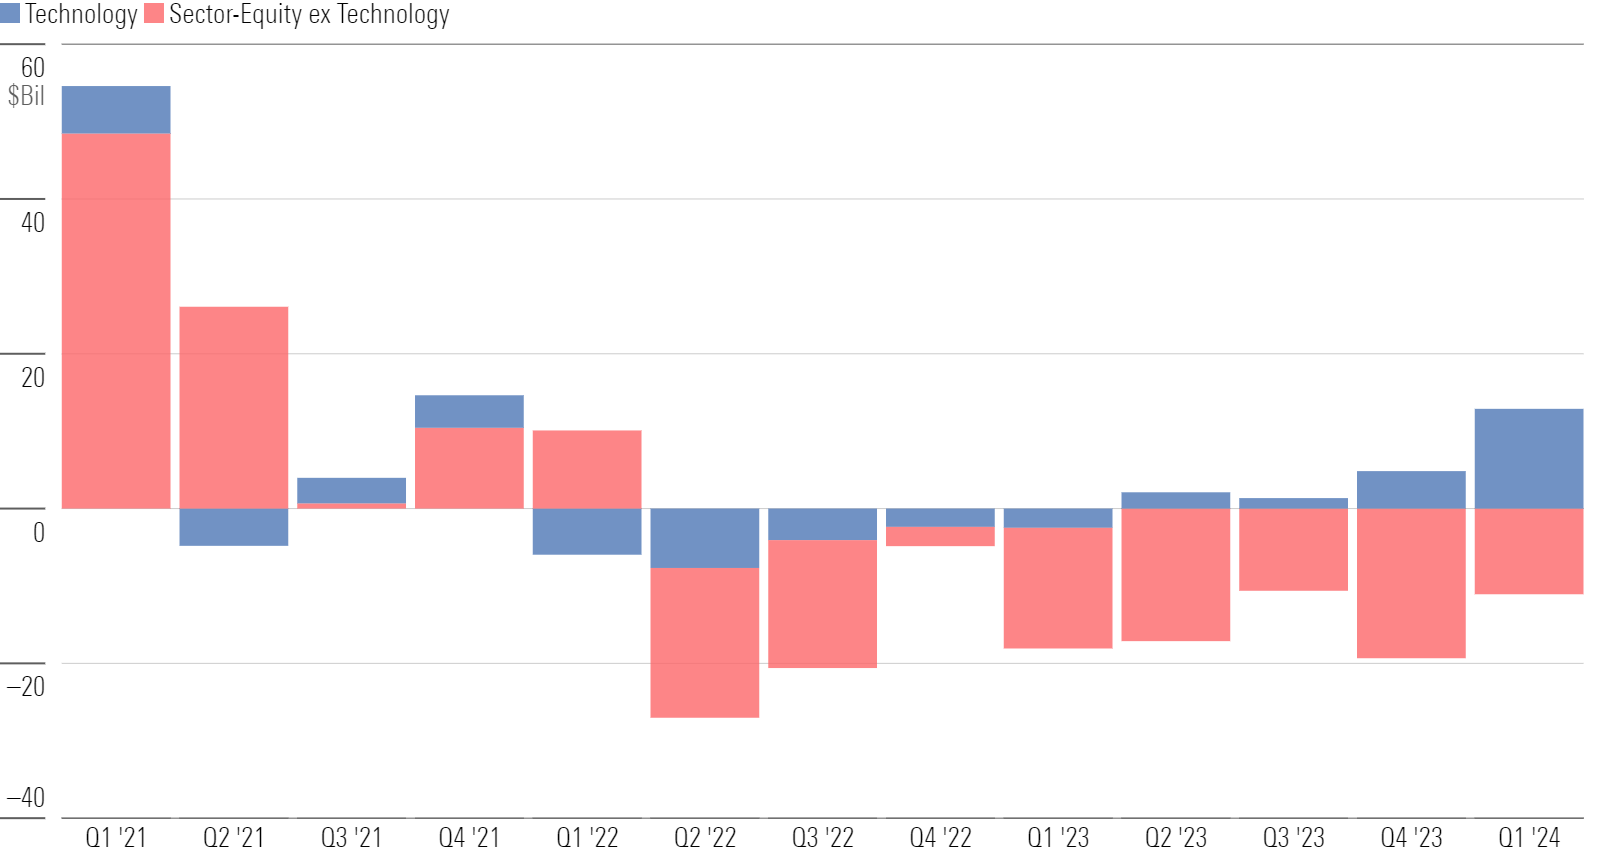
Tech Continues to Carry Sector-Equity Flows
It’s been a roller-coaster run for sector-equity funds. They enjoyed strong demand in 2020 and 2021 but then came crashing down to earth. The cohort suffered net outflows in seven consecutive quarters at one point, but that ended in 2024′s first quarter. Tech funds’ resurgence was a big reason why; they collected $4.3 billion in March and $12.9 billion in the first quarter.
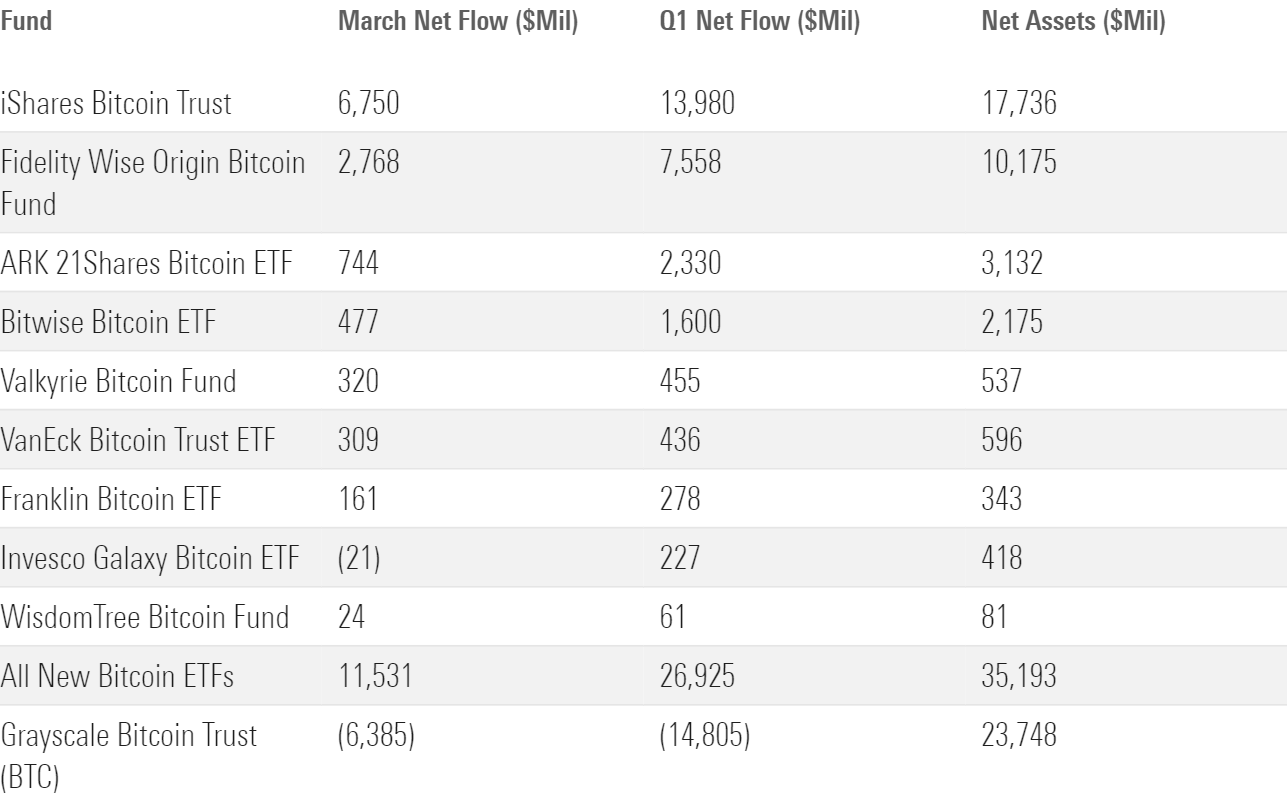
Bitcoin ETFs Show Staying Power
The “new nine” spot bitcoin ETFs have made a splash. Since launching in January, they raked in nearly $27 billion and swelled to $35 billion in assets. IShares’ offering represents about half of that, making it the early winner of the bitcoin ETF arms race. The loser? Grayscale Bitcoin Trust GBTC, the incumbent whose hold on the market evaporated when new competition went online.
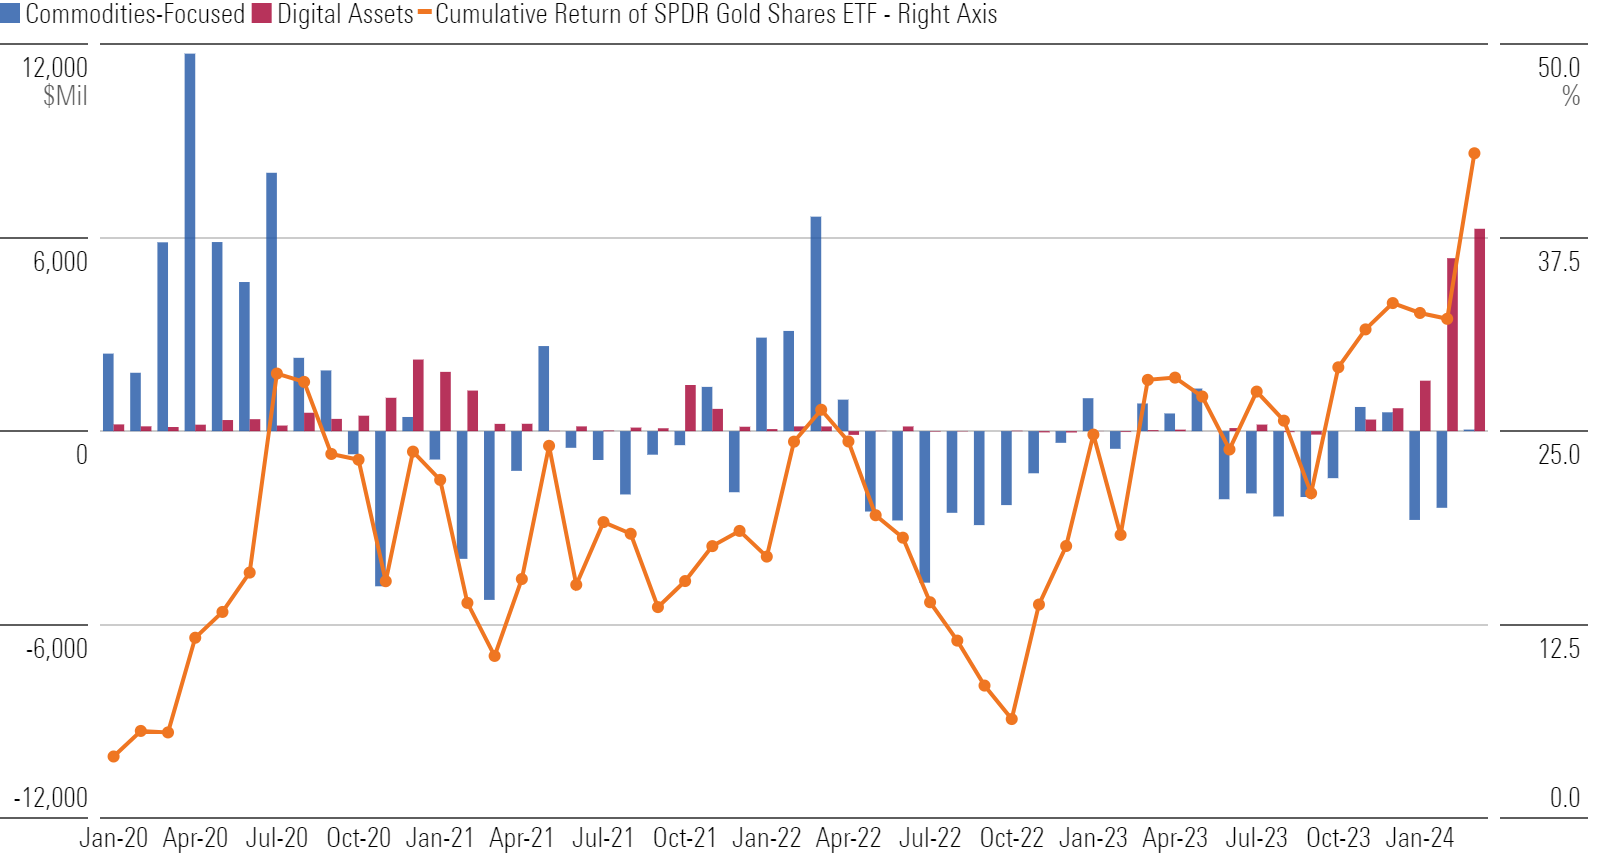
Digital Gold?
Fund flows into the commodities-focused category group, which houses precious-metals funds, typically ebb and flow along with the price of gold. However, the relationship has broken down since following the SEC’s approval of spot bitcoin ETFs in January 2024. The hype may have lured away traditional gold investors despite the metal hitting all-time highs.
This article is adapted from the Morningstar Direct US Asset Flows Commentary for March 2024. Download the full report here.


