

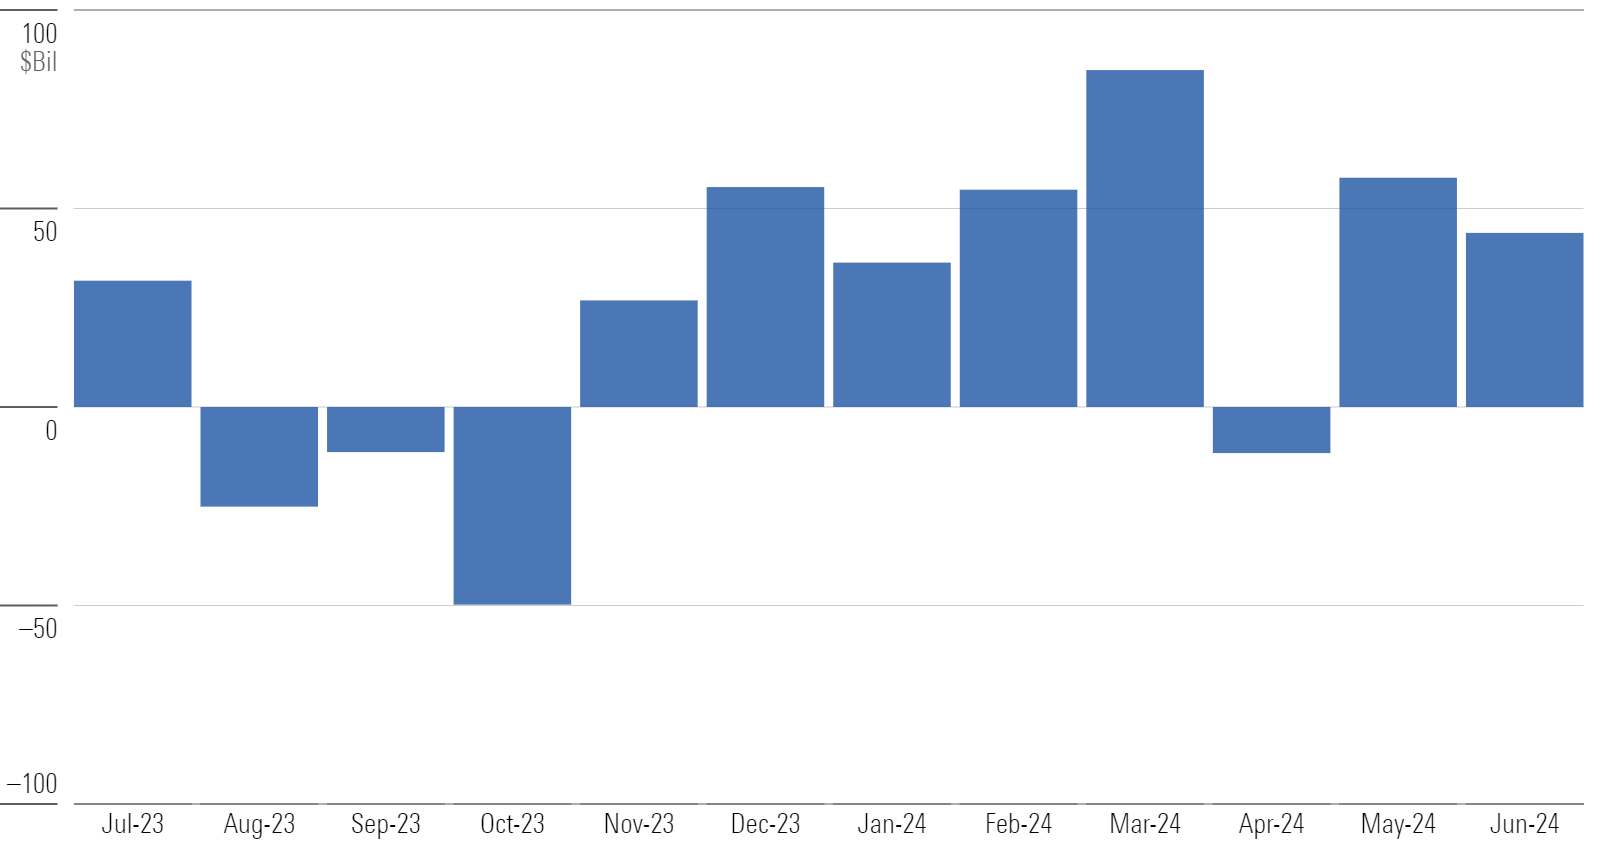
US funds gathered $44 billion in June 2024, a step back from May’s intake but in line with their trend of inflows, which began in November 2023. For the first half of 2024, US funds collected $266 billion, significantly stronger than the second half of 2023 when they netted only about $30 billion but much less than during 2020 and the first half of 2021.
2024 First-Half Flows Were About Average Despite Broad Dispersion
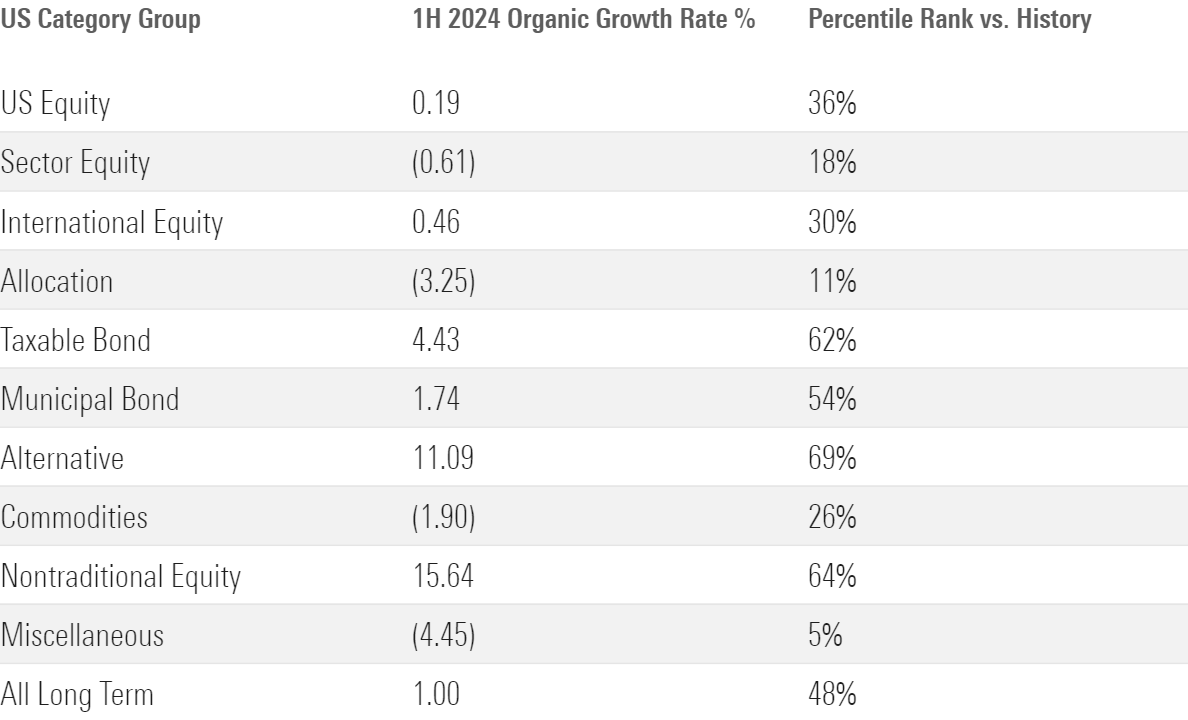
Total long-term flows had a 1% organic growth rate in the year’s first half, which is an average showing relative to history since Morningstar began collecting flow data in 1993. Some category groups fared better than others. Taxable-bond funds grew at a 4.4% rate, which is an above-average pace relative to history. Alternative and nontraditional equity funds also posted strong results. Conversely, the equity category groups had subpar showings.
Active Bond Funds Strike Back in 2024; Equity Funds Don’t
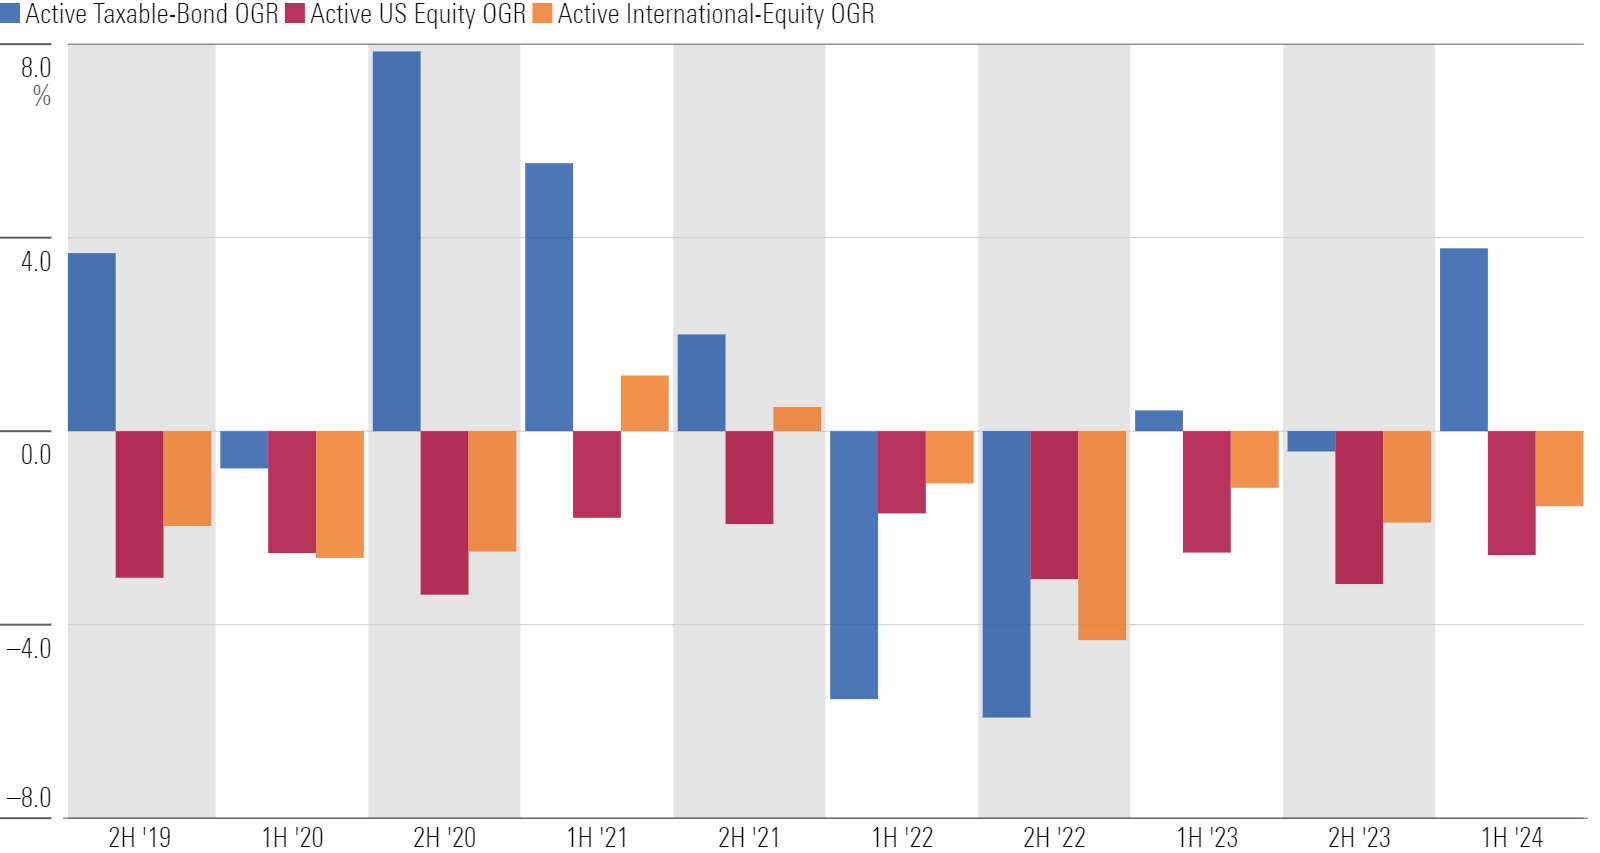
Actively managed funds had a tough time in 2022 and 2023, but signs of life emerged in the first half of 2024—at least for bond funds. Active bond fund inflows amounted to nearly 4% of year-end 2023 assets. They hadn’t reached that mark since the first half of 2021. Active equity funds continue to shed assets, however.
Taxable-Bond Funds Pave the Way in the First Half
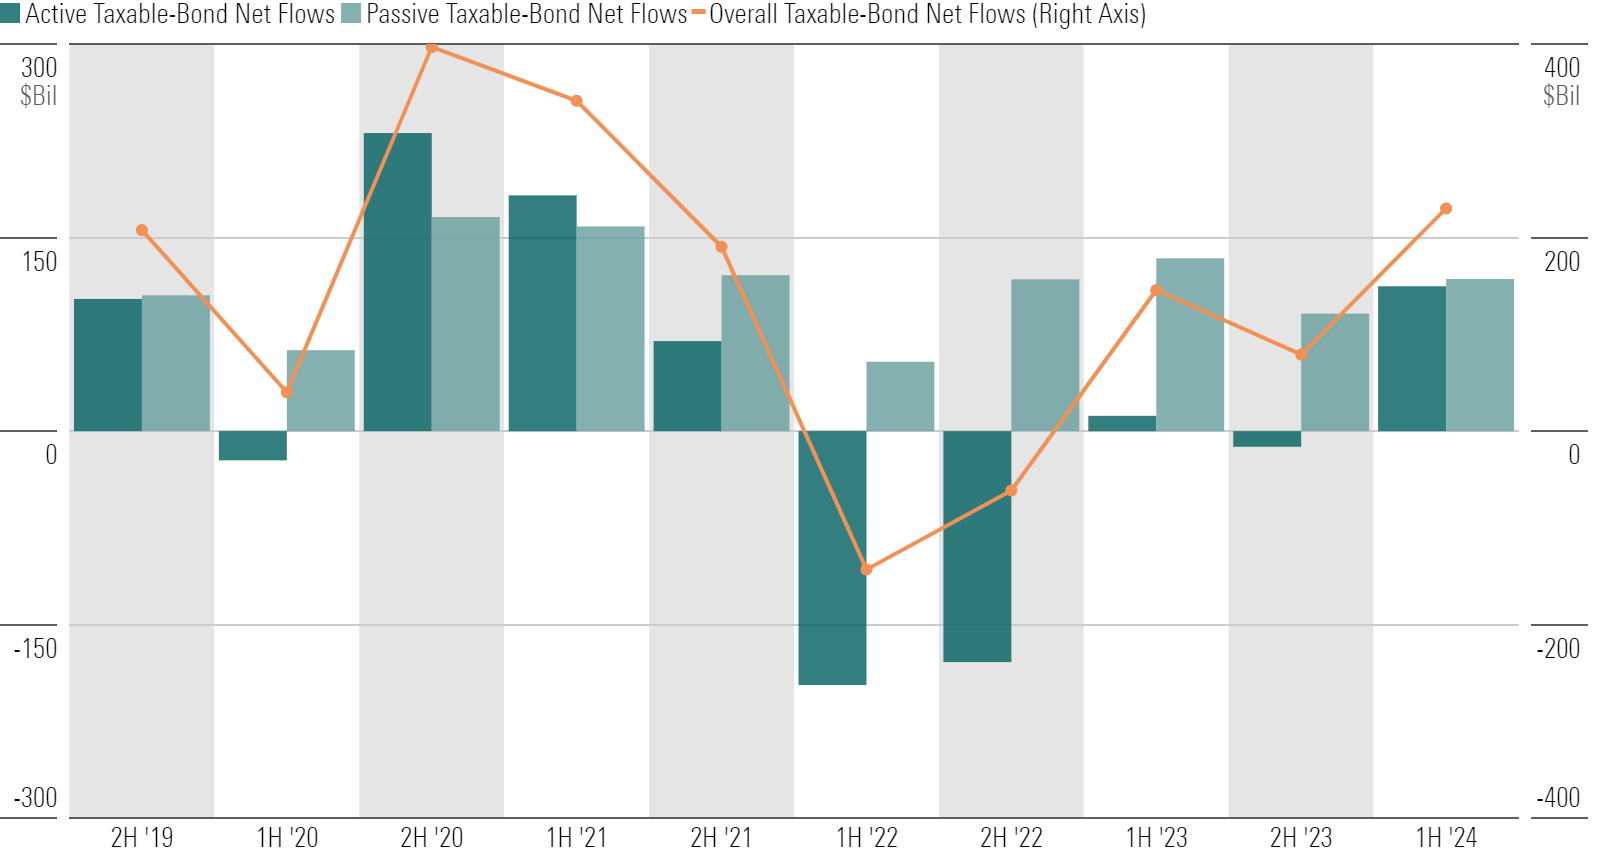
Taxable-bond funds raked in $230 billion in the first half of 2024. That represented nearly 87% of all US fund flows. Bond index funds held steady with a fresh $118 billion of first-half inflows. But the $112 billion that rushed into active funds—whose flows have been far more variable—powered the taxable-bond cohort to its best semiannual stretch since the first half of 2021.
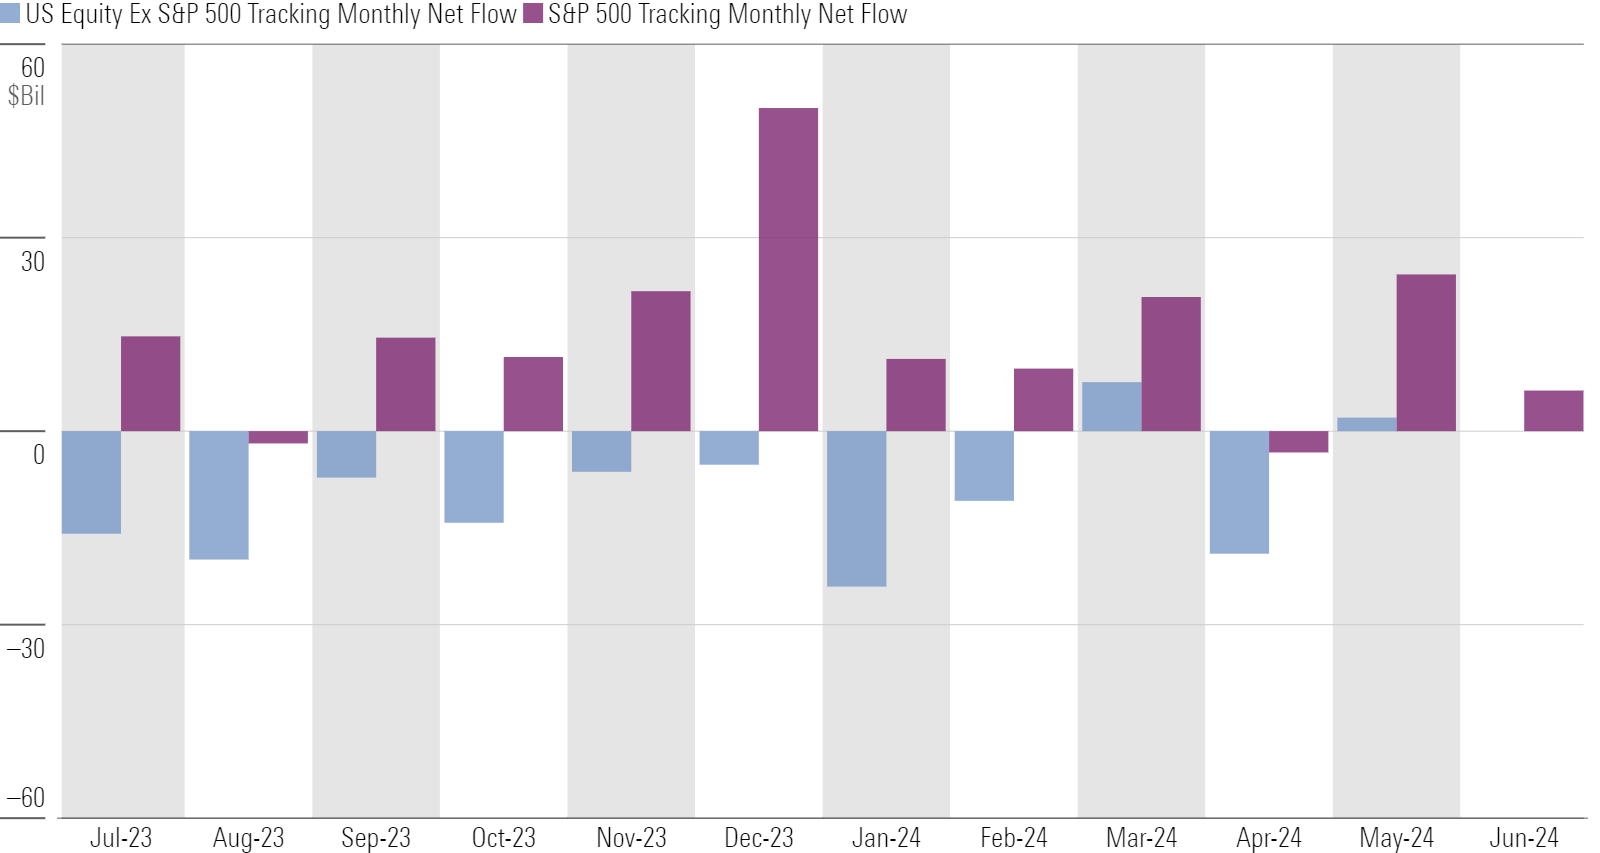
S&P 500 Trackers Are Still the Stars
While US equity funds gathered a relatively low sum in the first half of 2024 relative to their huge asset base, S&P 500-tracking funds continued to do well. Indeed, investors seem to plow dollars into these vehicles in both good times and bad. Over the past three years, they suffered outflows in just seven months. S&P 500 trackers took in $69 billion during the first half of 2024, while all other US equity funds collectively shed roughly $44 billion.
Buying the Rally in Growth Stocks
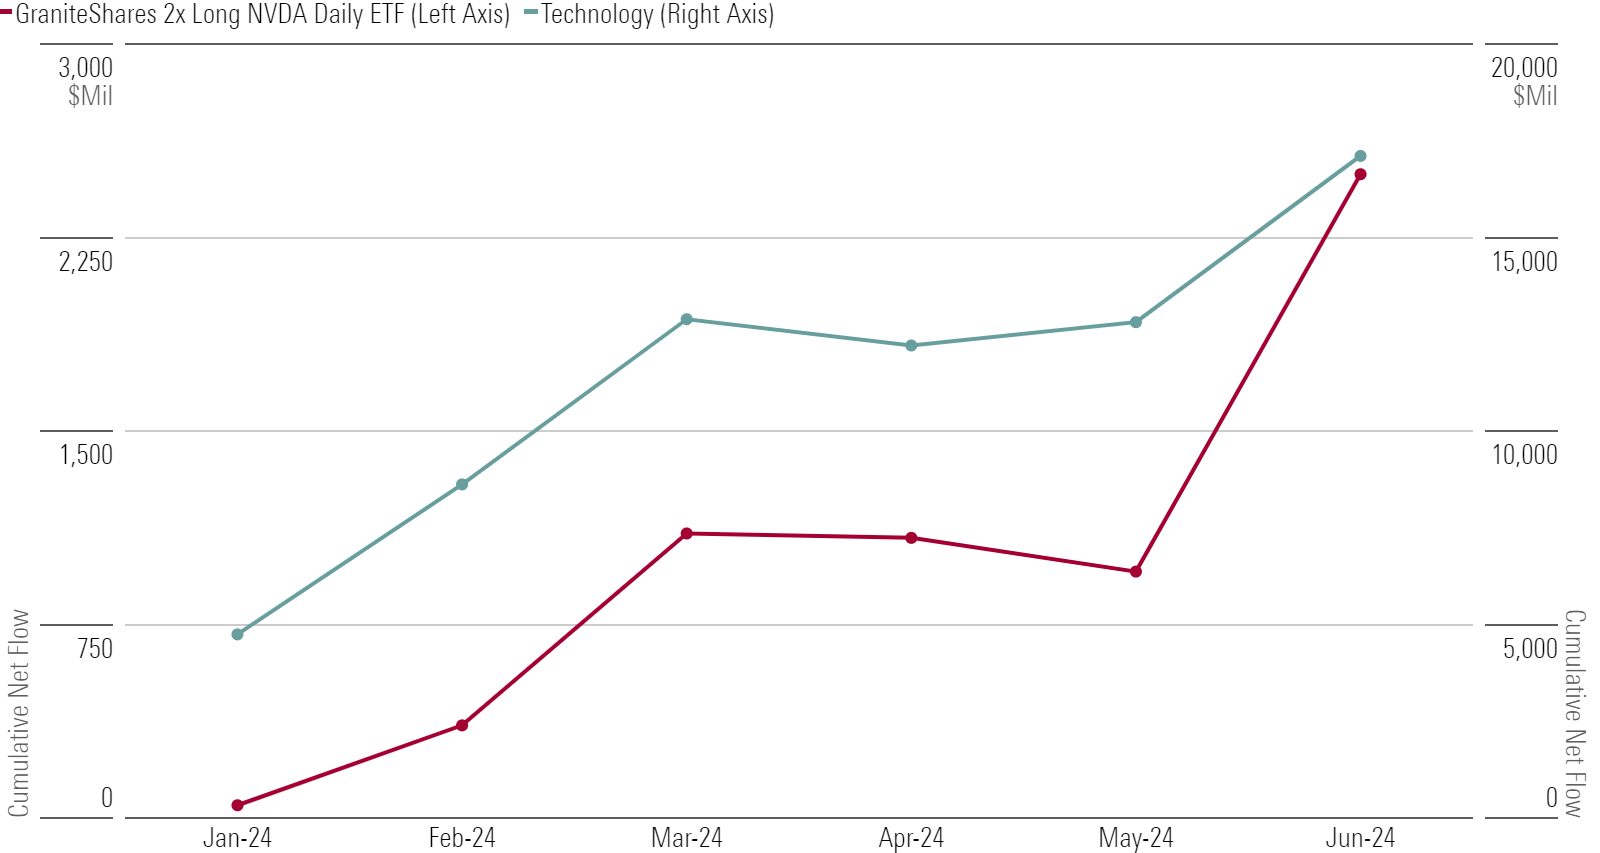
With mega-cap tech stocks outshining the rest of the US market, investors have gravitated toward funds featuring these companies. Technology funds raked in over $17 billion in the first half of 2024—equivalent to an organic growth rate better than anything since 2020′s first half. Large-growth funds, which have seen outflows for years, enjoyed inflows in both May and June. Certain leveraged single-stock exchange-traded funds have also taken in huge sums.
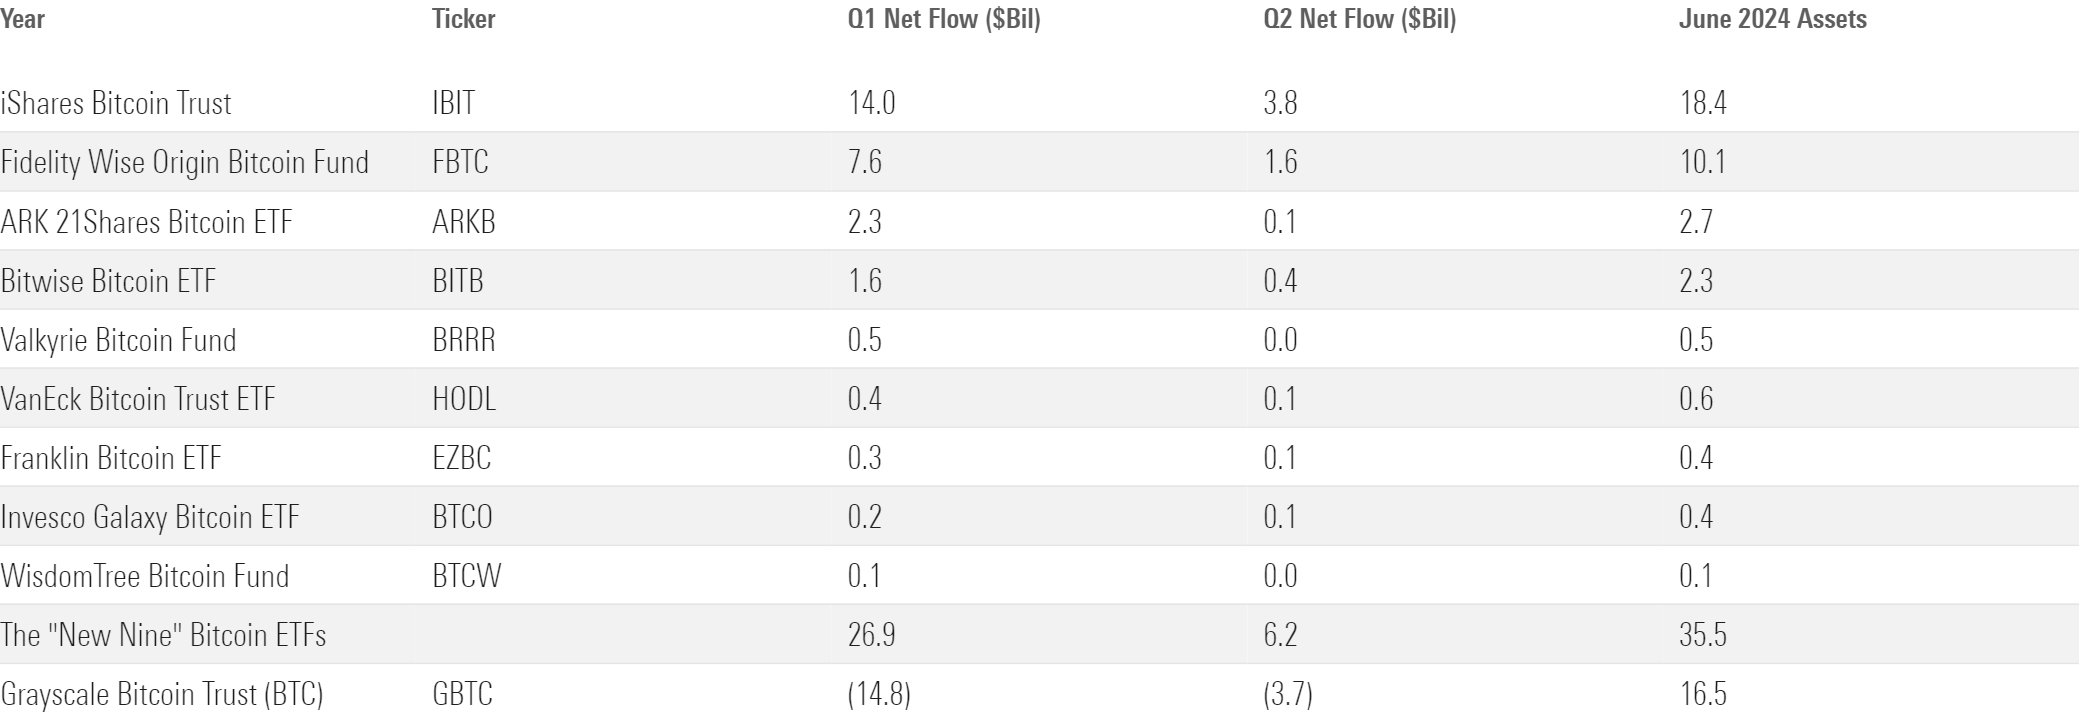
Bitcoin ETFs Tap the Brakes in the Second Quarter
The “new nine” spot bitcoin ETFs debuted in January 2024 to immense demand. That came at the expense of Grayscale Bitcoin Trust ETF GBTC, the incumbent whose monopoly evaporated overnight. The new ETFs hauled in almost $27 billion in the first quarter. The $6 billion they collected in the second quarter was nothing to sneeze at, but it signaled that the dust started to settle.
This article is adapted from the Morningstar Direct US Asset Flows Commentary for June 2024. Download the full report here.


