
New Kids on the BRICS: What the Bloc’s Expansion Means for the Global Geopolitical and Economic Landscape

The BRICS nations are coming of age.
At its annual summit in Johannesburg this week, the bloc of five emerging countries—Brazil, Russia, India, China and South Africa—announced plans to expand for the first time since 2010. On January 1, 2024, the BRICS will welcome six new members: Saudi Arabia, Argentina, Egypt, Ethiopia, Iran and the United Arab Emirates (UAE).

The expansion will further establish the group as a counterbalance to the G7’s global influence, catapulting BRICS’ share of global GDP to 36% as well as covering nearly half of the world’s population.
With dozens more nations expressing interest in joining the bloc, the BRICS are clearly positioning themselves for a multipolar world, one that is not dominated by the U.S. and other members of the West.
I expect the BRICS’ rise to create both opportunities and challenges for investors. Understanding the geopolitical, economic and regulatory landscape will be critical for navigating this environment successfully.
The Dollar’s Dominance Challenged
Perhaps most notably, Russian President Vladimir Putin—speaking remotely due to an International Criminal Court (ICC) arrest warrant for alleged war crimes—discussed the BRICS’ push to conduct trade in local currencies instead of the U.S. dollar, a move that would significantly reconfigure global trade dynamics.
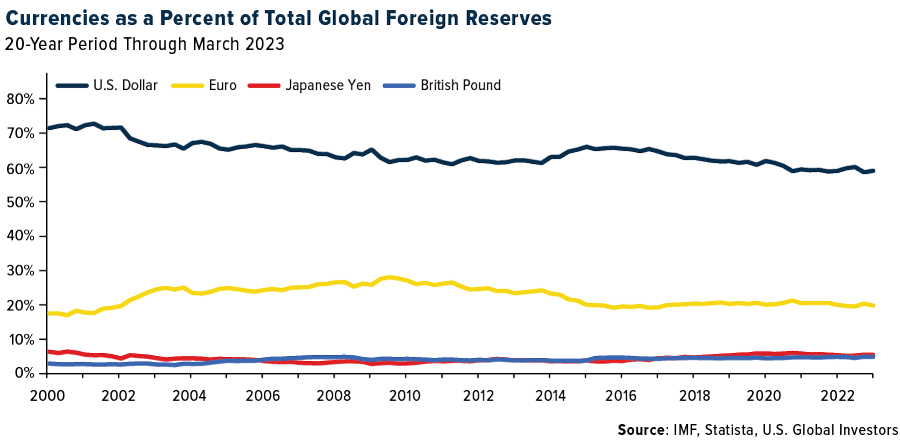
Since the Bretton Woods Conference in 1944, the dollar’s status as the world’s primary reserve currency has offered the U.S. tremendous benefits such as cheaper financing and unparalleled leverage in the form of financial sanctions. But now, with BRICS nations seeking an alternative to the greenback (and growing their ranks from five members to 11), the currency landscape may see a new major tectonic shift, contributing to greater volatility in the Treasury market, exchange rates, inflation and more.
At the heart of this strategy lies the New Development Bank (NDB).
Established in 2015 as an alternative to Western lenders such as the World Bank and International Monetary Fund (IMF), the NDB has been making waves. Its recent decision to release an Indian rupee bond and to consider local currency bonds in other countries reflects its intent to diversify away from the dollar.
Former Brazilian leader and NDB’s current president, Dilma Rousseff, shared the bank’s ambitious plans to lend between $8 billion and $10 billion this year, with approximately 30% of the lending in local currencies. The U.S.-based financial system is “going to be substituted by a more multipolar system,” Rousseff told the Financial Times.
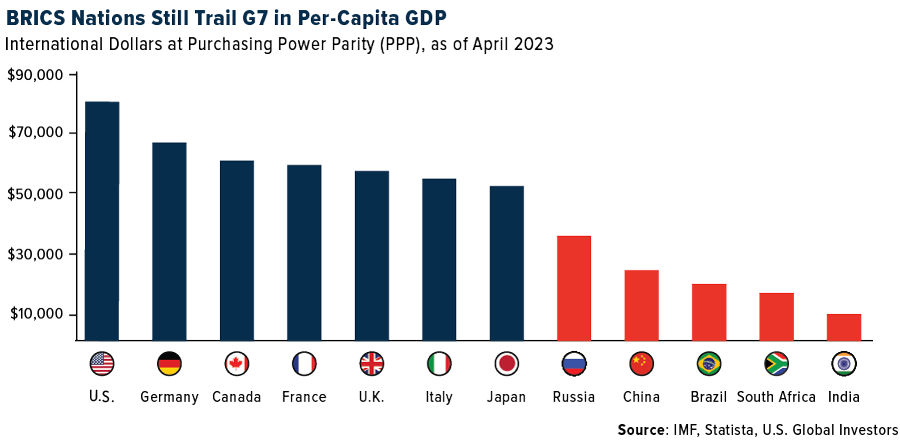
My own opinion is that the U.S. dollar will not be completely dethroned as a reserve currency, though we may end up seeing it share the stage more prominently with the euro, Chinese yuan, Bitcoin or some other currency. In their current roster, the BRICS represent over 32% of the world’s GDP, which is slightly more than the G7’s 30%; however, GDP per capita, an indicator of economic prosperity, remains a gap that the BRICS must bridge.
As the BRICS nations evolve and expand their influence, a more diversified global governance is inevitable. The current trajectory promises a world where traditional powerhouses, including the U.S. and European Union (EU), must adapt to new realities.
As an investor and an observer, staying nimble will be paramount.
The Impact of Rising U.S. Treasury Yields
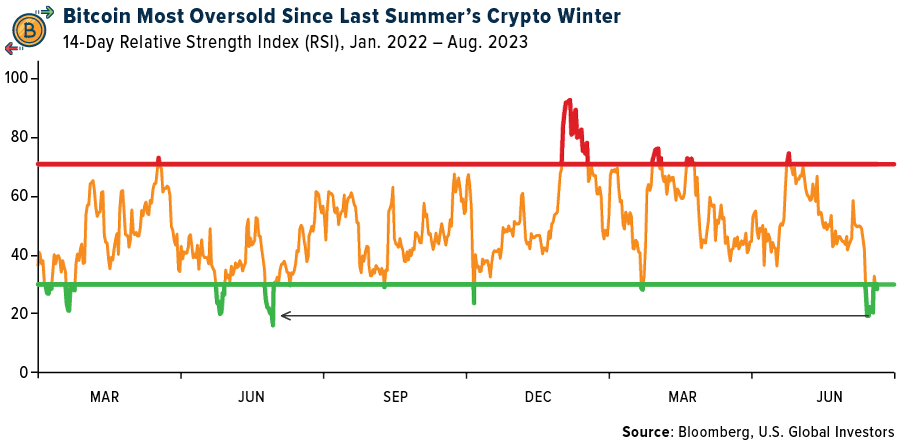
Also shaping the market right now are rising U.S. Treasury yields. As these yields surge due to stronger-than-expected economic growth and the Federal Reserve’s tightening policies, risk-on assets, from stocks to Bitcoin, are feeling the heat. Over the past 30 days, the 10-year Treasury yield has risen some 9.4% while the S&P 500 and Bitcoin have lost 3.5% and 10.8%, respectively. Bitcoin, in fact, has fallen into the most extreme oversold territory since last summer’s crypto winter, triggered by the failures of crypto firms Celsius, Three Arrows Capital and Voyager.
With Jerome Powell asserting today at the Jackson Hole summit that it may be appropriate to hike rates further to combat inflation, investor focus could be shifting toward sectors less reliant on borrowing, like utilities and consumer staples. Still, many remain optimistic about the resilience of equities, especially in the context of a robust U.S. economy.
The standout exception to struggling equities, of course, has been artificial intelligence (AI) stocks in general and NVIDIA specifically. For the 12-month, year-to-date, three-month and five-day periods, the Santa Clara-based graphics processing unit (GPU) maker remains the top-performing S&P 500 stock by far as investors scramble to get exposure to companies involved in AI.
Gold’s Enduring Luster
In the midst of all this, gold continues its role as a stable store of value. Despite challenges like rising yields, my sentiment around gold remains bullish. Its current trading levels, though down from their peak, still indicate strong investor interest.
I’m also bullish on gold mining stocks, though I must urge investors to focus on high-quality, well-managed companies with strong balance sheets.
One of our favorite metrics when picking gold mining stocks is free cash flow (FCF) yield, which tells you how much free cash flow a company has relative to its market capitalization. Because explorers and producers have high operational costs and capital-intensive requirements, it’s important that they maintain healthy balance sheets.
Last month, I shared with you the top 10 gold mining stocks ranked by FCF yield, using data from the March quarter. In the chart below, I’ve updated the list for the quarter ended June 30.
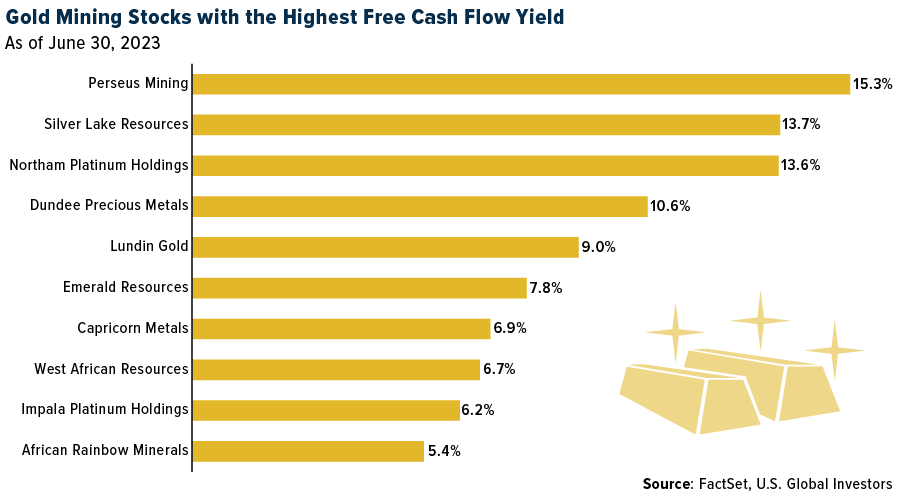
Leading the pack with a FCF yield of 15.3% is Australia-based Perseus Mining, which operates three gold mines in Africa. The company reported a strong June quarter in terms of cash generation, with a net increase of $51 million in its overall cash position, taking into account cash, bullion and interest-bearing debt. At quarter-end, Perseus held $484 million in cash and physical gold, against a market cap of approximately $1.5 billion.
Watch our video on six incredible uses of gold—click here!

Index Summary
- The major market indices finished up/down/mixed/flat this week. The Dow Jones Industrial Average gained/lost x%. The S&P 500 Stock Index rose/fell x%, while the Nasdaq Composite climbed/fell x%. The Russell 2000 small capitalization index gained/lost x% this week.
- The Hang Seng Composite gained/lost x% this week; while Taiwan was up/down x% and the KOSPI rose/fell x%.
- The 10-year Treasury bond yield rose/fell x basis points to x%.
Airlines and Shipping
Strengths
- The best performing airline stock for the week was xxxx, up xx.x%. Chinese domestic travel continues its strong momentum with total spending on domestic air tickets remaining at 30% above 2019 levels in the first half of August. Japan summer demand remains strong although some of the Obon peak demand has been impacted by typhoon disruptions. Indian air travel has rebounded to above 2019 levels in recent weeks following a dip in July and early August. For long-haul flights, the summer peak demand has arrived with Taiwanese airlines seeing yields an average 30% above 2019.
- Despite the high 2021-2022 base, there may be further headroom to the current de-carbonization shipbuilding upcycle. In particular, demand for mid-sized dual-fuel (DF) containerships and tankers are expected to remain healthy in the second half of 2023, and 2024, while recent tightening of IMO regulations to drive fleet replacement for dry bulk carriers near mid-2025. Moreover, the tight demand-supply dynamics have continued to drive an ascent in newbuild price index.
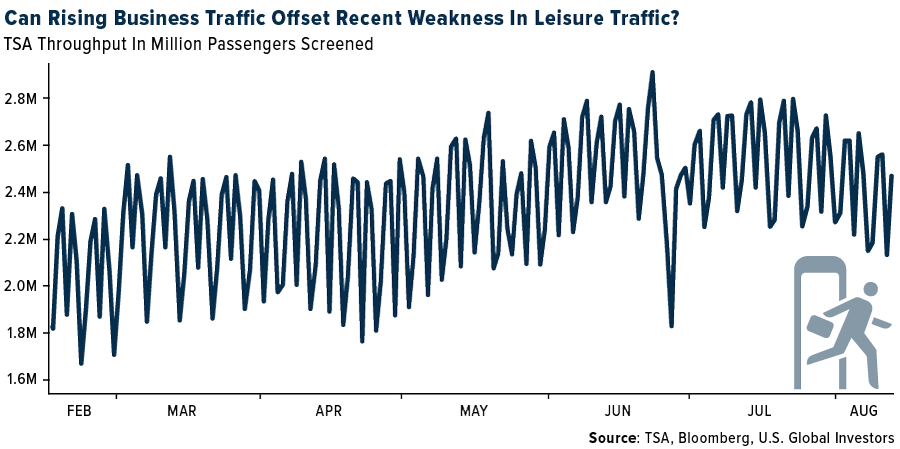
- The global business travel industry has rebounded at a more accelerated rate than year-ago expectations. It is now expected to surpass its pre-pandemic spending level of $1.43 trillion in 2024 and to grow to $1.782 trillion by 2027. The forecast for 2023 is for $1.357 trillion in spend, up 32.1% year-over-year, versus last year’s forecast of $1.158 trillion. For context, in 2020 and 2021 during the depths of the pandemic, global business travel spend was $661MM and $697MM, respectively, and rebounded to $1.027 trillion in 2022.
Weaknesses
- The worst performing airline stock for the week was xxxx, down xx.x%. Regarding the Pratt and Whitney jet engine issue, the FAA estimates 20 engines are affected on U.S.-registered aircraft only. Pratt’s August 4 service bulletin has instructed operators to remove affected engines for inspection by September 15 and RTX has indicated that 200 engines meet these criteria; therefore, the 20 engines referenced are the U.S. portion of this 200. Among U.S. operators, Spirit Airlines said that it has 13 of the 200 engines with potentially four more at JetBlue and so these would comprise most of the 20.
- Orient Overseas management believes demand weakness has played a more important role versus supply increase in the year-to-date market weakness. Management also mentioned that recent transpacific rate hikes do not represent a turnaround of the cycle. Management believes the shipping rate will remain soft unless demand becomes stronger. Profitable routes will attract extra capacity and drive down rates.
- Morgan Stanley believes the ongoing negotiations with Allegiant’s pilots could prove to be a meaningful cost headwind (especially with the Legacy’s recently announced contracts) and uncertainties surrounding the Sunseeker resort will remain until we see tangible execution. In fact, management announced last week that the opening of the Sunseeker Resort will now be delayed until later in the fourth quarter due to “unavoidable delays attributable to the lasting effects of Hurricane Ian.”
Opportunities
- Business travelers noted they are more frequently blending business and personal travel versus 2019 with 42% adding additional leisure days to their business trips. This is similar to comments heard from the airlines noting a shift in corporate travel coming out of the pandemic with an increase in “bliesure” trips.
- South Korean newspaper Dong-a Ilbo reported that Hapag-Lloyd is weighing a bid for the 38.9% stake in South Korean carrier HMM that the Korean Development Bank and the Korean Ocean Business Corporation want to sell. A combined Hapag-Lloyd and HMM would cement Hapag-Lloyd’s position as the No. 5 of the market but it is unlikely that Hapag-Lloyd, if they chose to bid for HMM, would end up winning the bidding war as the South Korean government prefers a South Korean owner for HMM. In the unlikely event of a Hapag-Lloyd and HMM tie up, Hapag-Lloyd would increase its focus on the Far East and Transpacific trade lanes and the ever-increasing consolidation in the shipping industry would enhance capacity discipline and support prices.
- Earlier this month, the U.S. Department of Transportation announced an increase in the number of Chinese passenger flights allowed to fly to the U.S. Beginning September 1, weekly roundtrips will increase to 18, increasing again to 24 per week by October 29.
Threats
- According to Goldman, for JetBlue, the main takeaway is that 2024 growth will likely be more muted compared to the company’s long-term goal of mid-to-high-single digit annual capacity growth. While capacity cuts in New York will be backfilled with new market additions, JetBlue’s fleet growth will likely fall short of its initial plan given ongoing delivery delays at Airbus which could be further exacerbated by the latest GTF issues.
- According to Bank of America, Japanese shipping continues to defy gravity with valuations near 0.8x book [trading range of 0.4-0.8] after 71% year-to-date performance. The bank is not convinced the worst is over with downside to both container and car carrier earnings ahead as supply pressures build.
- According to Cowen, the changes in its American Airlines model reflect an additional $1.0 billion in benefits the pilots are receiving following a review of United Airlines pilots’ contract. The new contract provides wage increases, snap-up provisions and quality of life benefits the pilots have been requesting for the past few years.
Luxury Goods and International Markets

Energy and Natural Resources
Strengths
- The best performing commodity for the week was the active iron ore futures contract, rising 6.XX%. Iron ore rose for a fourth day on signs that demand from Chinese steel mills may be improving ahead of an expected pick-up in construction in September and October. The steel-making staple has rallied around 10% since last Wednesday’s close as sentiment improved due to the absence of government directives to cut steel production and as the post-summer ramp-up in building approaches. That is offsetting a worsening economic outlook in China.
- Europe’s Big Oils will return over $80 billion of cash to shareholders in 2023 – representing an 11.5% total cash yield on their aggregate market cap. The resilience of these shareholder distributions epitomizes one of the sector’s key signposts.
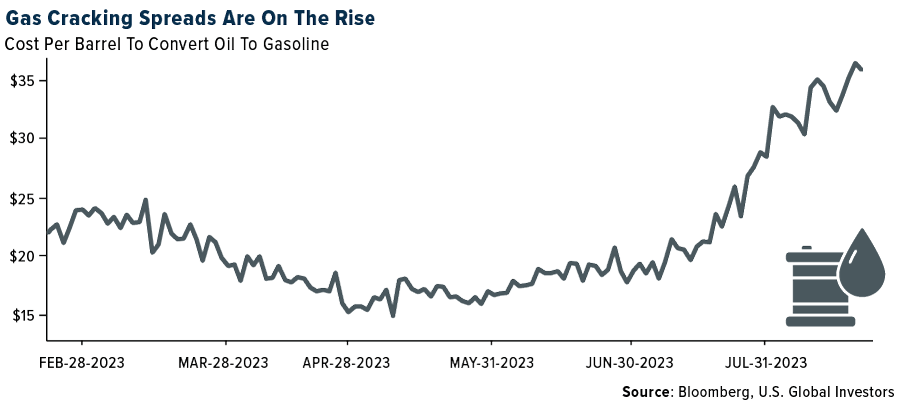
- According to UBS, Nymex diesel crack, which bottomed on April 28, has rebounded very strongly and is up 123% to $51.6/bbl. Nymex Gasoline crack, which also bottomed late April, has since moved up 25% to $37/bbl. RIN adjusted cracks in all regions (GC, Mid-Con, East Coast and West Coast) are all up $5/bbl. UBS expects delays in start-up of global refining capacity and shortages of products to keep cracks well above mid-cycle levels. Based on where the cracks are the group also sees potential upside to consensus numbers for the second half of this year and 2024.
Weaknesses
- seasonal slowness and economic concerns continue to weigh on spot market sentiment. Over the past month, spodumene prices have been more resilient relative to LCE prices, resulting in a 60% collapse in Chinese conversion margins.
- According to Baker Hughes, the U.S. rig count decreased by 12 this week to 642. The land rig count decreased by 11 to 625 and the offshore rig count decreased by one to 17. Per Baker Hughes data, the oil rig count decreased by five while the gas rig count decreased by six and miscellaneous rigs decreased by one.
- In July, China’s coal production reached 378M tons, with daily average of 12.2M tons, marking a 6% month-over-month decline. This was below the NDRC’s target of 12.6M tons per day and represents the lowest level seen since October 2022. The reduction in coal production stems from disruptions caused by increased safety inspections and heavy rainfall, which have adversely impacted mining operations.
Opportunities
- Sentiment on nuclear continues to improve. Increasingly positive public opinion and growing policy support means plans for new nuclear, as well as preservation and restarts of existing nuclear fleets, are likely becoming more achievable. In recent years this change has been largely driven by increased focus on ESG, with nuclear power’s low carbon electricity generation a key strength; however, since the war in Ukraine, energy security has added a boost to sentiment.
- European natural gas advanced as workers serving a key export project in Australia prepare for a strike that could significantly dent global supplies in the run-up to winter. Disruptions risk impacting 10% of the world’s liquefied natural gas exports, a prospect that is keeping traders in Europe on edge. The region is still recovering from last year’s energy crisis, when Russian supply cuts left it highly exposed to shifts in the tight global market.
- Base metals climbed amid a broad rally in risk assets as traders eyed China’s battle to support its currency. Copper, aluminum, and zinc all gained on Tuesday, extending rallies seen in the previous session. The metals tracked rising global equity markets and received support from the weakening dollar. Investors are focusing on China’s battle to support the yuan, which is suffering due to the country’s ailing economic growth. A stronger local currency supports metals importers in the world’s top consumer by granting them greater purchasing power.
Threats
- China’s ongoing production ramp-up and import hikes have more than offset strong domestic consumption growth, resulting in a coal oversupply and significant restocking in China. Going forward, China’s coal production ramp-up could continue offsetting its strong coal consumption growth, posing a downside risk to China’s coal imports and, as a result, a significant bearish risk for the global market.
- North American E&P consensus capex forecasts are showing early signs of softening, but international operator capex expectations have moved broadly sideways year-to-date. 2024 capex forecasts for a sample of 12 North American E&Ps was flat/slightly up in the first half of this year but started to tail-off through second quarter earnings season, pulling back 2% over that period. This trend should have materialized earlier given that U.S. land rig counts are down nearly 20% year-to-date, and shale service company pricing commentary has indicated ~flat pricing at best.
- According to BMO, given the currently uncertain September scrap outlook, some easing in demand, and imports trending higher, spot HRC prices have more downside risk in the group’s opinion. However, BMO’s view remains that slowly expanding lead times, planned maintenance outages in September, and still lean service center inventories should offer some offset, absent automotive workers strike, which in their view would have a meaningful impact on the sheet market as direct shipments from mills to the auto OEMs accounted for 15% of total in 2022.
Bitcoin and Digital Assets
Strengths
- Of the cryptocurrencies tracked by CoinMarketCap, the best performer for the week was BONE, rising 18.50%.
- JPMorgan is seeing “limited downside” for Bitcoin after its recent rout. The current selloff in crypto markets is likely near an end, the bank reasons, with long-position liquidations “largely behind us,” writes Bloomberg.
- Dubai-based crypto exchange BitOasis raised a round of fundings led by Indian digital-asset platform CoinDCX. Terms of the deal and valuation weren’t disclosed, writes Bloomberg.
Weaknesses
- Of the cryptocurrencies tracked by CoinMarketCap, the worst performer for the week was PEPE, down 16.81%.
- Israeli police have accused businessman Moshe Hogeg and his partners of defrauding investors of $290 million in a cryptocurrency scam. This comes after a two-year investigation into the former owner of an Israeli Premier League soccer team, writes Bloomberg.
- A former employee at the NFT marketplace OpenSea was ordered to spend three months behind bars after being convicted in the first-ever insider-trading case involving digital assets, writes Bloomberg.
Opportunities
- Coinbase Global is sweetening its offer to buy back debt after investors agreed to tender a third of the bonds the company was seeking. It increased its compensation for the bonds to 67.5 cents on the dollar up from the 64.5 cents it was offering when it announced the tender on August 7, writes Bloomberg.
- European crypto-related exchange traded products have seen a boost in flows after BlackRock applied to launch a bitcoin fund in the U.S., according to Bloomberg.
- Coinbase Global has taken a stake in stablecoin issuer Circle citing “growing regulatory clarity for stablecoins in the U.S.,” writes Bloomberg.
Threats
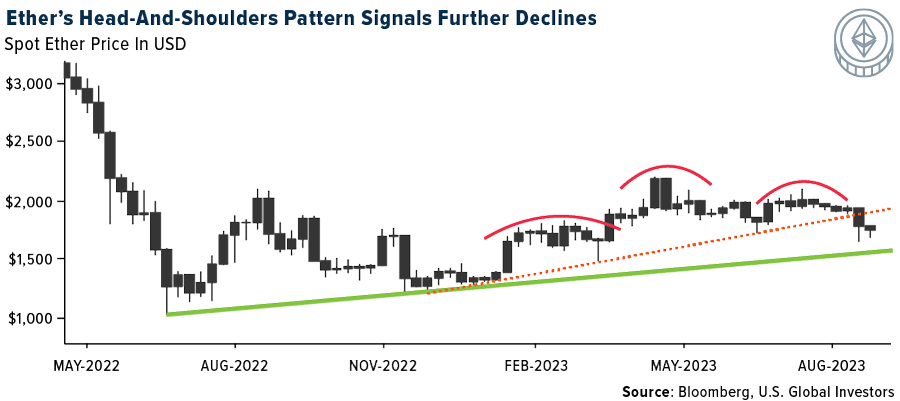
- This month’s crypto retreat may get worse if key charts for Ether prove prophetic. Ether has traced a head-and-shoulders price pattern, a technical study that signals further declines, writes Bloomberg.
- Crypto exchange Binance.US has faced a series of legal and financial challenges as regulators have increased their scrutiny of crypto companies of all kinds. For more than a month, customers of the crypto exchange have been unable to either deposit or withdraw dollars — a consequence of multiple banking partners cutting ties with the platform, writes Bloomberg.
- The U.S. Treasury Department sanctioned Roman Semenov for providing support to Tornado Cash and the Lazarus group. The sanctions were conducted in coordination with the Justice Department which unsealed an indictment against Semenov and who was arrested, according to Bloomberg.

Gold Market

U.S. Global Investors, Inc. is an investment adviser registered with the Securities and Exchange Commission (“SEC”). This does not mean that we are sponsored, recommended, or approved by the SEC, or that our abilities or qualifications in any respect have been passed upon by the SEC or any officer of the SEC.
This commentary should not be considered a solicitation or offering of any investment product. Certain materials in this commentary may contain dated information. The information provided was current at the time of publication. Some links above may be directed to third-party websites. U.S. Global Investors does not endorse all information supplied by these websites and is not responsible for their content. All opinions expressed and data provided are subject to change without notice. Some of these opinions may not be appropriate to every investor.
Holdings may change daily. Holdings are reported as of the most recent quarter-end. The following securities mentioned in the article were held by one or more accounts managed by U.S. Global Investors as of (06/30/2023):
*The above-mentioned indices are not total returns. These returns reflect simple appreciation only and do not reflect dividend reinvestment.
The Dow Jones Industrial Average is a price-weighted average of 30 blue chip stocks that are generally leaders in their industry. The S&P 500 Stock Index is a widely recognized capitalization-weighted index of 500 common stock prices in U.S. companies. The Nasdaq Composite Index is a capitalization-weighted index of all Nasdaq National Market and SmallCap stocks. The Russell 2000 Index® is a U.S. equity index measuring the performance of the 2,000 smallest companies in the Russell 3000®, a widely recognized small-cap index.
The Hang Seng Composite Index is a market capitalization-weighted index that comprises the top 200 companies listed on Stock Exchange of Hong Kong, based on average market cap for the 12 months. The Taiwan Stock Exchange Index is a capitalization-weighted index of all listed common shares traded on the Taiwan Stock Exchange. The Korea Stock Price Index is a capitalization-weighted index of all common shares and preferred shares on the Korean Stock Exchanges.
The Philadelphia Stock Exchange Gold and Silver Index (XAU) is a capitalization-weighted index that includes the leading companies involved in the mining of gold and silver. The U.S. Trade Weighted Dollar Index provides a general indication of the international value of the U.S. dollar. The S&P/TSX Canadian Gold Capped Sector Index is a modified capitalization-weighted index, whose equity weights are capped 25 percent and index constituents are derived from a subset stock pool of S&P/TSX Composite Index stocks. The NYSE Arca Gold Miners Index is a modified market capitalization weighted index comprised of publicly traded companies involved primarily in the mining for gold and silver. The S&P/TSX Venture Composite Index is a broad market indicator for the Canadian venture capital market. The index is market capitalization weighted and, at its inception, included 531 companies. A quarterly revision process is used to remove companies that comprise less than 0.05% of the weight of the index, and add companies whose weight, when included, will be greater than 0.05% of the index
The S&P 500 Energy Index is a capitalization-weighted index that tracks the companies in the energy sector as a subset of the S&P 500. The S&P 500 Materials Index is a capitalization-weighted index that tracks the companies in the material sector as a subset of the S&P 500. The S&P 500 Financials Index is a capitalization-weighted index. The index was developed with a base level of 10 for the 1941-43 base period. The S&P 500 Industrials Index is a Materials Index is a capitalization-weighted index that tracks the companies in the industrial sector as a subset of the S&P 500. The S&P 500 Consumer Discretionary Index is a capitalization-weighted index that tracks the companies in the consumer discretionary sector as a subset of the S&P 500. The S&P 500 Information Technology Index is a capitalization-weighted index that tracks the companies in the information technology sector as a subset of the S&P 500. The S&P 500 Consumer Staples Index is a Materials Index is a capitalization-weighted index that tracks the companies in the consumer staples sector as a subset of the S&P 500. The S&P 500 Utilities Index is a capitalization-weighted index that tracks the companies in the utilities sector as a subset of the S&P 500. The S&P 500 Healthcare Index is a capitalization-weighted index that tracks the companies in the healthcare sector as a subset of the S&P 500. The S&P 500 Telecom Index is a Materials Index is a capitalization-weighted index that tracks the companies in the telecom sector as a subset of the S&P 500.
The Consumer Price Index (CPI) is one of the most widely recognized price measures for tracking the price of a market basket of goods and services purchased by individuals. The weights of components are based on consumer spending patterns. The Purchasing Manager’s Index is an indicator of the economic health of the manufacturing sector. The PMI index is based on five major indicators: new orders, inventory levels, production, supplier deliveries and the employment environment. Gross domestic product (GDP) is the monetary value of all the finished goods and services produced within a country’s borders in a specific time period, though GDP is usually calculated on an annual basis. It includes all private and public consumption, government outlays, investments and exports less imports that occur within a defined territory.
The S&P Global Luxury Index is comprised of 80 of the largest publicly traded companies engaged in the production or distribution of luxury goods or the provision of luxury services that meet specific investibility requirements.


