

US mutual funds and exchange-traded funds hauled in $59 billion in February 2024, their highest monthly total in more than two years.
Taxable-Bond Funds Stay Hot
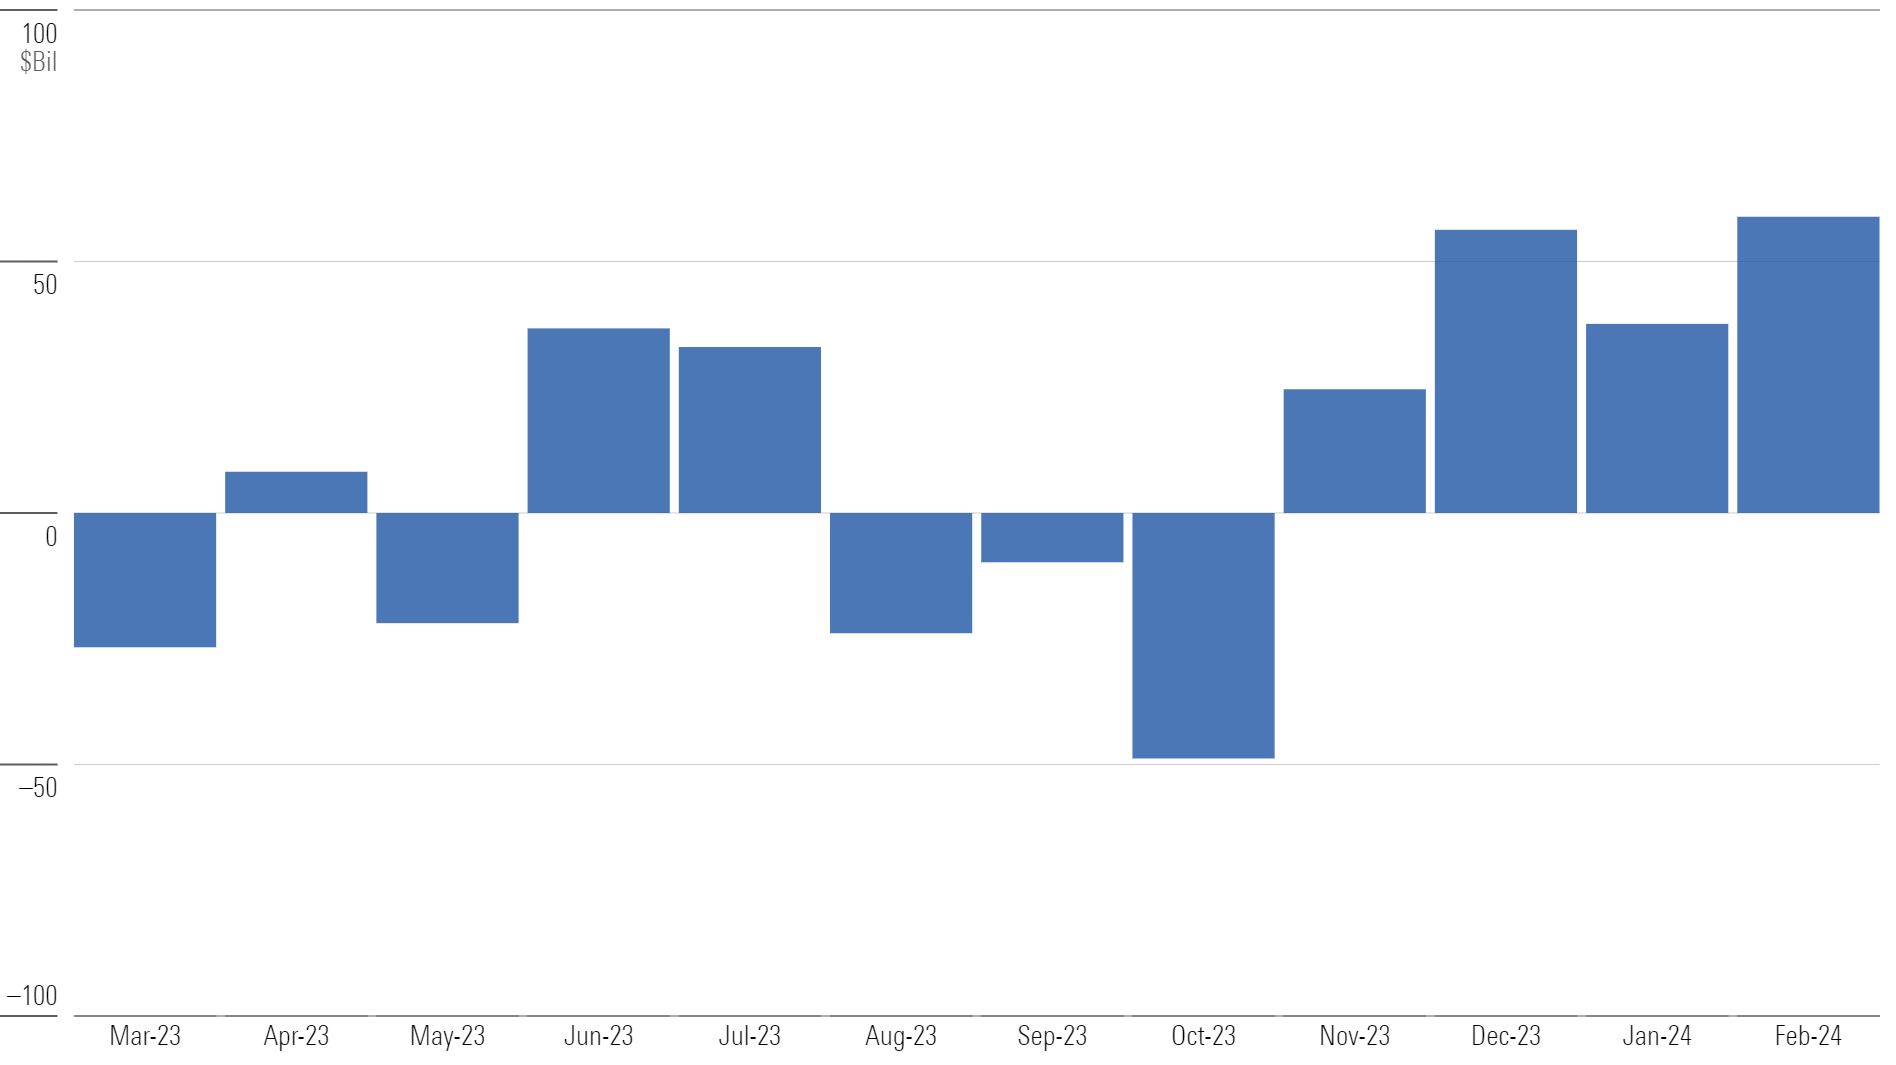
Taxable-bond funds raked in more than $50 billion in February, good for a 1% organic growth rate. The $97 billion they’ve collected in 2024 marks their best two-month stretch since April-May 2021. Active taxable-bond strategies pulled in $29 billion in February, enough to push the broad active fund universe into inflows for the first time in more than two years.
Active Bond Funds Round Into Form
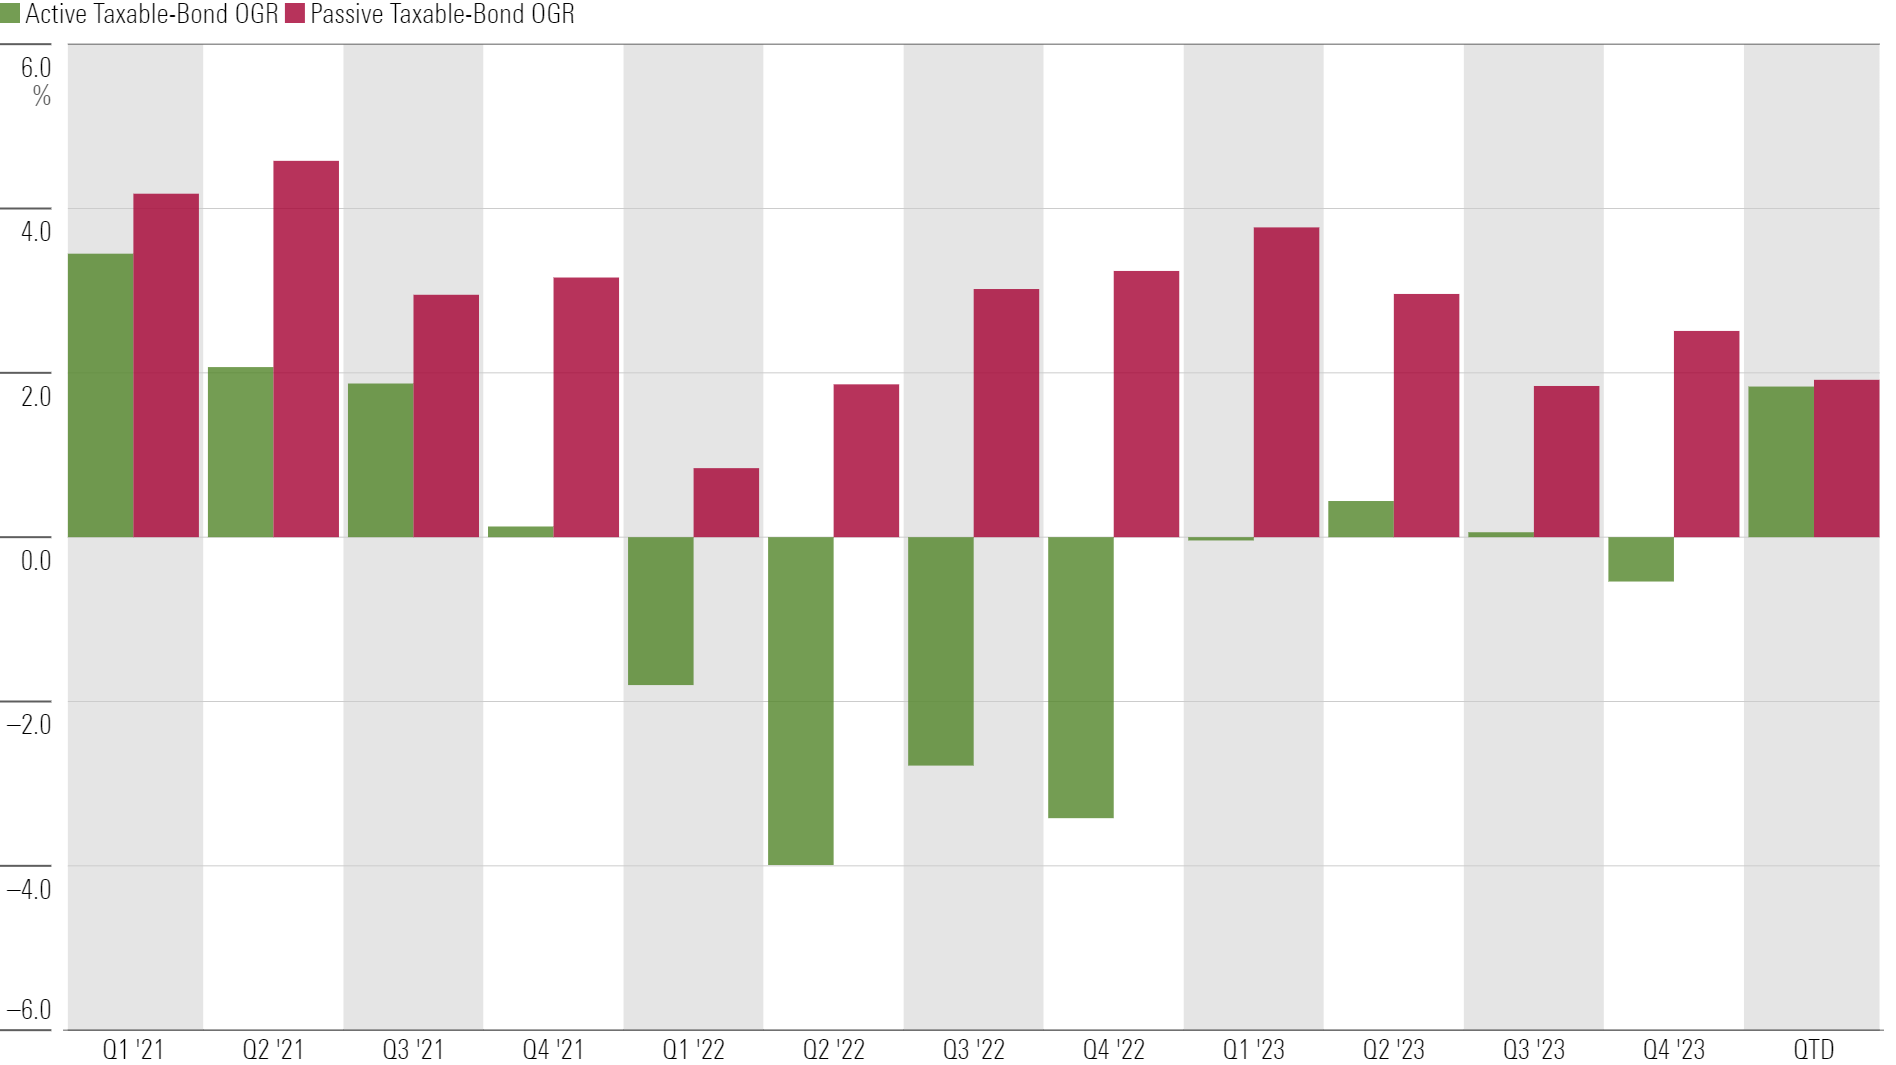
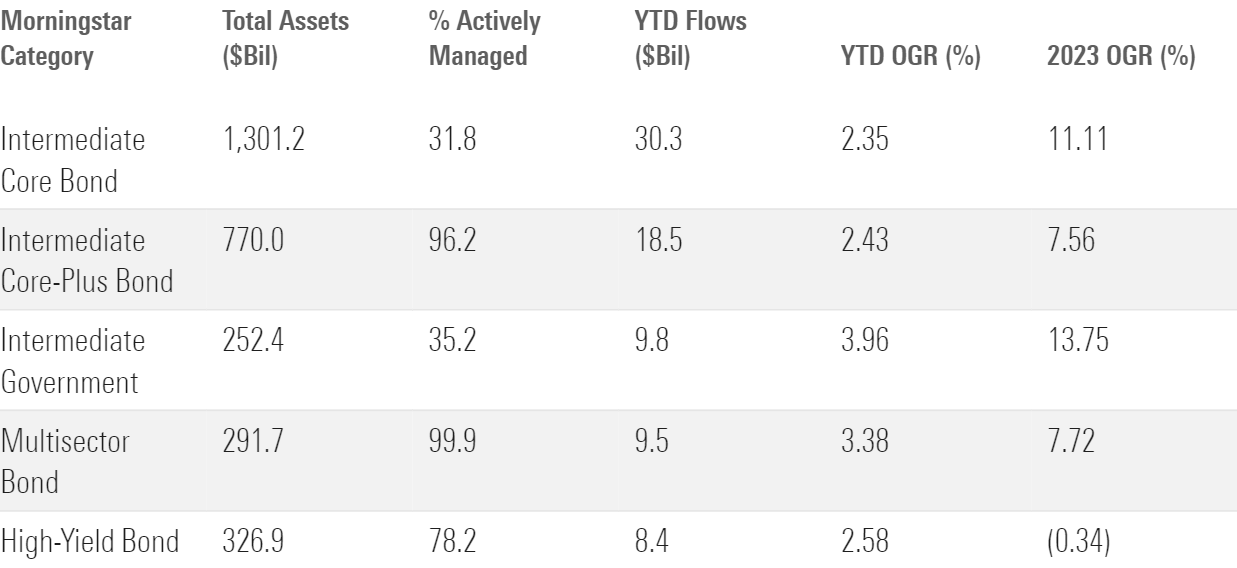
Investors have not shied away from credit risk in 2024. That is good news for active funds because they dominate credit-forward Morningstar Categories like intermediate core-plus, high-yield, and multisector bond. Meanwhile, flows into the passive-heavy government-bond categories have tapered after excellent 2022 and 2023 campaigns.
US Equity Funds Don’t Move the Needle
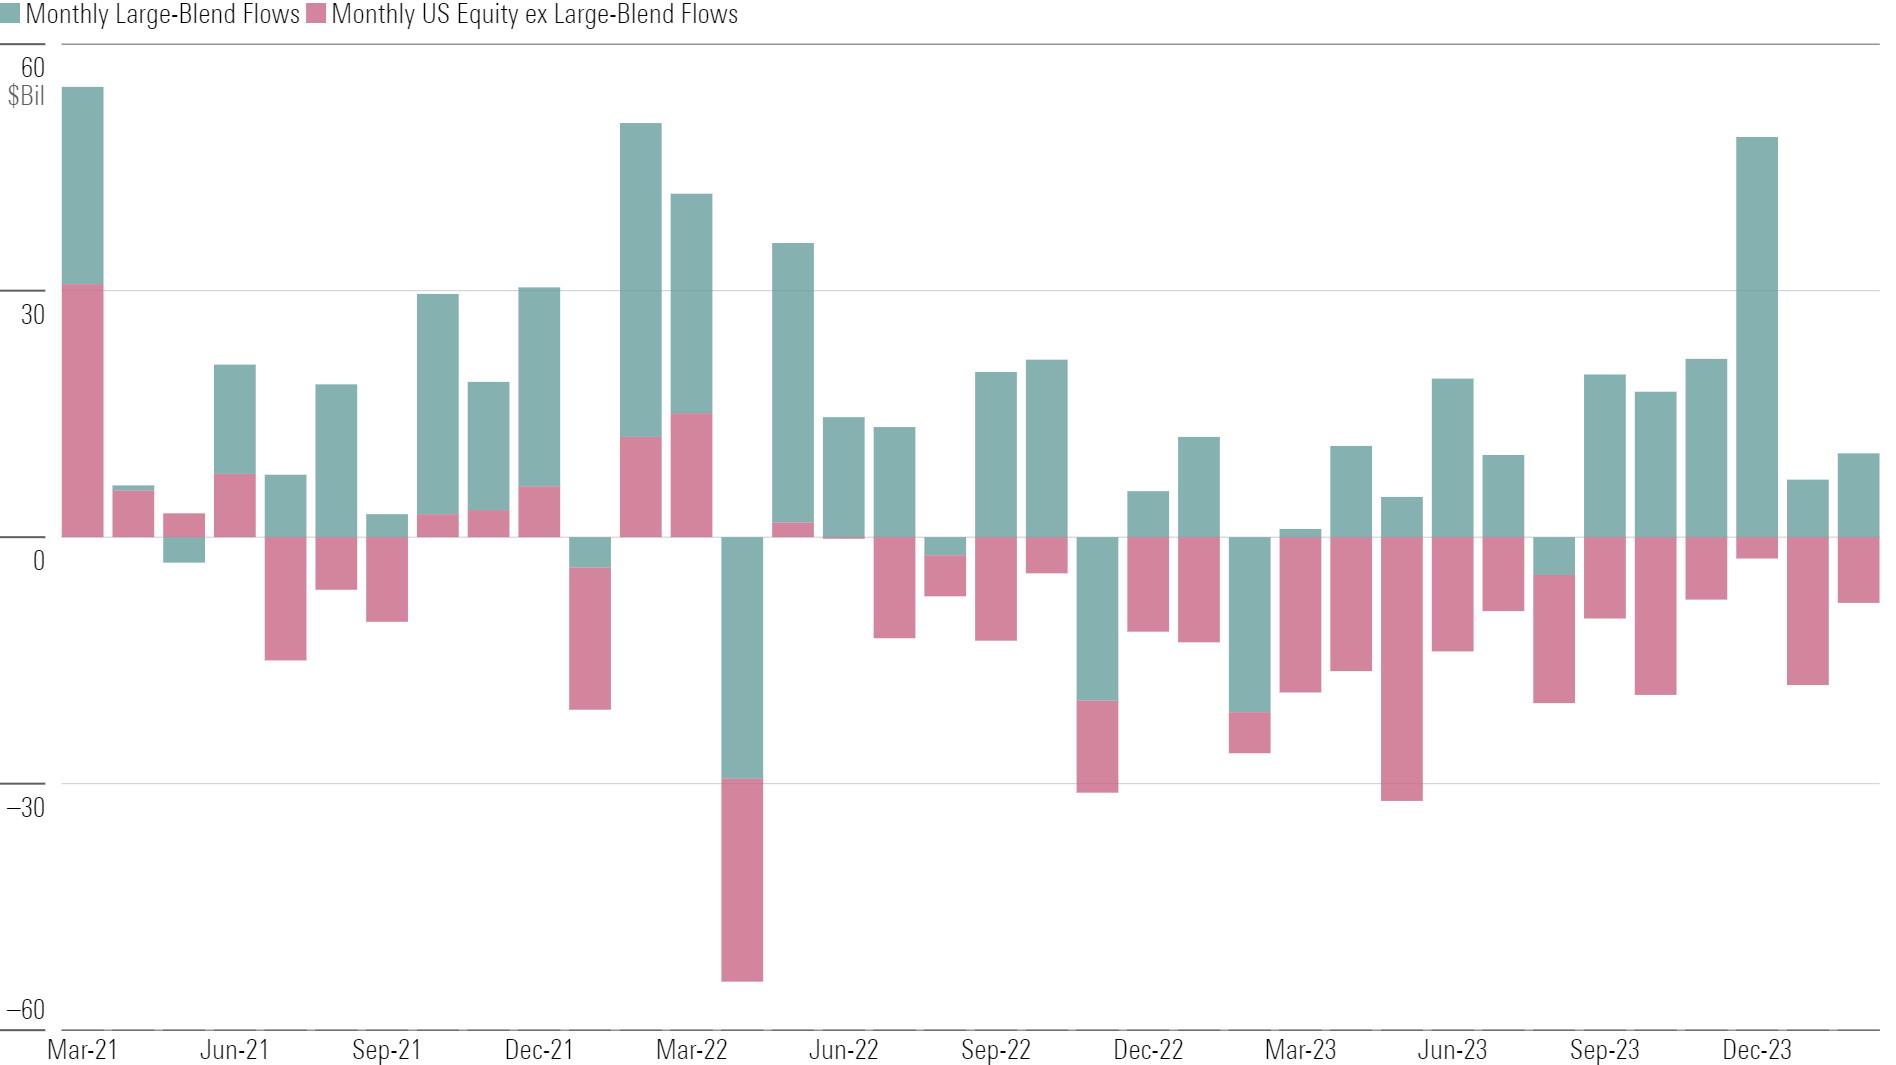
Net flows into US equity funds were basically flat in February. Over the past two years, this cohort has relied on huge flows into large-blend funds to cover for the other categories. Excluding large blend, the category group has been in outflows for 21 straight months. Large-growth funds were the main culprit in February with a $6 billion exodus, though small-value funds hauled in $2 billion.
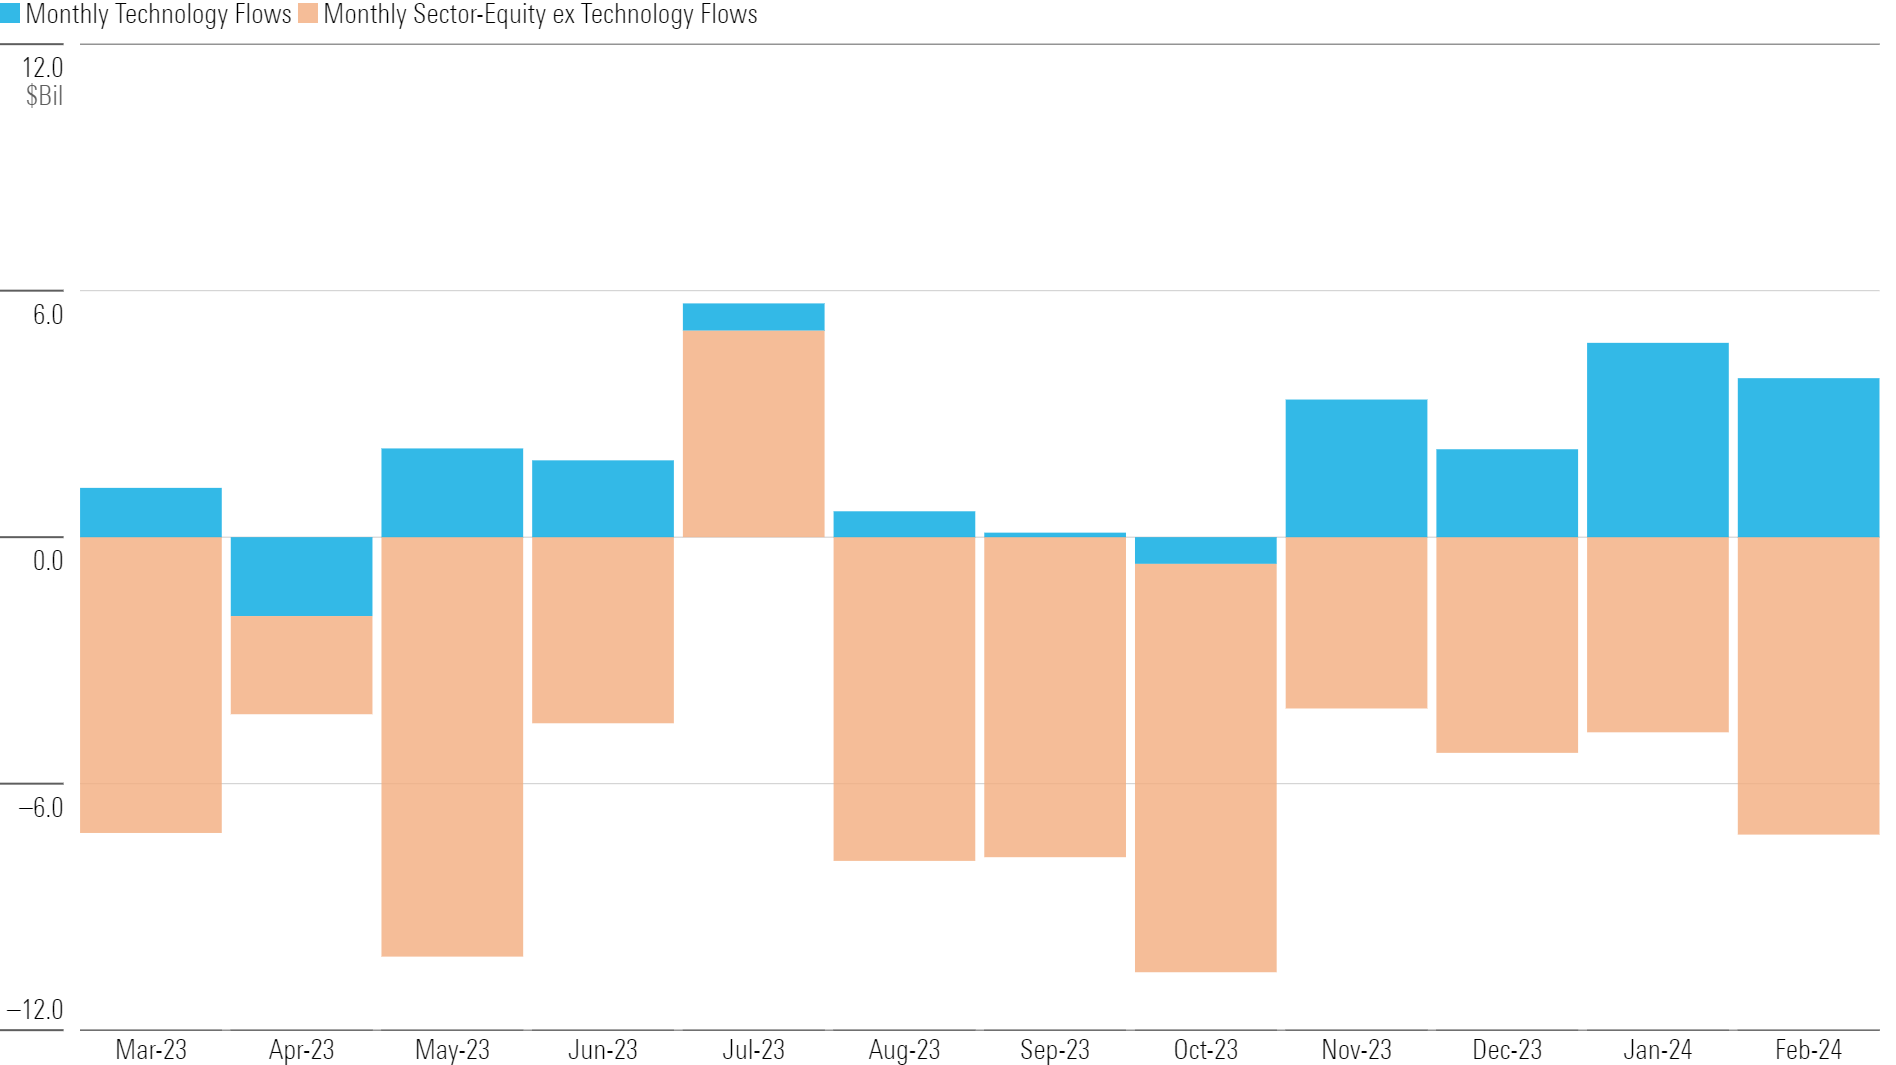
Don’t Mess With Tech
Including more than $3 billion of February outflows, sector-equity funds have bled $48 billion over the past 12 months. Don’t blame technology funds, though. They absorbed $18 billion over that span, including nearly $9 billion so far this year. Funds targeting the red-hot semiconductor industry have excelled, like VanEck Semiconductor ETF SMH, which has hauled in nearly $2 billion in 2024.
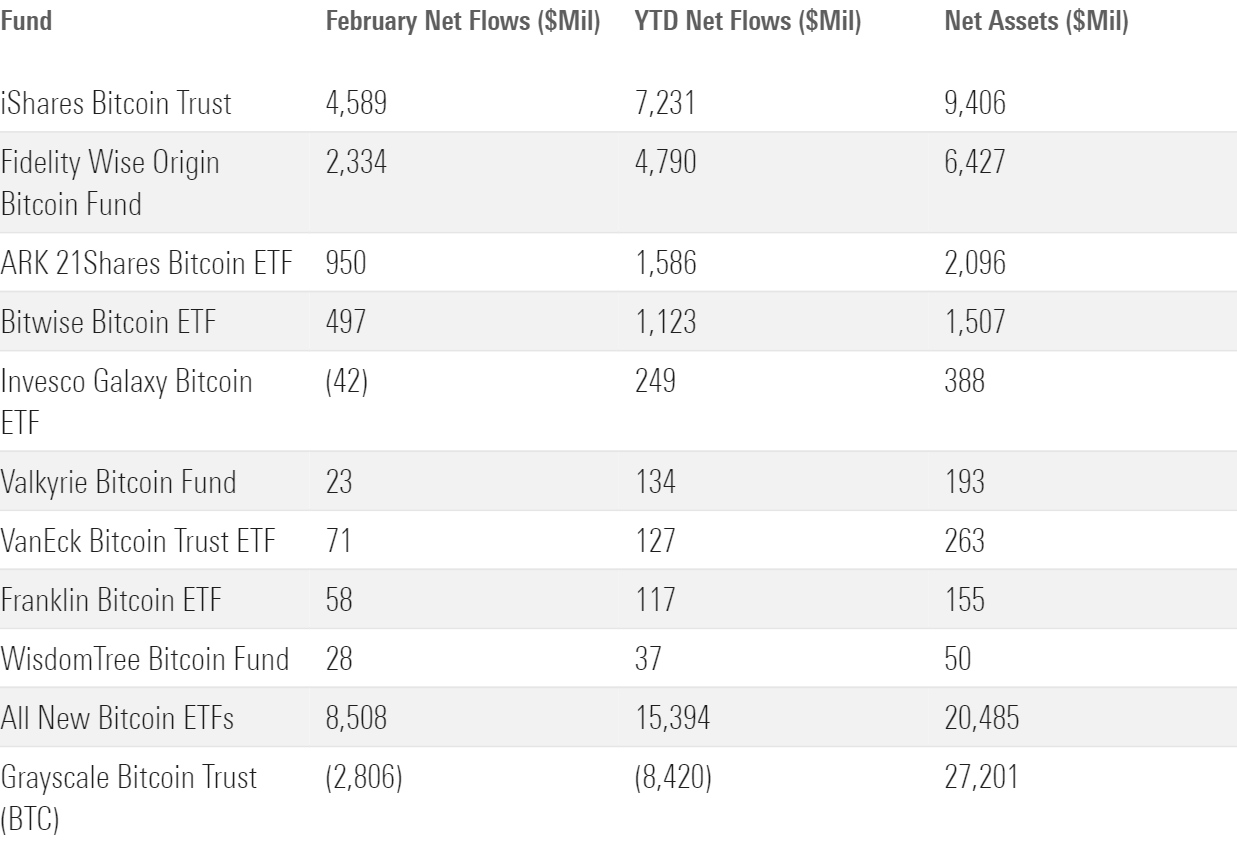
The Digital Dash Continued in February
Newly minted spot bitcoin ETFs powered the alternatives cohort to its best month since January 2022. The “new nine” bitcoin ETFs that debuted in January collectively raked in $8.5 billion in February, led by the iShares and Fidelity products. Some of that money came out of Grayscale Bitcoin Trust GBTC, the trust-turned-ETF whose market share has waned since the new competition arrived.
This article is adapted from the Morningstar Direct US Asset Flows Commentary for February 2024. Download the full report here.


