

Key Takeaways
- The Morningstar Global Markets Index, a broad gauge of worldwide equities, climbed 4.0%.
- The Morningstar US Core Bond Index gained 1.7% in its best month of 2024.
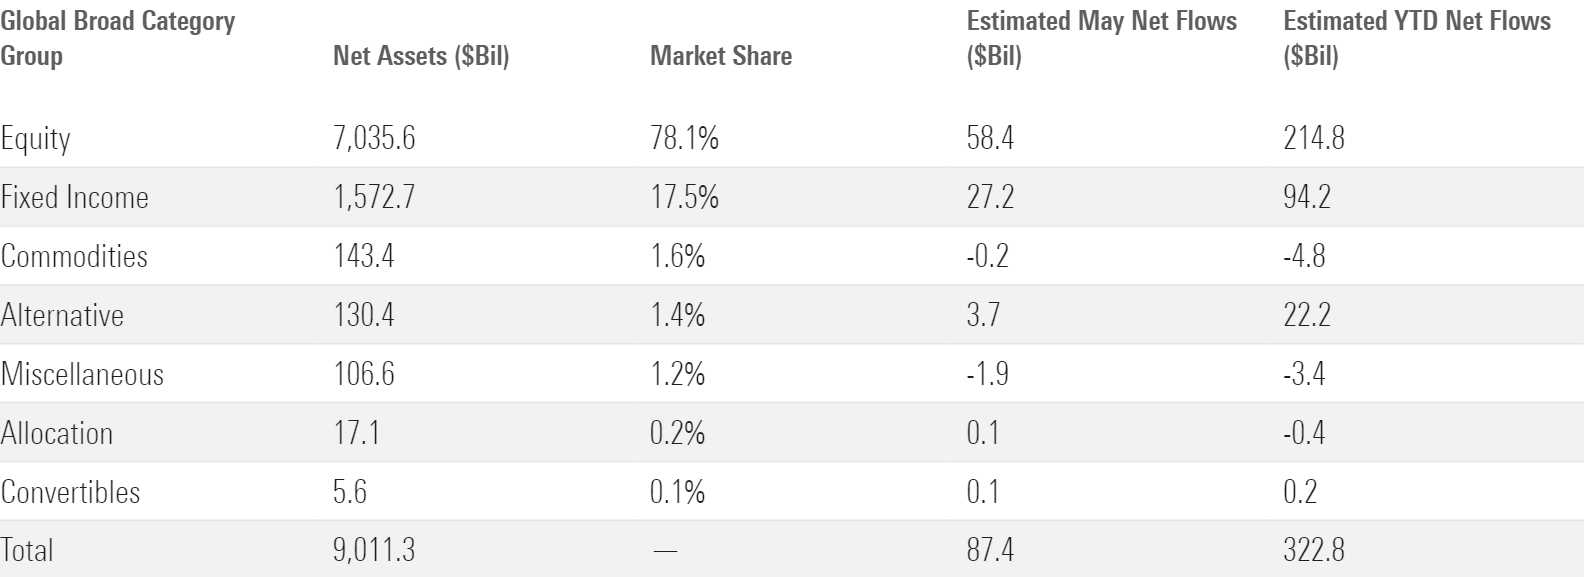
- Investors piled $87 billion into US exchange-traded funds in May.
- US equity funds gathered $48 billion behind a rush into large-cap index products.
- The market’s three largest ETFs lived up to their billing, with nearly $23 billion in combined inflows.
- Just about all flavors of bond ETFs were in high demand. They collected $27 billion in their best month of the year.
- Vanguard’s $105 billion of flows in 2024 is more than double that of the runner-up.
Market Summary
All three of the blended global portfolio’s constituents rebounded from a subpar April with solid returns in May. That helped the portfolio climb 3.2%, its best monthly gain since December 2023.
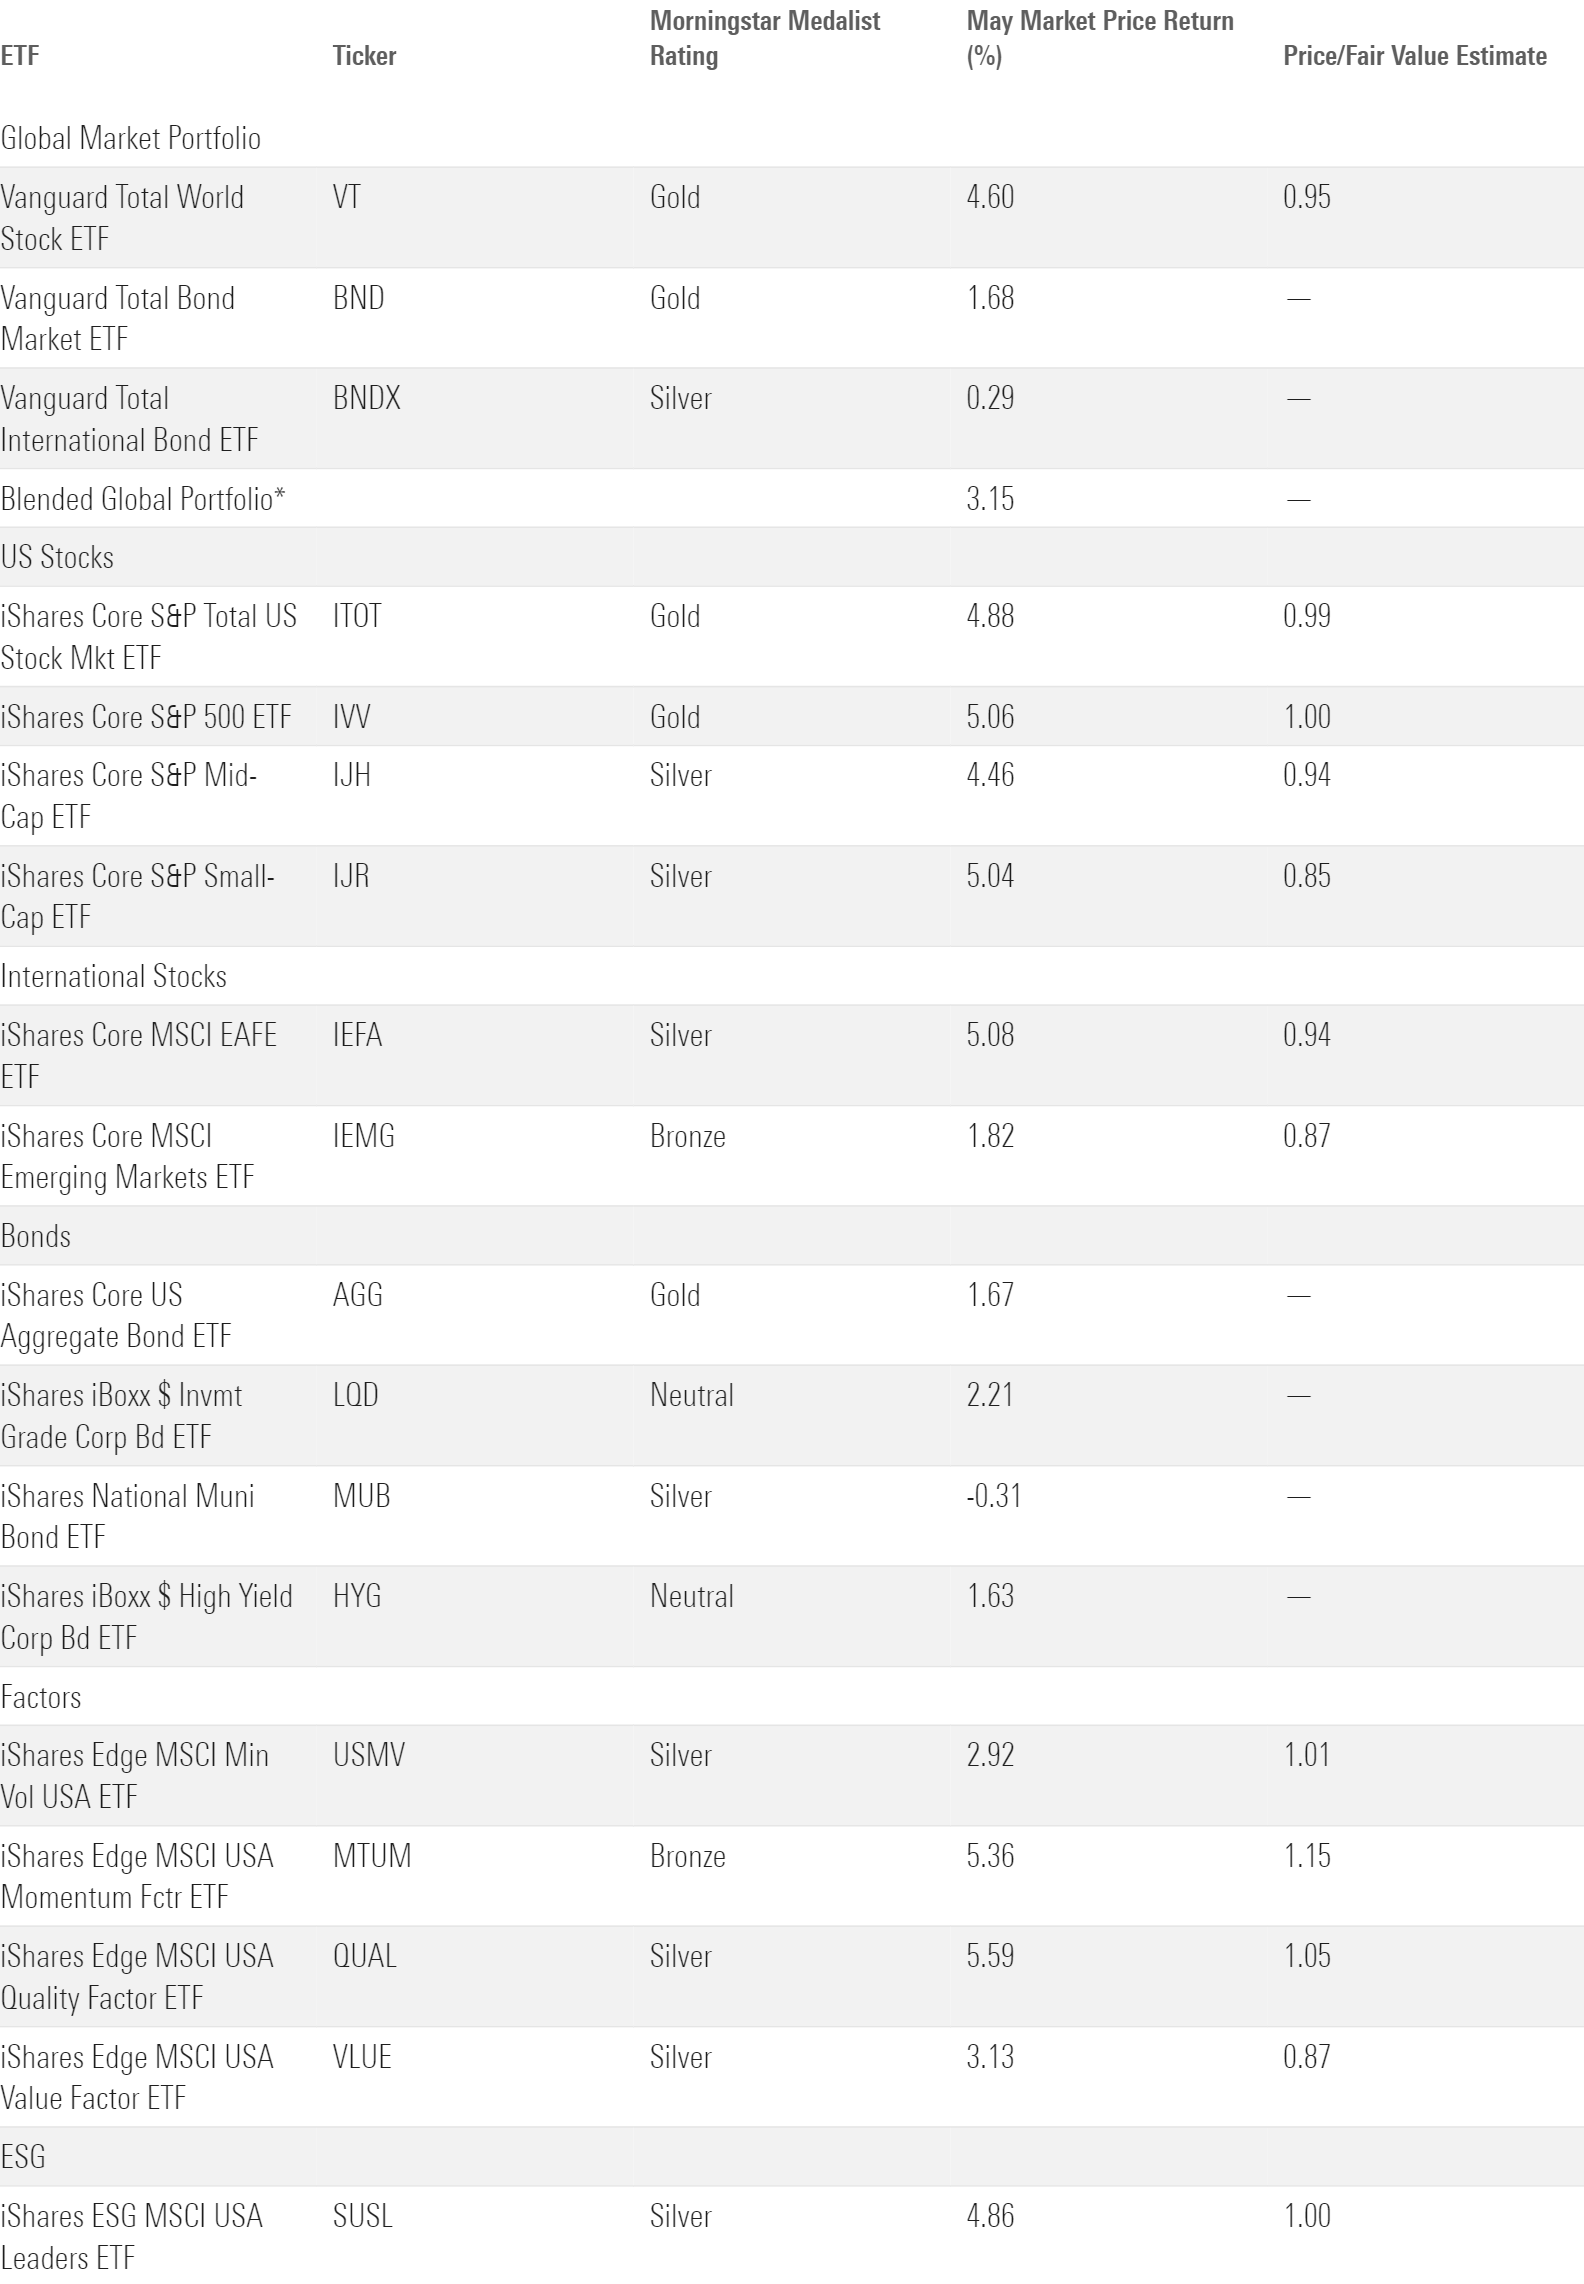
Vanguard Total Bond Market ETF BND notched a solid 1.7% return in May. Economic data and the Federal Reserve’s commentary about it were mixed throughout the month. Bond markets seemed to interpret the stream of information as evidence of a steadier inflation environment, though. That helped iShares 20+ Treasury Bond ETF TLT, the poster portfolio for long-term bonds, advance 2.9% while shorter-dated funds with lower interest-rate sensitivity saw milder gains. Bonds rallied in May’s final days when markets read slower-than-expected economic growth data as a bellwether for future rate cuts
US stocks joined in the good May fortune, but for different reasons. Vanguard Total Stock Market ETF VTI clawed back its April losses with a 4.8% return in May. That mostly came early in the month, though, as stocks soured in response to the same economic news that bolstered bonds. That reaction marks a shift. Since inflation started to soar in late 2021, bad news for the economy has been good news for stocks because it signaled that lower interest rates could lie ahead. But investors may have seen this economic slowdown as a prelude to weak consumption—a challenge for stocks to navigate, not a tailwind to ride.
Whether stocks and bonds will continue to diverge after economic news bears watching. They have shown significantly higher correlation over the past three years than the historical average, but cracks in that trend emerged in late May.
More artificial intelligence enthusiasm and solid earnings helped drive the market in May. Nvidia NVDA climbed 26.9% on the month after blowing away expectations (as expected). The AI craze spread to other semiconductor manufacturers and to the utilities firms that keep their lights on. Data centers that train and host AI require a lot of electricity, boosting revenue for the companies that provide it. Utilities Select Sector SPDR ETF XLU climbed 9.0% in May and 15.8% for the year to date—both tops in SPDR’s suite of sector funds.
Not all corners of the US market felt the sunshine in May. Energy Select Sector SPDR ETF XLE slid 0.3% alongside waning oil prices, and Consumer Discretionary Select Sector SPDR ETF XLY crept up just 0.2% in another rocky month for number-two holding Tesla TSLA. Industrials and healthcare stocks trailed the broad market. Those sectors weighed on value funds more than growth, leaving Vanguard Value ETF VTV well behind Vanguard Growth ETF VUG for the month and calendar year.
Foreign stocks trailed their peers stateside but still made out well. Vanguard Total International Stock ETF VXUS returned 4%, as its developed-market holdings pulled along those from emerging markets. IShares Core MSCI EAFE ETF IEFA climbed 5.1% to iShares Core MSCI Emerging Markets ETF’s IEMG 1.8% gain. That marked the widest monthly gap between them in either direction since October 2022, when IEFA trounced IEMG by more than 8 percentage points. This time, the developed-markets fund drew on stellar returns in European markets to carve its advantage. Lackluster Japan performance held back its rival.
ETF Flows Don’t Go Anywhere
Investors ignored the adage “sell in May and go away,” instead piling $87 billion into US ETFs last month. That sum marks a May record and puts ETFs on pace to rack up $775 billion for the calendar year, short of the 2021 record but well ahead of the past two years.
Why are investors enthusiastic? To answer that, it may help to dust off the term “soft landing,” the market’s once-favorite phrase that fell out of vogue once we neared the tarmac. Higher interest rates helped dial back inflation without upending the economy or deflating corporate profits. Investors seem to believe that the Fed effectively steered through the storm. Weaker economic data released in late May could sap that enthusiasm and the ETF flows that come with it, but investors have looked bullish so far in 2024.
Stock ETF Flows
US equity funds responded to a lackluster April by racking up $48 billion in May. The three largest ETFs on the market expanded their kingdom. SPDR S&P 500 ETF Trust SPY, Vanguard S&P 500 ETF VOO, and iShares Core S&P 500 ETF IVV—the first-, third-, and second-largest ETFs on the market—ranked 1, 2, and 3 in May flows. All three sit in the large-blend Morningstar Category and helped it to $33 billion of May inflows.
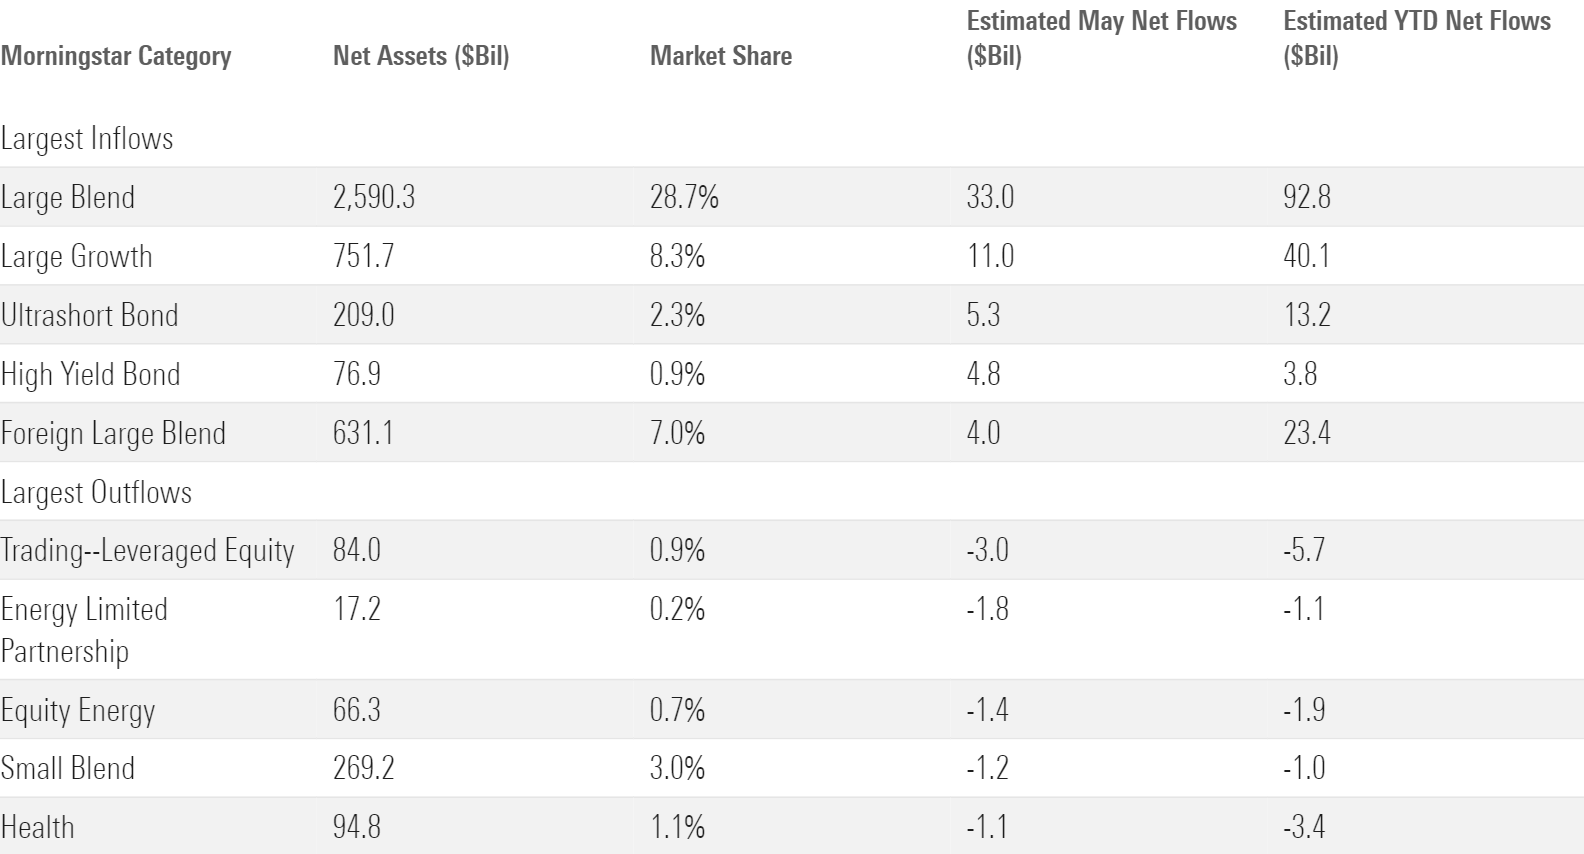
The excitement over large caps did not extend to small caps. US large-cap funds raked in $47 billion in May (1.24% organic growth rate), while about $290 million leaked from US small-cap funds (negative 0.07%). It’s hard to blame investors. Small-cap funds have consistently underperformed their larger peers. Their leaner cash cushions and shorter debt terms expose them to the economy’s short-term fluctuations. Small-cap funds haven’t compensated investors for bearing those risks, and it’s unlikely their flows will turn around until they do.
International-stock ETFs garnered a respectable if not jaw-dropping $9 billion of flows in May. Roughly two thirds of that flowed into the foreign large-blend and diversified emerging-markets categories. That’s a fitting ratio because they represent two thirds of the international-stock cohort. One category that punched above its weight was China region funds; their $1.3 billion haul marked their best monthly figure since January 2023. The Chinese government has presented itself as more amenable to foreign investment in recent months, perhaps sparking flows into this category.
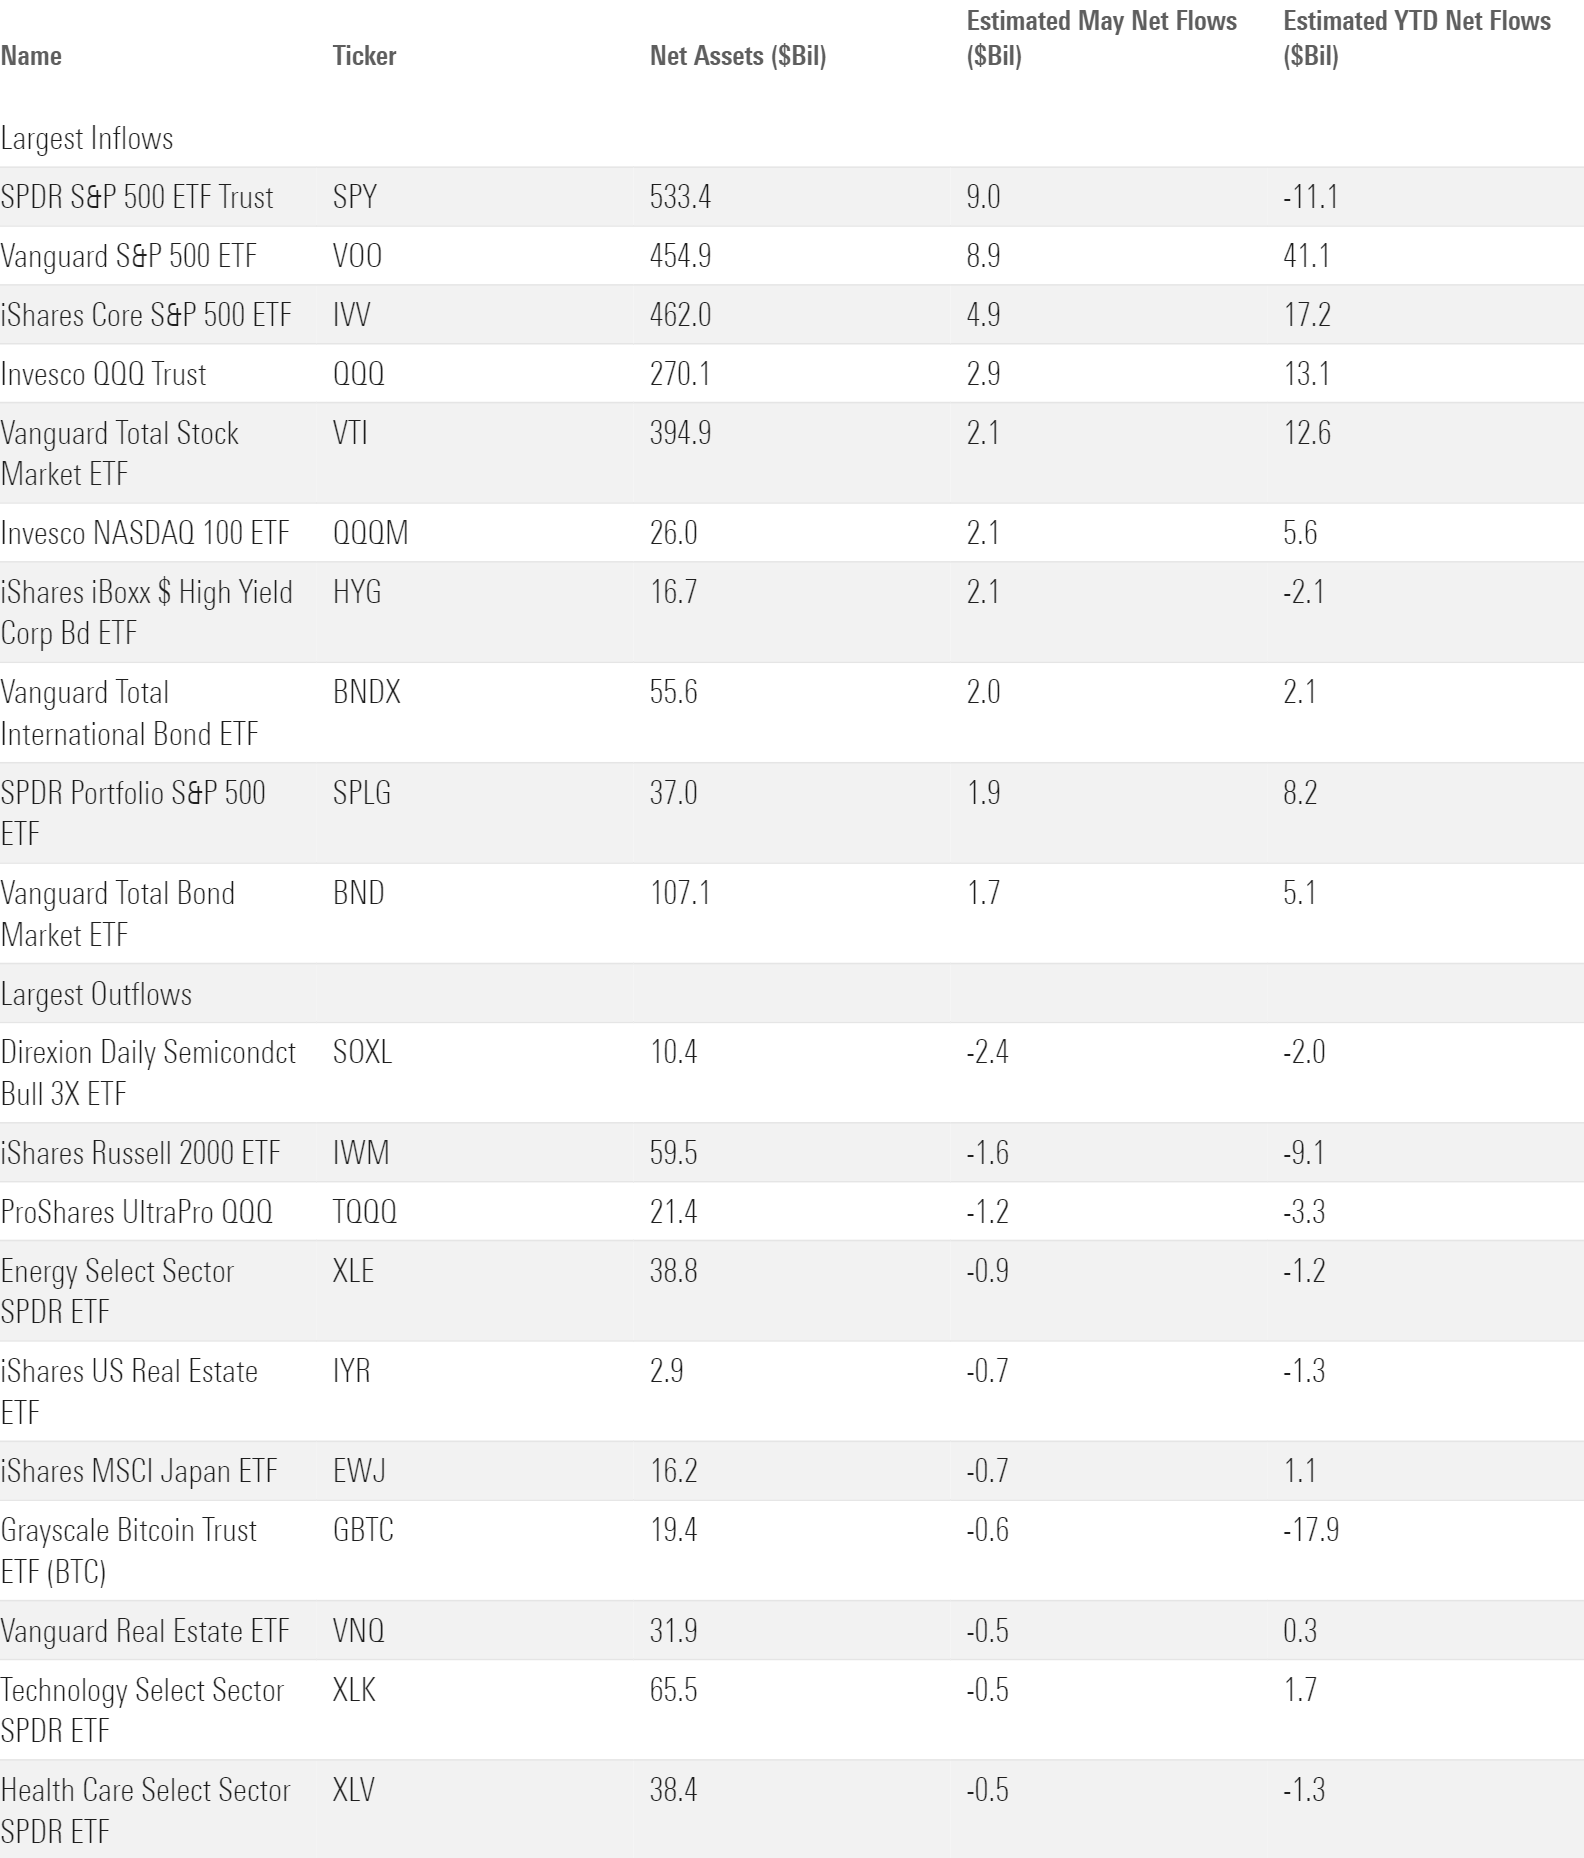
Sector-equity ETFs continued a ho-hum year with $2.2 billion of outflows in May. Utilities stocks’ growing reputation as a derivative AI play may have helped them lead the space with nearly $900 million of inflows. Technology funds weren’t far behind with almost $600 million of inflows. Tech has dominated this year, pulling in $11 billion while the rest of the cohort collectively shed $9 billion. And that doesn’t include funds that track the Nasdaq 100 Index: most investors’ preferred tech ETFs that sit in the large-growth category and hauled in $19 billion for the year to date. Energy, real estate, and healthcare funds all shed north of $1 billion in May.
Bond ETF Flows
Flows into taxable-bond ETFs had been consistent in 2024, ranging from $14 billion to $20 billion over the first four months. May brought a mini-breakout. Taxable-bond funds absorbed $26 billion, their best month since March 2023. The smaller municipal-bond cohort had a nice month as well, cracking $1 billion of inflows for the second time in 2024.
Almost every flavor of bond ETF was in demand last month. Sixteen of the 23 taxable-bond categories finished with inflows. The hottest among them was the ultrashort bond category, which features low-risk, cashlike portfolios. These Honda Civics of the bond-fund universe have been on a roll, reeling in $5.3 billion in May and $13 billion on the year—all of which arrived in the past two months. Government bond funds were popular, too, gathering $5 billion on the month.
Safety was hardly a requirement for bond investors in May. The high-yield bond category raked in $4.6 billion, which translated into a 6.6% organic growth rate. That’s normally a good enough rate to lead the taxable-bond flock, but that distinction went to the smaller bank-loan category in May. It gathered $2 billion for a gaudy 10.9% organic growth rate. Both categories shoulder more credit risk than the overall bond market, more evidence of investor confidence in May.
A Closer Look at Vanguard’s Dominance
Vanguard announced in May that former BlackRock executive Salim Ramji will take over as Vanguard’s next chief executive on July 8, 2024. When it comes to the ETFs that Ramji will inherit, simply maintaining the status quo would constitute a victory.
Vanguard ETFs have dominated their competition. The $106 billion they absorbed in 2024 more than doubled the next-closest competitor and represented about one third of all flows into US ETFs. Vanguard led all providers in annual ETF flows in the past four calendar years, expanding its market share by 2.9 percentage points to 28.8% over that time. That doesn’t sound like much growth. But considering the rash of new ETF competitors and that iShares’ market share slid to 32% from 39%, it’s an accomplishment.
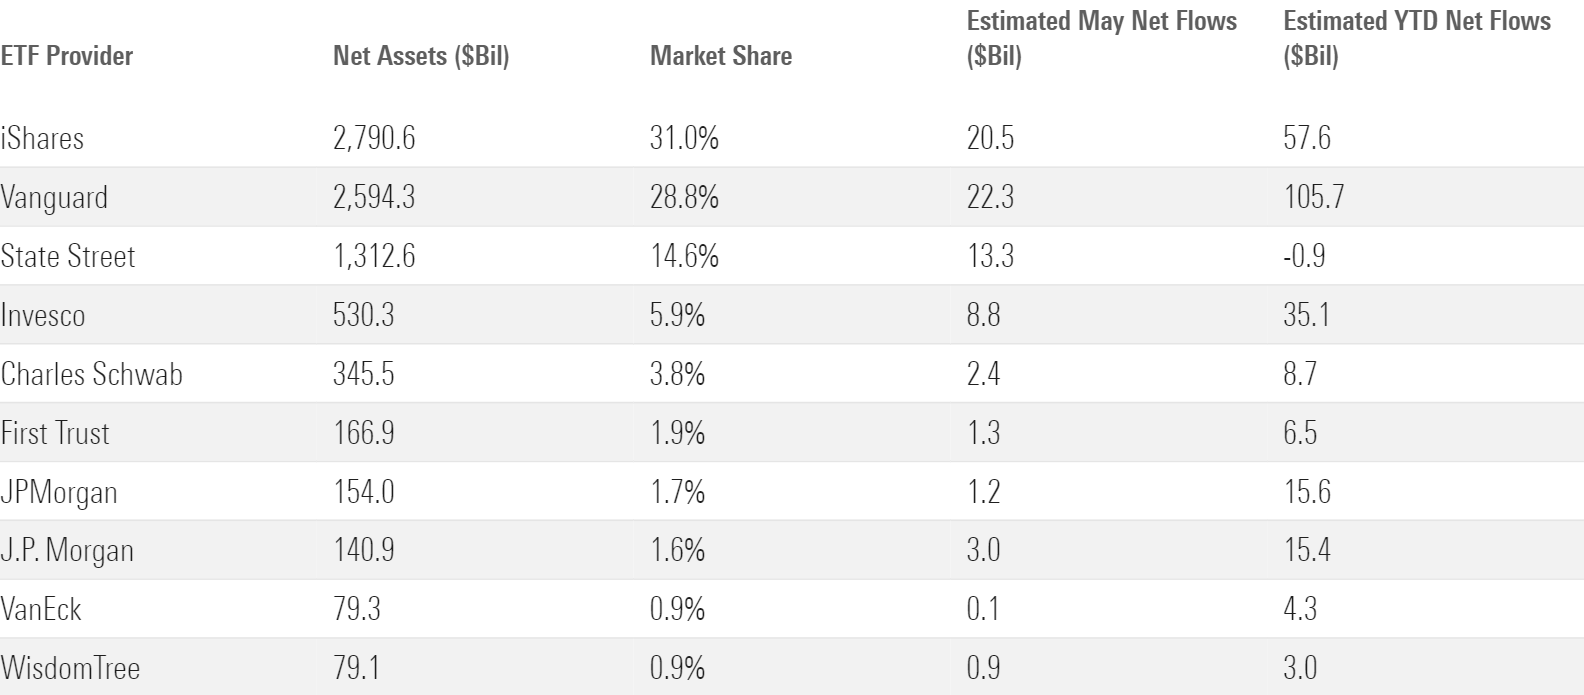
Vanguard has triumphed by sticking to cheap, broad index funds. US equity index funds claimed 61% of its assets and a similar share of its 2024 inflows. The bulk of that has poured into its two superstars VOO and VTI. They have attracted $41 billion and $13 billion on the year, respectively. Some ETF providers that lean heavily on one or two products may be at risk if those investment styles fall out of favor. Since US market exposure is such a critical portfolio component, that shouldn’t be a problem for Vanguard.
International-equity and taxable-bond ETFs have contributed to Vanguard’s rise as well. Those cohorts mostly represent the remaining 39%. Vanguard doesn’t get fancy in those segments, either. It offers a small range of plain-Jane index funds, and its disciplined investor base is eager to buy and hold them.
Searching for Value
The fair value estimate for ETFs rolls up our equity analysts’ fair value estimates for individual stocks and our quantitative fair value estimates for stocks not covered by Morningstar analysts into an aggregate fair value estimate for stock ETF portfolios. Dividing an ETF’s market price by this value yields its price/fair value ratio. This ratio can point to potential bargains and areas of the market where valuations are stretched.
Morningstar chief US market strategist David Sekera recently published the US stock market outlook for June 2024, a report that draws on the price/fair value ratio. ETFs that cover some of the report’s highlighted areas may be found in the top half of the next chart, which ranks the cheapest analyst-rated ETFs.
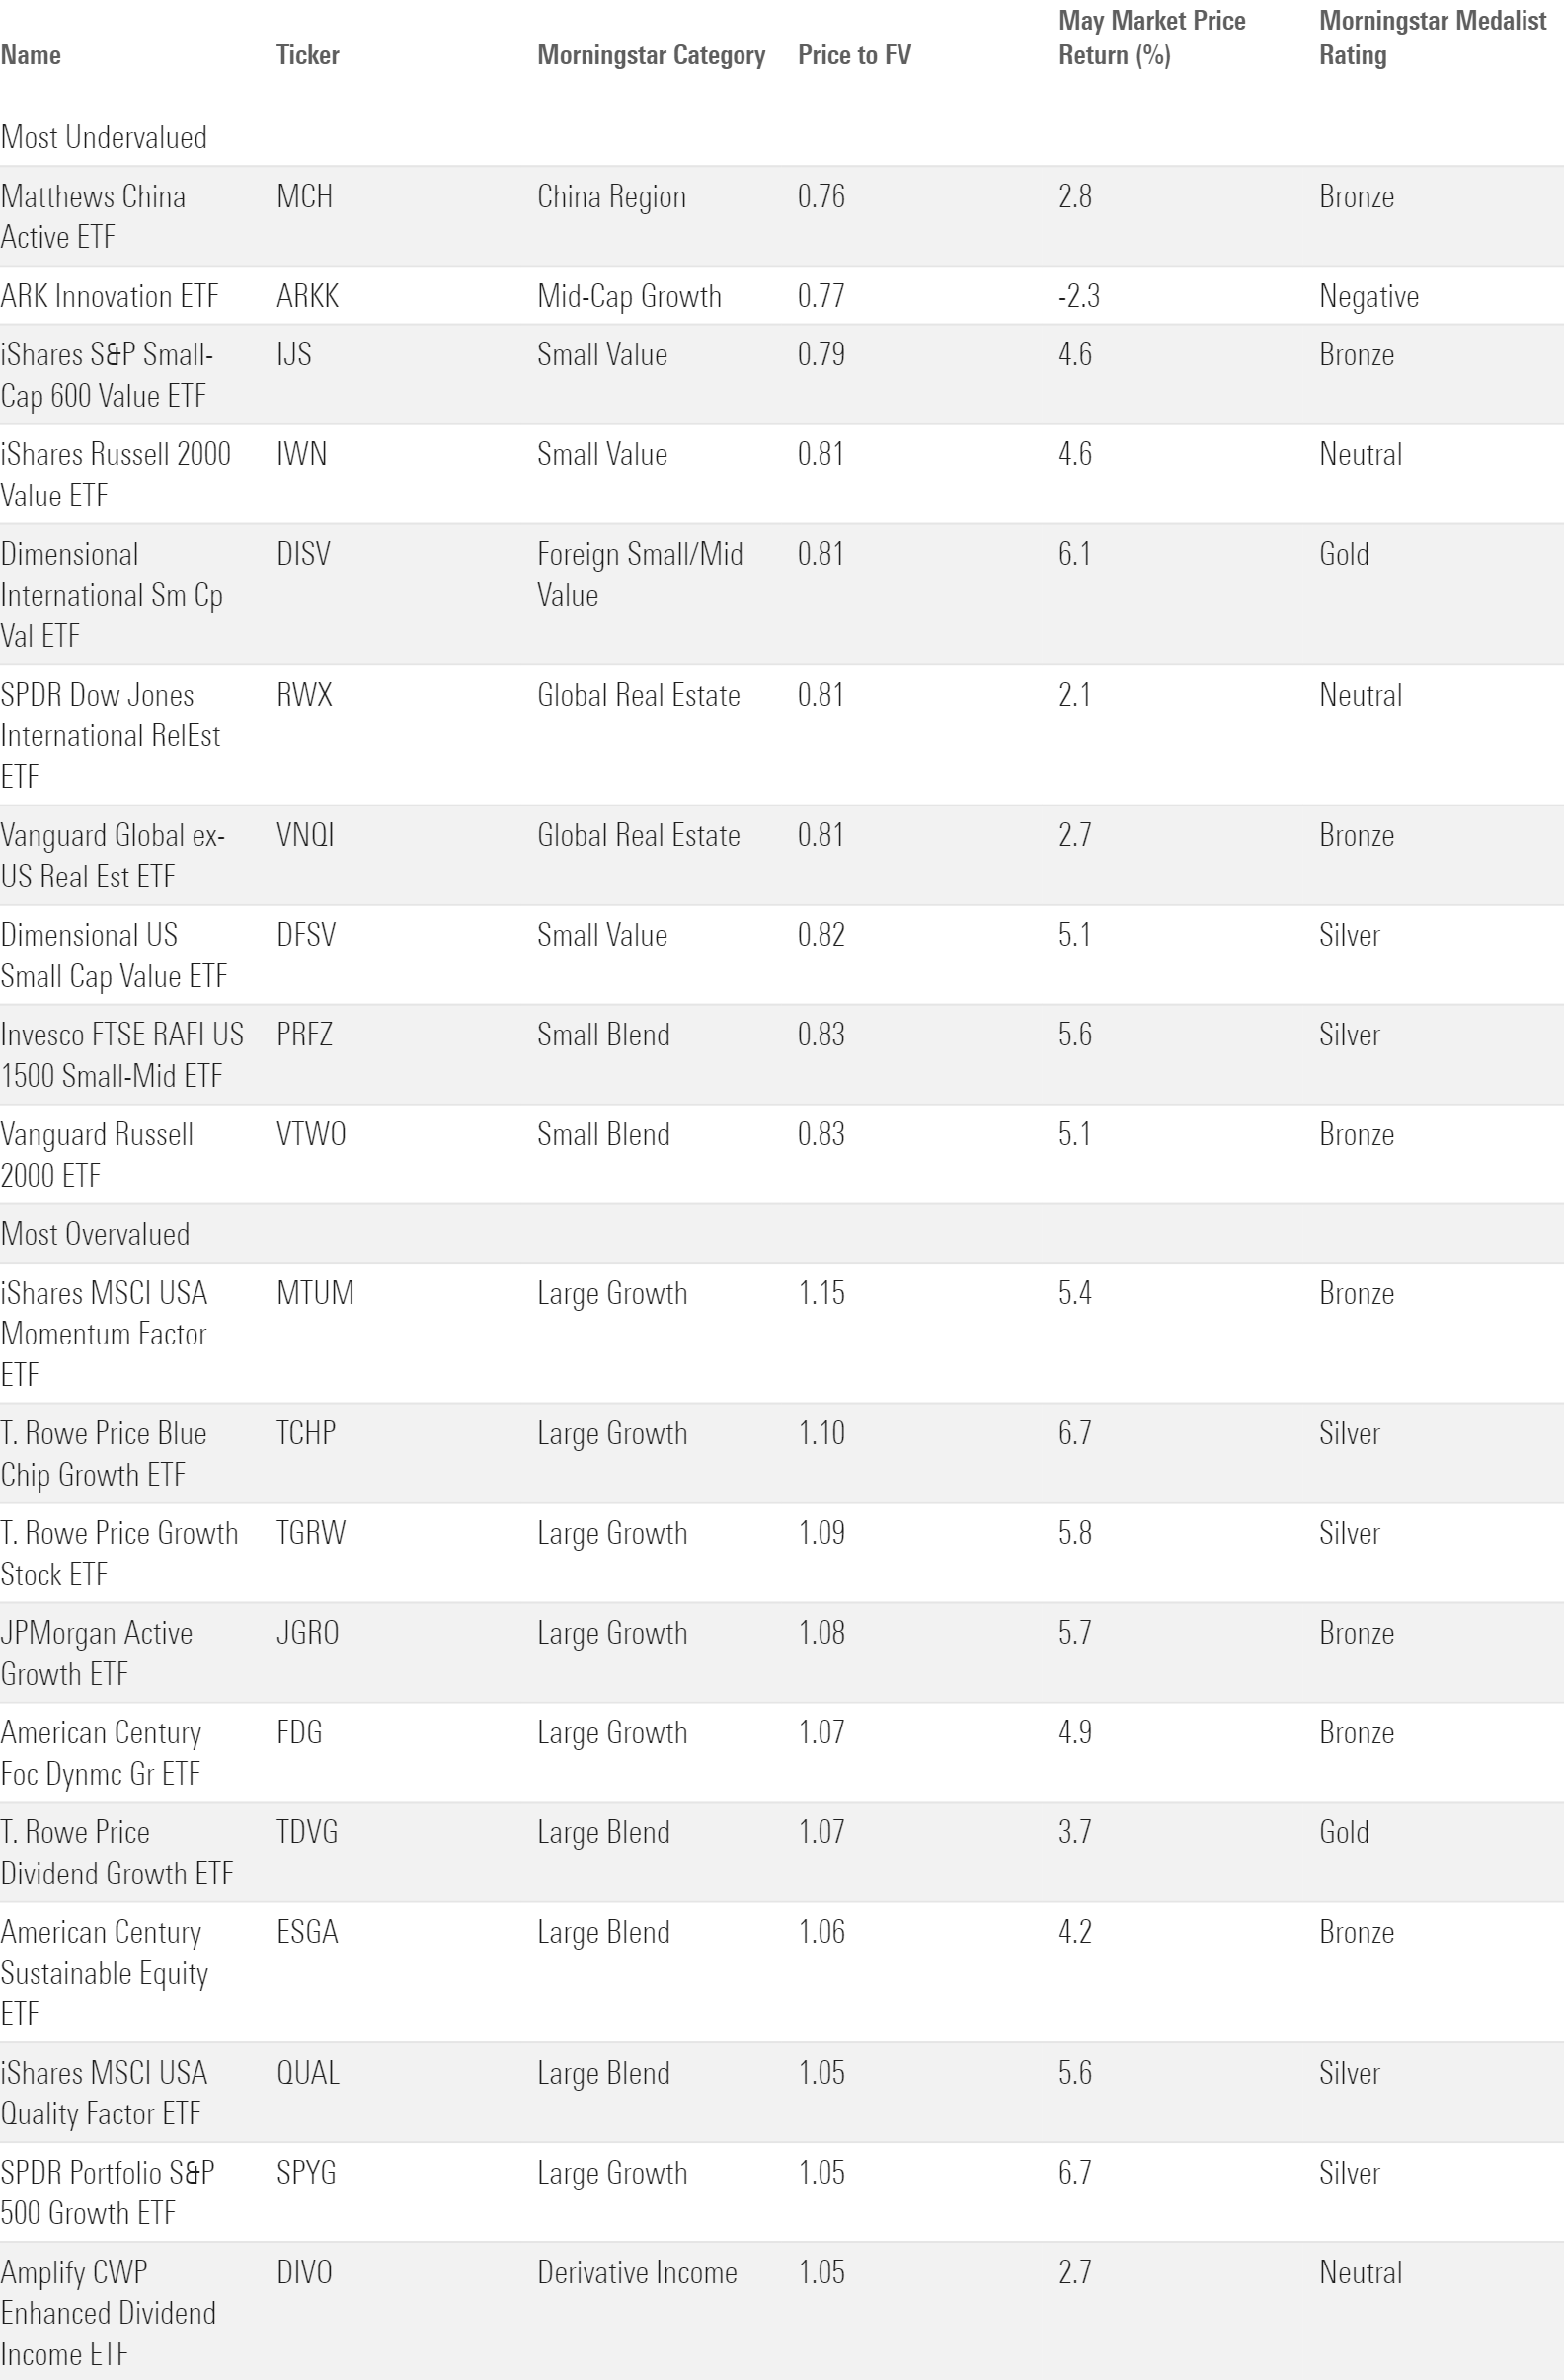
The June market outlook maintains that small caps remain cheap after another month of underperformance. Invesco FTSE RAFI US 1500 Small-Mid ETF PRFZ makes sense for investors looking to target this space. It earns a Morningstar Medalist Rating of Silver (as of October 2023) for its contrarian rebalancing strategy, breadth, and low cost. The index fund carried a 0.83 price/fair value ratio into June. Vanguard S&P Small-Cap 600 ETF VIOO shares a Silver rating and 17% discount and offers a more traditional cap-weighted index strategy.
Real Estate ranked as the US market’s cheapest sector by price/fair value after May 2024. It’s had a painful run: Real Estate Select Sector SPDR XLRE shed 4.4% over the first five months of the year. But that may present a buy-low opportunity for a fund like Vanguard Real Estate ETF VNQ. The Gold-rated fund traded 17% below its fair value as of May 2024. It’s an especially strong bounceback candidate if the Fed cuts rates sooner than expected because real estate stocks and investment trusts tend to be sensitive to rate changes.


