
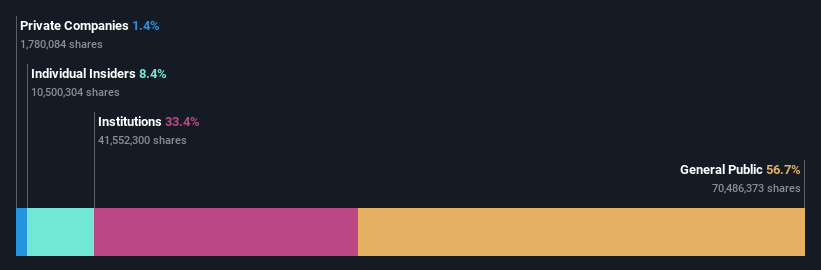
While institutions own 33% of Appen Limited (ASX:APX), individual investors are its largest shareholders with 57% ownership

Key Insights
-
Significant control over Appen by individual investors implies that the general public has more power to influence management and governance-related decisions
-
The top 25 shareholders own 42% of the company
A look at the shareholders of Appen Limited (ASX:APX) can tell us which group is most powerful. The group holding the most number of shares in the company, around 57% to be precise, is individual investors. That is, the group stands to benefit the most if the stock rises (or lose the most if there is a downturn).
Meanwhile, institutions make up 33% of the company’s shareholders. Insiders often own a large chunk of younger, smaller, companies while huge companies tend to have institutions as shareholders.
Let’s delve deeper into each type of owner of Appen, beginning with the chart below.
View our latest analysis for Appen
What Does The Institutional Ownership Tell Us About Appen?
Many institutions measure their performance against an index that approximates the local market. So they usually pay more attention to companies that are included in major indices.
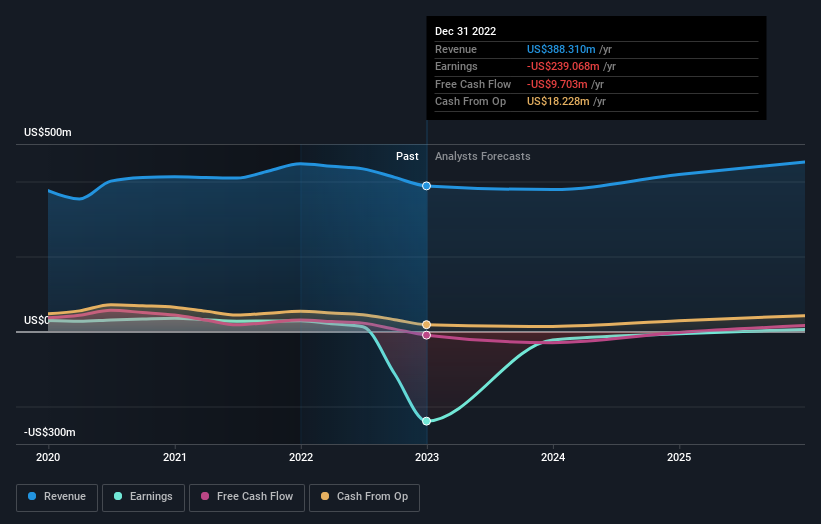
As you can see, institutional investors have a fair amount of stake in Appen. This can indicate that the company has a certain degree of credibility in the investment community. However, it is best to be wary of relying on the supposed validation that comes with institutional investors. They too, get it wrong sometimes. If multiple institutions change their view on a stock at the same time, you could see the share price drop fast. It’s therefore worth looking at Appen’s earnings history below. Of course, the future is what really matters.
We note that hedge funds don’t have a meaningful investment in Appen. Christopher Vonwiller is currently the largest shareholder, with 7.3% of shares outstanding. Mondrian Investment Partners Limited is the second largest shareholder owning 5.2% of common stock, and Norges Bank Investment Management holds about 4.8% of the company stock.
On studying our ownership data, we found that 25 of the top shareholders collectively own less than 50% of the share register, implying that no single individual has a majority interest.
While studying institutional ownership for a company can add value to your research, it is also a good practice to research analyst recommendations to get a deeper understand of a stock’s expected performance. There are a reasonable number of analysts covering the stock, so it might be useful to find out their aggregate view on the future.
Insider Ownership Of Appen
The definition of an insider can differ slightly between different countries, but members of the board of directors always count. Management ultimately answers to the board. However, it is not uncommon for managers to be executive board members, especially if they are a founder or the CEO.
Insider ownership is positive when it signals leadership are thinking like the true owners of the company. However, high insider ownership can also give immense power to a small group within the company. This can be negative in some circumstances.
Our most recent data indicates that insiders own some shares in Appen Limited. As individuals, the insiders collectively own AU$27m worth of the AU$316m company. This shows at least some alignment. You can click here to see if those insiders have been buying or selling.
General Public Ownership
The general public, mostly comprising of individual investors, collectively holds 57% of Appen shares. This size of ownership gives investors from the general public some collective power. They can and probably do influence decisions on executive compensation, dividend policies and proposed business acquisitions.
Next Steps:
I find it very interesting to look at who exactly owns a company. But to truly gain insight, we need to consider other information, too.
I always like to check for a history of revenue growth. You can too, by accessing this free chart of historic revenue and earnings in this detailed graph.
But ultimately it is the future, not the past, that will determine how well the owners of this business will do. Therefore we think it advisable to take a look at this free report showing whether analysts are predicting a brighter future.
NB: Figures in this article are calculated using data from the last twelve months, which refer to the 12-month period ending on the last date of the month the financial statement is dated. This may not be consistent with full year annual report figures.
Have feedback on this article? Concerned about the content? Get in touch with us directly. Alternatively, email editorial-team (at) simplywallst.com.
This article by Simply Wall St is general in nature. We provide commentary based on historical data and analyst forecasts only using an unbiased methodology and our articles are not intended to be financial advice. It does not constitute a recommendation to buy or sell any stock, and does not take account of your objectives, or your financial situation. We aim to bring you long-term focused analysis driven by fundamental data. Note that our analysis may not factor in the latest price-sensitive company announcements or qualitative material. Simply Wall St has no position in any stocks mentioned.
Join A Paid User Research Session
You’ll receive a US$30 Amazon Gift card for 1 hour of your time while helping us build better investing tools for the individual investors like yourself. Sign up here


