
N Brown Group (LON:BWNG) Full Year 2024 Results
Key Financial Results
-
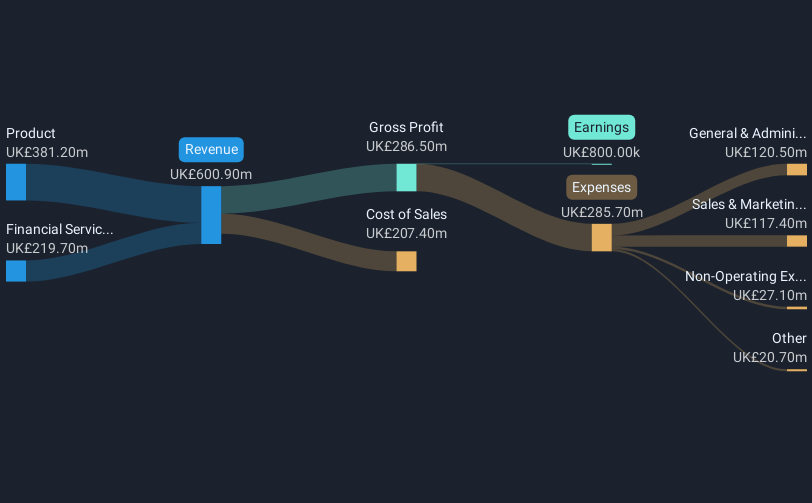
Revenue: UK£600.9m (down 11% from FY 2023).
-
Net income: UK£800.0k (up from UK£51.4m loss in FY 2023).
-
Profit margin: 0.1% (up from net loss in FY 2023).
-
EPS: UK£0.002 (up from UK£0.11 loss in FY 2023).
All figures shown in the chart above are for the trailing 12 month (TTM) period
The primary driver behind last 12 months revenue was the Product segment contributing a total revenue of UK£381.2m (63% of total revenue). The largest operating expense was General & Administrative costs, amounting to UK£120.5m (42% of total expenses). Explore how BWNG’s revenue and expenses shape its earnings.
N Brown Group’s share price is broadly unchanged from a week ago.
Risk Analysis
Don’t forget that there may still be risks. For instance, we’ve identified 3 warning signs for N Brown Group (2 are potentially serious) you should be aware of.
Have feedback on this article? Concerned about the content? Get in touch with us directly. Alternatively, email editorial-team (at) simplywallst.com.
This article by Simply Wall St is general in nature. We provide commentary based on historical data and analyst forecasts only using an unbiased methodology and our articles are not intended to be financial advice. It does not constitute a recommendation to buy or sell any stock, and does not take account of your objectives, or your financial situation. We aim to bring you long-term focused analysis driven by fundamental data. Note that our analysis may not factor in the latest price-sensitive company announcements or qualitative material. Simply Wall St has no position in any stocks mentioned.
Have feedback on this article? Concerned about the content? Get in touch with us directly. Alternatively, email [email protected]


