
Updated Feb. 13 with the latest consumer price index data from the Bureau of Labor Statistics and the latest Zillow data for rental trends in January.
Annual rental price growth is still way below pre-pandemic averages, according to the latest rental data from Zillow, the real estate website, for January 2024.
Rent prices are now 29.4% higher than they were before the pandemic, but rental growth seems to have slowed from the major spikes of 2021. In January, rents are 3.4% higher than at the same time last year. The average growth in 2018 and 2019 was 4.1%.
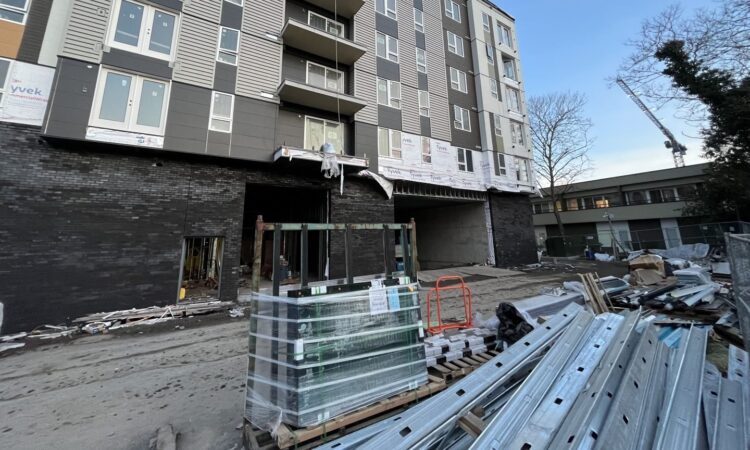
The reasons for slowing rental price growth? A spike in construction for rental housing, as well as a slowdown in economic growth overall.
Here are some of the other notable rental market trends from that report for January:
-
Rents average $1,958 across the U.S., a one-dollar increase from the previous month.
-
Rent prices are up from a year ago in 47 of the 50 biggest metro areas in the country. The highest is in Providence, R.I., with an annual increase of 7.7%
-
Rent prices dropped in 16 of the biggest metro areas. The biggest decline was in Austin, Texas (-0.5%).
-
San Jose has the most expensive rental market with an average rent of $3,177. It’s trailed by New York ($3,115 average rent) and Boston ($3,056 average rent).
-
Single-family prices continue to outpace multifamily rentals. For single-family home rentals, prices grew 4.7% from the same time last year compared to multi-family home rentals, which grew just 2.7% since last year. That discrepancy is mainly due to a lack of single-family rental construction compared to multi-family apartments.
-
More income is required to rent. A person needed to make $78,304 a year to afford rent in January — paying about 30% of income. That’s an increase of 29% since before the pandemic.
Top rental increases and decreases in the U.S.
The following are the latest increases and declines from Zillow’s analysis of housing data in 50 cities for January 2024:
Cities with the top five highest annual rent increases:
Among all types of rental housing:
Cities with the top five annual rent price declines or lowest increases:
Among all types of rental housing:
-
San Antonio, Texas: -0.4%
-
Jacksonville, Fla.: +0.3%
Nerd out on investing news
A NerdWallet account is the smartest way to see the latest financial news and what it means for your wallet.

It’s more expensive to rent than ever before
More than 35% of households in the U.S. rent homes, according to 2017-2021 data from the U.S. Census Bureau.
Over the past few years it’s become more expensive than ever to rent — especially since the beginning of the pandemic. In fact, rents were unaffordable in 2022 for 22.4 million households that paid rent — an all-time high — according to a recent report on America’s Rental Housing by the Joint Center for Housing Studies of Harvard University released on Jan. 25.
Spending 30% of your income on rent means a household is “moderately rent burdened,” but spending 50% or more means a household is “severely rent burdened” by federal standards . The Harvard study found that in 2022, half of all renters spent 30% or more of their income on rent and utilities.
How did rent get so expensive?
The fast growth of rent costs since 2020 derives from a variety of factors, including:
Inflation. Higher costs across the board mean landlords pass on higher costs (such as rising wages for maintenance workers or repair costs) to renters. Higher rent costs contribute to inflation and the cycle repeats.
Lack of inventory. There is a shortage of vacant rental properties in general, and of affordable ones in particular.
Expired rent freezes and discounts. Landlords are making up for pandemic-era rent freezes and steep discounts in urban areas by hiking prices on new units and lease renewals.
A shifting workforce. As the pandemic increased the popularity of remote work, deep-pocketed renters sought larger homes in areas that had been previously relatively low-cost. This migration increased rents in suburban areas more than it lowered them in urban ones, yielding a net increase in rents.
More demand to live alone. Prospective renters are increasingly looking for studio and one-bedroom apartments, driving up demand for available housing, according to a November 2022 report from the real estate website StreetEasy.
Barriers to homeownership. Prospective homeowners remain renters for longer as they face high demand and low inventory of existing homes, rising mortgage interest rates, as well as supply chain disruptions that have made it more expensive and difficult to construct new homes.
As mortgage rates rose in 2023, housing prices cooled faster than rents, which are finally rising at a slower pace than in the last three years.
In 2022, a promising development began: Multifamily construction in 2022 reached a 50-year high nationwide, according to the rental listing service RentCafe. A new supply of housing is likely to bring down overall rent growth. And since many cities require inclusionary housing — meaning a portion of new housing must be affordable — new construction also means new affordable housing.
On Jan. 25, 2023 the Biden administration proposed a “Blueprint for a Renters Bill of Rights,” a new set of federal actions aimed at promoting rental affordability that also include guidelines to strengthen tenant protections .
Rent vs. inflation
Rent is a major contributor to inflation and the cost of rent is also impacted by inflation. The price index for shelter, which includes rent, makes up the biggest portion (34%) of the consumer price index, a proxy for inflation .
The latest data from the Bureau of Labor Statistics released on Jan. 11 shows that in December, shelter continued a more than 40-month increase. For December, shelter, which includes rent, was the largest contributing factor for the overall inflation increase. It is also the largest contributing factor for the core inflation increase, which excludes food and energy.
For rent, specifically, the month-over-month increase from November to December (0.4%) was 0.1 percentage points lower than the October to November increase. Over the 12-month period ending in December, rent alone was up 6.2%, the same as the overall 12-month increase for shelter.
There’s a lag in how rent data is reflected in the CPI, which means it takes longer for rental shifts in the market to show up in the report. The lag is primarily due to the cycle of renewals for leases. Since most leases last around a year, a renter’s costs will stay the same all year long. It’s only when the lease ends that a better understanding of the rental market emerges.
The rent-specific portion of CPI has been outpacing overall inflation for decades and most sharply began to diverge in the mid-to-late 2010s.
Who is most likely to rent?
Single people are more likely to rent than couples, regardless of whether they have children, according to a 2022 rental housing report from Harvard University . Hispanic, Black and Asian residents are more likely to rent than own homes when compared with white residents. Those with incomes at or below $74,999 are more likely to rent than own compared with those with incomes $75,000 and over.
Despite soaring rents, it’s still less expensive to rent than to buy. The typical rent for an average three-bedroom place is still more affordable than owning a similar-sized home in 95% of the 222 U.S. counties analyzed by ATTOM, a land and property real estate data curator, in its 2023 Rental Affordability Report.
The generation of adults most likely to rent is Gen Z with 74% of the cohort renting their homes, according to a March 29 data analysis by RentCafe, an apartment listing service. That’s a pretty recent development since Millennial home buyers only began to outweigh renters in the cohort as of 2022, the data shows. The analysis found 51.5% of millennials now own their own home. The amount of millennial homeowners increased 28% from 2019 to 2022. But baby boomers are still the dominant generation owning their own homes, representing 40% of all homeowners in the U.S.
Rent vs. income
Generally, households should be spending no more than 30% of their gross income on rent, according to the NYU Furman Center .
That means if a household earns the U.S. median income — $70,784 annually, or $5,899 per month, according to the U.S. Census Bureau — when applying the 30% rule, the goal would be to spend no more than $1,770 per month on rent .
Those with the highest rent burden are disproportionately seniors, low-income, immigrants and racial or ethnic minorities, according to a 2015 Zillow analysis of U.S. Census Bureau data. Severely-burdened renters are also more likely to have long commutes via public transit and lack cars. Children are also often present in homes with high rent burdens.


