Our analysis generates detailed results for different technologies and regions and for each of the scenarios explored. All regional results can be explored and compared using an open access on-line tool we developed (https://datashowb.shinyapps.io/web_shiny/). Here we summarize the main insights emerging from the analysis in terms of (a) global pathways, (b) the financing of additional R&D investments in stringent decarbonization scenarios and (c) regional macroeconomic effects. We also discuss (d) global climate policy costs with optimal R&D strategies.
Global pathways
Figure 1 summarizes our results in terms of global cumulative optimal investment from 2020 to 2050 for each technology (panel a), time profile (panel b) and total cumulative R&D investment in selected regions (panel c). Four main messages emerge.
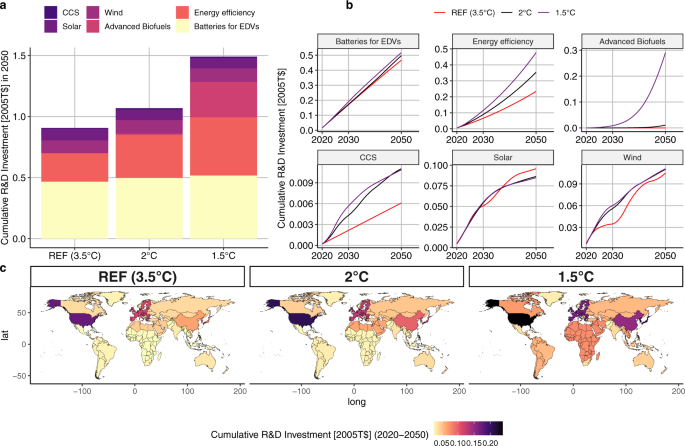
a shows the global cumulative R&D investment up to 2050; b shows the global cumulative investments per technology from 2020 to 2050; c shows the total R&D low-carbon investments for the WITCH regions by scenario.
First, while optimal R&D investments in all scenarios fund a diverse portfolio of technologies, the relative importance of a given technology is different depending on the stringency of the carbon budget. In all three scenarios, the biggest share of investments is allocated to batteries for EDVs and energy efficiency. In the REF scenario and in the 2 °C target, wind and solar represent respectively the third and fourth largest R&D investments. In the 1.5 °C target, advanced biofuels is the third most funded technology, before wind and solar, in line with historical shares5. For CCS and Wind, the results are more sensitive to the presence of a carbon budget than to the magnitude of the budget itself. The CCS share of R&D investments remains low compared to other technologies; this result is discussed more in detail below.
Second, for more mature technologies, the overall optimal R&D low-carbon investments in stringent decarbonization scenarios do not necessarily mean more cumulative R&D investment for each technology, but rather earlier R&D funding (Fig. 1b). Indeed, total cumulative investments for solar and wind over the century in the REF and policy scenarios are similar, i.e., optimal investment does not require large scale-up in a policy scenario as compared to REF (see also Supplementary Figs. 10 and 11 of the Supplementary Information). Two considerations help explain this result. On the one hand, these technologies are characterized by high learning-by-researching and learning-by-doing rates. On the other hand, as we discuss below, in stringent decarbonization scenarios these technologies compete with CCS. Importantly, however, R&D investments for mature technologies in both climate policy scenarios are carried out earlier rather than later. In the case of solar, for instance, imposing a more stringent climate policy results in a displacement of solar R&D investments from the later years to 2030. Similar dynamics are apparent, to some extent, for wind. This result, emerging from a perfect foresight model (WITCH), confirms that R&D is a key component of the climate policy portfolio and that, for more mature technologies, it is not only its amount but also the timing of such investment that matters in achieving more stringent targets at lower costs. Note that the two–factor learning curve formulation included in WITCH contributes to achieving this result (see Equation 3 of Supplementary Information section 1). As mentioned above, the two-factor-learning curve formulation accounts for cost decreases arising from both R&D investments (through the knowledge stock) and from increasing deployment (through cumulative capacity). At the beginning of the century, optimal R&D investments are larger and result in lower installation costs, consequently leading to faster deployment. This increase in installed capacity, in turn, further lowers installation costs. The cumulative effect of these dynamics is more pronounced for technologies with high learning-by-doing rates, such as solar and, to a certain extent, wind (see Supplementary Fig. 6 of the Supplementary Information section 3). Importantly, as we discuss below, in stringent decarbonization scenarios these technologies compete with CCS.
Third, for less mature technologies, there are substantial differences in the optimal R&D investments in the REF as opposed to the decarbonization scenarios. CCS is the least mature of the technologies analyzed here, and one that has not yet registered large R&D investments relative to the other technologies. The fact that returns on R&D investment are calibrated with historical data and that for less mature technologies a successful technological outcome is more uncertain explains the lower investment levels compared to those of other technologies. Yet, investments in CCS in 2030 are double and 2.6 times larger in the 2 °C and 1.5 °C scenarios, respectively, as compared to REF. This in turn gives rise to a rapid decrease in the cost of fossil energy with CCS, illustrating the importance of this technology option to support the rapid emission reductions in the early years. Indeed, the availability of low-cost fossil energy with CCS has important implications for the time profile of energy demand from other low-carbon technologies. Specifically, it translates into slightly lower deployment of renewables, even if the R&D investments have reduced the cost of solar and wind. While scenario literature suggests that CCS is an important component of reaching the 2 °C and 1.5 °C decarbonization targets26, our study highlights that CCS technologies compete with renewable energy sources. Differently from CCS, batteries for vehicles see only a timid increase in R&D investment in the presence of a climate policy, as compared to REF. However, given that this technology has the highest learning-by-researching and learning-by-doing rates even small increases in investments and capacity lead to great cost reductions (see Section 4 of the Supplementary Information for sensitivity to learning rates).
Fourth, total cumulative R&D investments are heterogeneous across different regions in the world (Fig. 1c). In all scenarios, the highest contributors to R&D investments are the USA, the EU and Japan and South Korea (jpnkor). When climate policy is implemented (2 °C and 1.5 °C) all regions increase their R&D investments (Supplementary Fig. 19 of the Supplementary Information). With the exception of the USA, Russian and the former Soviet Union and the MENA region, the change in R&D investments required to achieve 2 °C relative to REF is lower than the one required to achieve 1.5 °C relative to 2 °C. That is, reaching the 1.5 °C target requires a deeper change in energy systems than reaching the 2 °C target (Supplementary Fig. 19 of the Supplementary Information). Reaching the 1.5 °C target entails a 64% increase in global cumulative R&D investments as compared to the 18% needed in 2 °C. In the 1.5 °C scenario the global R&D average (2020–2050) investment estimate is 18.8 2005$ billions. According to UNEP27 the estimation of clean R&D spending in the COVID-19 recovery packages is 28.9 2005$ billions, that is 65% of the annual estimated needs to reach 1.5 °C.
Comparing the current public investments provided by13 for the regions where data is available, in the USA, Oceania, Japan and South Korea, the EU, and Canada the estimated low-carbon R&D investment needs in 2050 represent more than double of the current low-carbon R&D investments in terms of Share of GDP (Supplementary Fig. 19 of the Supplementary Information section 10). Note that R&D in EDV is excluded from this comparison as13 reports data on public expenditures while our analysis of EDVs includes both private and public data, as explained earlier, so such a comparison would be misleading. In China, Japan and South Korea, Southeast Asia, Latin America and sub-saharan Africa reaching 1.5 °C implies at least doubling the R&D investment with respect to REF. These increases are related to investments in advanced biofuels (Supplementary Fig. 14 of the Supplementary Information). The EU and the USA have high R&D investments in batteries for EDVs in the REF scenario as well as in low-carbon scenarios. Conversely, in China, the MENA region, and to some extent the reforming economies, R&D investments in this technology are triggered only by stringent climate policy (Supplementary Fig. 10 of the Supplementary Information). CCS R&D investments see important increases in Latin America (except Brazil), Canada, USA, China and the reforming economies (Supplementary Fig. 12 of the Supplementary Information).
Financing low-carbon R&D through carbon revenues
Financing the energy transition is a challenge21 state that R&D is only a small share of the overall financing requirements of the low carbon transition. Our estimated additional low-carbon R&D investment requirements to reach 2 °C (1.5 °C) for low- and mid-income countries represent 3.0–3.2% (12–13%) of the climate finance estimated by the OECD in 202128 (see Supplementary Fig. 22 of the Supplementary Information).
Here, we do not consider the option of international financial transfers, but rather focus on domestic financing through dedicated climate fiscal tools. Carbon revenues constitute a fiscal tool that can be redirected to the economy to facilitate double dividends, provide enabling conditions for the low-carbon transition, enhance innovation or remove existing economic distortions. In our assessment with the GEM-E3 model, we assume that carbon revenues will be used to finance the additional R&D needs for each policy scenario as compared to the REF scenario, and that any remaining carbon revenue is directed to lowering payroll taxes. Figure 2 summarizes the results with respect to the financing of the R&D investments.
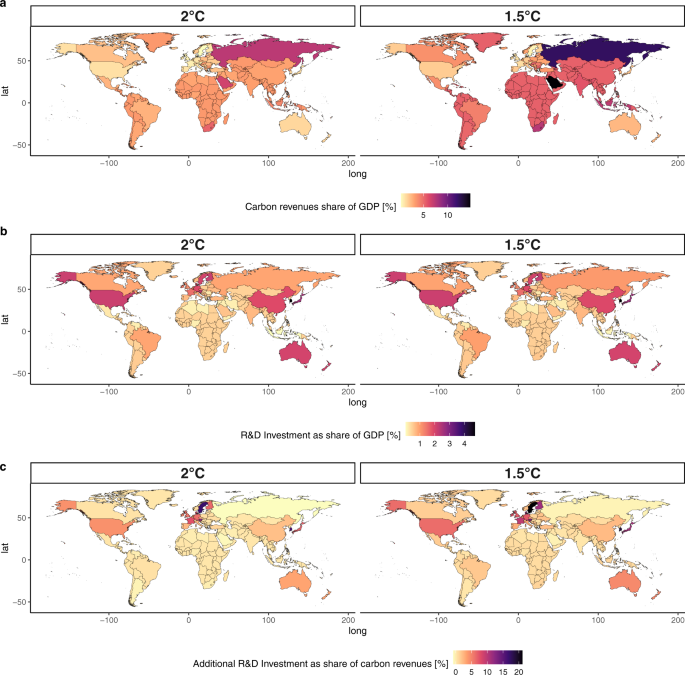
a shows carbon revenues as a percentage share of GDP by country for the 2 temperature targets; b shows the all sector R&D Investment as a share of GDP; c shows the additional all sector R&D Investment expressed as a percentage share of carbon revenues; source: GEM-E3 model. All the panels refer to the year 2050.
Panel a of Fig. 2 shows that carbon revenues as a percentage of GDP vary significantly by country in both carbon budget scenarios, depending on the regional carbon intensity and the respective effort required to achieve the emission reductions. Overall revenues reach 2.5% and 4.1% of global GDP in 2050 in the 2 °C and 1.5 °C scenarios, respectively. In carbon-intensive fossil fuel producing countries, such as Saudi Arabia and Russia, carbon revenues are a much higher share of GDP, reaching 14% in 2050. Figure 2b shows that estimated total R&D investments in all sectors and technologies, including those focus of this study, as a share of GDP in 2050 are similar in the two temperature target scenarios. Importantly, in all regions the estimated total R&D needs, including low-carbon, represent a share of GDP in line with current levels, with the exception of Argentina and South Korea (Supplementary Fig. 20 of the Supplementary Information). In oil exporting countries, Russia, and sub-saharan Africa R&D investment represents a lower GDP share than the current (2019) share of fossil fuels subsidies (Supplementary Fig. 20 of Supplementary Information). In this case, a redirection of government funds would suffice to finance the R&D needed. Achieving stringent policy scenarios requires limited increased R&D investments, as explained above. Figure 2c shows that for the majority of regions, this additional R&D funding is only a small share of carbon revenues, ranging from 0.5% in Argentina to 21% in Sweden in the 1.5 °C scenario. The remaining carbon revenues are redirected to the economy via a reduction of payroll taxes. Our analysis shows that, at the global level, additional R&D investments between the REF and the low-carbon scenarios can be financed using 2% of global carbon revenues. Overall, our results confirm that R&D investments are an efficient strategy for carbon revenue recycling. Once this is combined with the reduction of labor-related taxation, wider co-benefits can emerge. Using carbon revenues to finance low-carbon R&D constitutes an effective way to implement the “polluter pays” principle in practice, allowing even the poorest regions to ensure some financing transactions from the polluters to the clean technology sectors. The optimal trajectory of R&D investments is well aligned with the availability of carbon revenues, given that high carbon revenues are expected in the early years of the mitigation action, when R&D should be more intense. Once the economy decarbonizes, carbon revenues become low, but R&D requirements are less pronounced.
Importantly, our scenario implementation considers only the financing of additional R&D investments through carbon revenues and not the entire amount which also includes the R&D investments of the REF scenario. Conversely, the rest of the R&D investments are financed through the government budget, as in the REF scenario. Financing the entire R&D investments (and not only the additional scenario-related funds) through carbon revenues would amount to 57 and 35% of global carbon revenues in 2050 in the 2 °C and 1.5 °C scenarios, respectively. However, in several countries, carbon revenues would not be sufficient to finance the entire R&D investments, particularly in the 2 °C scenario.
We note that the GEM-E3 analysis does not include the additional R&D investments for energy efficiency improvements that are described in the previous section due to methodological limitations in linking the two models in this respect. To address this limitation, we carried out post-processed calculations to assess if energy efficiency investments could also be financed by the carbon revenues. Indeed, as shown in Supplementary Fig. 16 of the Supplementary Information, all additional R&D investments (i.e., including energy efficiency) can be financed by the carbon revenues. On a regional level, financing the entire R&D investments requires a maximum of 18% (22% in the 1.5 °C scenario) of carbon revenues in 2050. Accounting for energy efficiency R&D investments still allows a large share of carbon revenues to reduce payroll taxes.
Regional macroeconomic effects in major economies
R&D investments lower the costs of clean technologies; this in turn reduces the cost of mitigation. These cost reductions improve overall global economic activity as well as the competitiveness of certain regions. Figure 3 shows regional macroeconomic implications of the optimal R&D strategies in relation to the non-optimal (FIX) ones for both temperature target scenarios estimated with the GEM-E3 model. In the 2 °C scenario, GDP impacts are small as the increase of R&D investments from REF/FIX levels by 2050 is limited for all technologies considered by GEM-E3 model, with the exception of CCS (Fig. 1 panel b). Note that energy efficiency R&D investments are not considered in the GEM-E3 model runs, as discussed above. Globally, small GDP gains are registered in 2030 and 2050. Conversely, at the regional level economic results are more diverse and driven mainly by changes in competitiveness for clean technology goods. For example, Japan shows a GDP loss of 0.23% and South Korea of 0.4% both from the respective 2 °C_FIX levels, due to lower exports of batteries to the benefit of China, while the latter registers a 0.18% increase in GDP in 2050 due to the higher export levels (Supplementary Fig. 10 in the Supplementary Information).
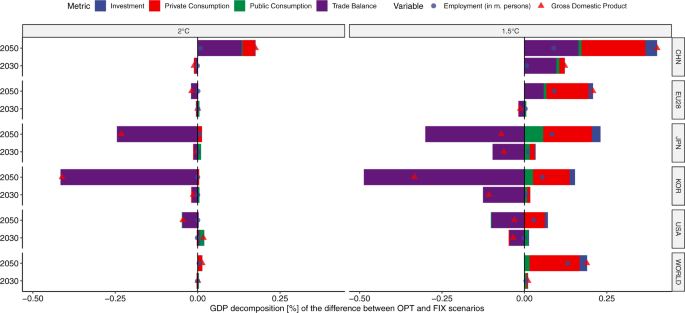
Indicators are shown for selected regions and for both climate targets, source GEM-E3 model.
GDP gains are more pronounced in the more stringent 1.5 °C scenario. Higher R&D investments increase global GDP by 0.2% relative to the REF scenario in 2050 as the low-carbon transition becomes less costly. China is among the countries which benefit most, with an increase of 0.4% in GDP in 2050 relative to 1.5 °C_FIX levels. This arises from the fact that the production of batteries and electric vehicles becomes more competitive and thus increases the supply towards both the domestic and international markets. Similarly, the EU28 sees a 0.25% increase in GDP in 2050, due to both higher export levels (particularly of advanced biofuels) and to higher private consumption levels. In particular, the lower price of electricity and transportation resulting from lower technology costs allows for the consumption of more goods and services as compared to 1.5 °C_FIX levels. Changes in the global advanced biofuels markets account for most of the positive macroeconomic impacts of countries such as Argentina, Indonesia and Brazil, which show GDP gains of 1.2%, 0.7% and 0.13% compared to 1.5 °C_FIX levels in 2050, respectively.
Globally, employment effects are positive as economic activities increase. The induced effects on employment are driving results despite the lower availability of climate-related fiscal revenues to reduce payroll taxes due to the financing of R&D. On a regional level, employment levels are higher than the corresponding FIX levels, even in cases where economic activity falls. Our estimates suggest that financing R&D activities brings a positive direct multiplier effect due to the high labor intensity of the R&D process.
Global climate policy costs with optimal R&D strategies
Optimal R&D strategies improve the feasibility of climate policies by lowering technology costs and thus reducing the level of the required carbon tax and the associated global mitigation cost (i.e., GDP loss as shown in Fig. 4). This result is robust across both models and is more pronounced in the most stringent climate target of 1.5 °C, where emission cuts are faster and deeper: in these cases policy costs drop by 7–19% by mid-century. GEM-E3 results indicate that each $ of R&D invested corresponds to a 1.64 and 8.01 2005$ increase in GDP for a 2 °C and 1.5 °C policies in 2050, respectively. Similarly, for each 2005M$ of R&D investment, 7 and 96 additional people are employed in 2050 for a 2 °C and 1.5 °C policies, respectively.
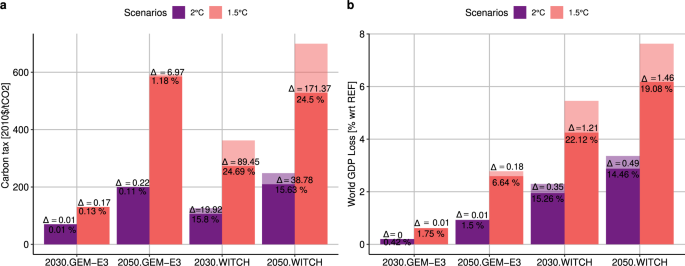
a refers to GEM-E3 and b refers to WITCH. Shaded bars represent the FIX scenarios with frozen R&D investments while full colored bars represent the optimal scenarios. The delta (Δ) represents the value difference between the two. A positive value means higher GDP loss or carbon price in the FIX scenario with frozen R&D investments.