

This has been a relatively slow week in terms of economic news after the Easter break, especially as we await next week’s UK GDP release. But that has also given us time to delve into some interesting but not normally as high-profile statistical releases such as the ONS’s consumer trends dataset, which captures household consumption across different goods and services.
Consumption is viewed by economists generally as one of the most important metrics of the standard of living enjoyed by individuals. Every micro and macroeconomic model puts consumption at its heart, and providing income for consumption is assumed to be the main purpose of work.
These are incredibly broad simplifications, but they reflect a basic truth that people generally desire to be able to afford more of the goods and services that give them utility, and therefore higher consumption generally reflects a higher standard of living.
The chart below broadly reflects this. We can see a rapid improvement in consumer spending from 1997 to 2007, in line with those booming economic times. By 2007, consumption per person was 31% than ten years earlier.
Chart: Consumption per person in the UK in real terms, 2007=100
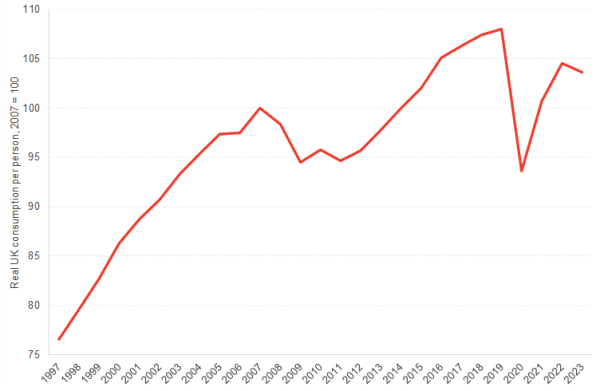
Source: ONS, FAI analysis
The performance since then has much less stellar. Real consumer spending per person was only 3.6% higher in 2023 than in 2007, and remains 4% below the high point of 2019. This reflects a combination of factors, including poor productivity growth and income growth (highly correlated with one another), as well as – in more recent times – higher effective tax rates on personal incomes, which limit disposable income for other expenditure. And of course they also reflect to some extent the higher energy prices faced by households.
This reflects over a decade of stagnation, with the UK economy being increasingly buffeted by shocks but also demonstrating significant structural weaknesses.
One of the more well attested regularities in economics is the relationship between income and food expenditure. Engel’s law suggests that as income grows, food expenditure grows more slowly, and so the share of food expenditure in the total consumption decreases as a country becomes wealthier.
Chart: Food and drink as a share of total UK household consumption
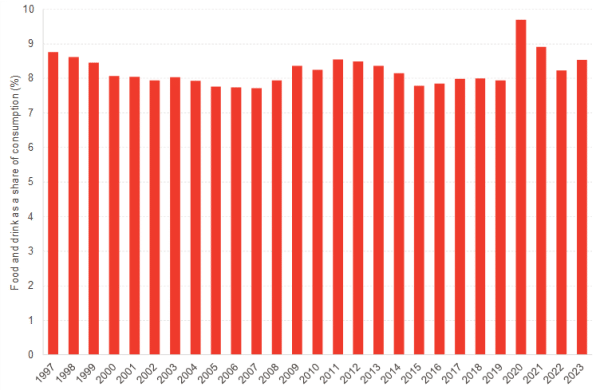
Source: ONS, FAI analysis
As the chart shows, UK food and drink expenditure (excluding meals out and alcohol) dropped progressively from nearly 9% of all consumption in the late 1990s to around 7.7% by 2007. The spike during the pandemic is to be expected, but 2023 showed an increase year-on-year. This is in large part a reflection of food inflation being particularly high: cash spending on food and drink in 2023 was 23% higher than in 2019 on a per person basis, but real spending (after accounting for inflation) was 5% lower.
Overall, progress has stalled, and the picture on food and drink spending ties quite closely with the path in the chart of total consumption per person.
There is a clear break in terms of trends in consumption of transport after the pandemic. In every year from 1997 to 2019, around 14% of consumer spending went on transport – this is now around 12.5%.
This is a huge difference, and even larger in real terms because almost all the increase in spending since 1997 had been through higher prices. In real terms, consumer spending on transport in 2023 was £2,416 per person – 1.5% (£36) less than in 1997, and £471 (16%) less than in 2019.
The decline is across the board. In real terms, spending on buying cars is down 22%, while spare parts and maintenance services are down 21% and 24%, respectively. Fuel is broadly unchanged, however, indicating that miles driven might not be that different, but that people are instead holding onto cars for longer and not maintaining them as often or as thoroughly.
Collective forms of transport have also been hit hard. Rail spending is 31% down on 2019; road (buses, coaches and taxis/private hire) is down 40%; air transport is down 9%; and sea and waterways is down 22%. This no doubt reflects in some part the erosion of establishing commuting patterns, and possibly some substitution towards private car use.
Energy prices in 2023 were 92% higher than in 2019 – an astonishingly fast rise. This has meant electricity and gas posted very large increases in spending and a share of total consumption. 3.6% of all spending by households went on energy, a 52% increase in just four years.
This reflects mostly the increase in prices, but is partly offset by individuals changing their behaviour. But it also reflects higher energy efficiency over time. Looking further back, household energy consumption in real terms was 24% lower in 2019 than in 1997, and 30% lower in 2023 than in that same reference year. Without either, the effect of higher energy prices on household spending would have been even greater.

João is Deputy Director and Senior Knowledge Exchange Fellow at the Fraser of Allander Institute. Previously, he was a Senior Fiscal Analyst at the Office for Budget Responsibility, where he led on analysis of long-term sustainability of the UK’s public finances and on the effect of economic developments and fiscal policy on the UK’s medium-term outlook.


