

U.S. inflation has declined more rapidly than consensus expected, as residual seasonality due to start-of-year price resets fades. We flagged the importance of this dynamic in a previous blog post and in a series of CNBC interviews in March and June. But even beyond this residual seasonality, there are reasons to think inflation will keep moderating. An important driver for further disinflation is the sheer size of COVID-19-related supply disruptions, which rival in severity what Japan experienced in the 2011 Fukushima nuclear disaster. Unlike Japan, where supply chains normalized quickly, delivery times remained stretched for well over a year as the U.S. recovered from the pandemic. Given the severity of disruptions—and their length—we think it is likely that lagged effects from supply chain normalization may still pull inflation down, even though—on the surface—disruptions from the COVID-19 pandemic ended long ago. We present preliminary evidence from the global manufacturing purchasing manager indices (PMIs) to this effect, which we will explore further in coming blog posts.
The COVID-19 inflation aftermath
We have been emphasizing the importance of residual seasonality in U.S. inflation data. Menu costs mean many companies delay raising prices until the start of a new calendar year. When inflation is stable—as it was pre-COVID—seasonal adjustment filters out these start-of-year price resets, which makes seasonally adjusted data a good gauge for inflation momentum. The COVID inflation spike ended that. Start-of-year price resets were larger than normal due to the higher level of overall inflation. Standard seasonal adjustment failed to filter these start-of-year resets out, making inflation in early 2023 and early 2024 look worse than it really was (Figure 1). These start-of-year price resets are concentrated in services, as our “core” services measure that excludes owners’ equivalent rent, health care, and transportation clearly shows (Figure 2, blue bars), consistent with the idea that menu costs keep many small businesses from adjusting prices until the start of a new calendar year.
Figure 1. Start-of-year price reset effect in core CPI m/m inflation since COVID-19
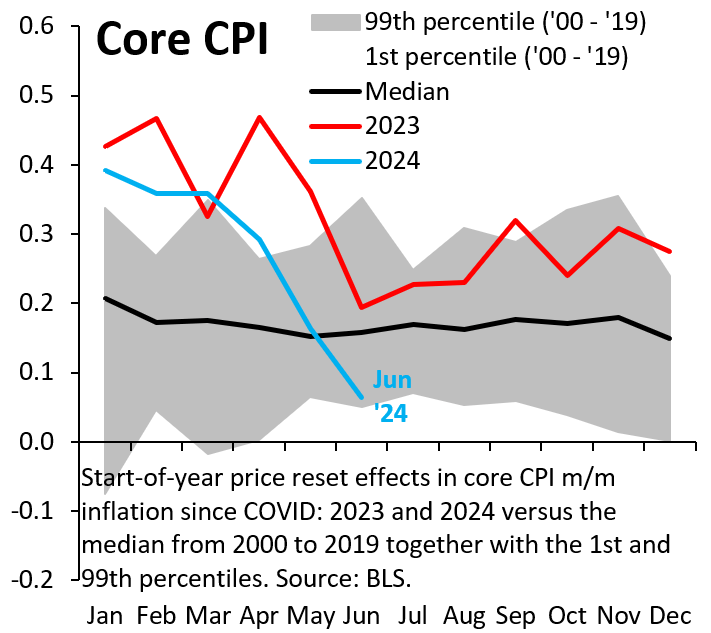
Source: U.S. Bureau of Labor Statistics
Figure 2. Contributions to US core CPI, in % m/m
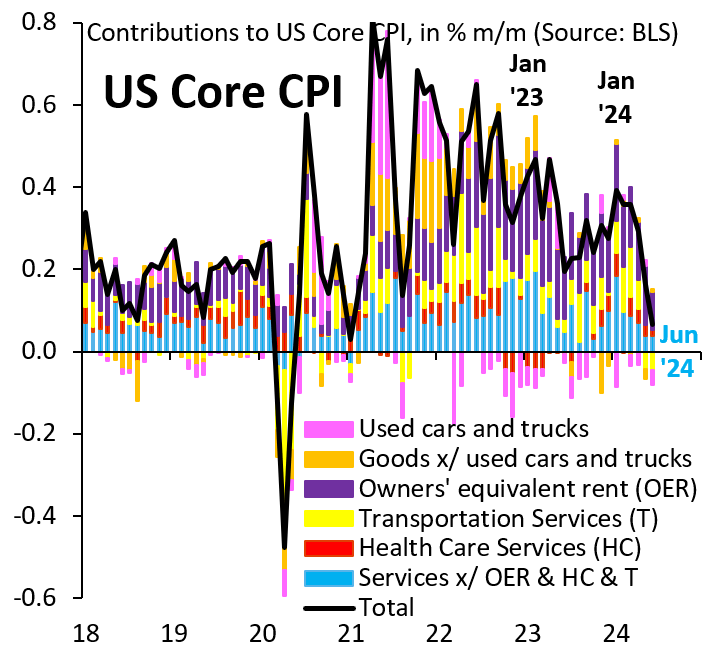
Source: U.S. Bureau of Labor Statistics
While residual seasonality is an important phenomenon, it is also true that this dynamic has—for now—run its course. Our inflation generalization index, which measures the combined weight of all items in the CPI (consumer price index) with month-over-month inflation above 2%, fell to 62% in June 2024 (Figure 3), meaning it is almost back to its pre-COVID average of 60%. The case for continued disinflation therefore likely lies elsewhere and—we think—the severity of COVID supply disruptions suggests lagged effects of supply chain normalization will still play an important role. The global PMI database by S&P Global provides balance of opinion data on delivery times across countries. We transform these data into Z-scores for better comparability. Figure 4 shows that delivery times in the U.S. in the aftermath of COVID-19 were on par with what Japan experienced after the Fukushima nuclear disaster in 2011, only that Japan managed to fix its supply chains quickly, while delivery times in the U.S. remained stretched for over a year.
Figure 3. Inflation generalization in the US
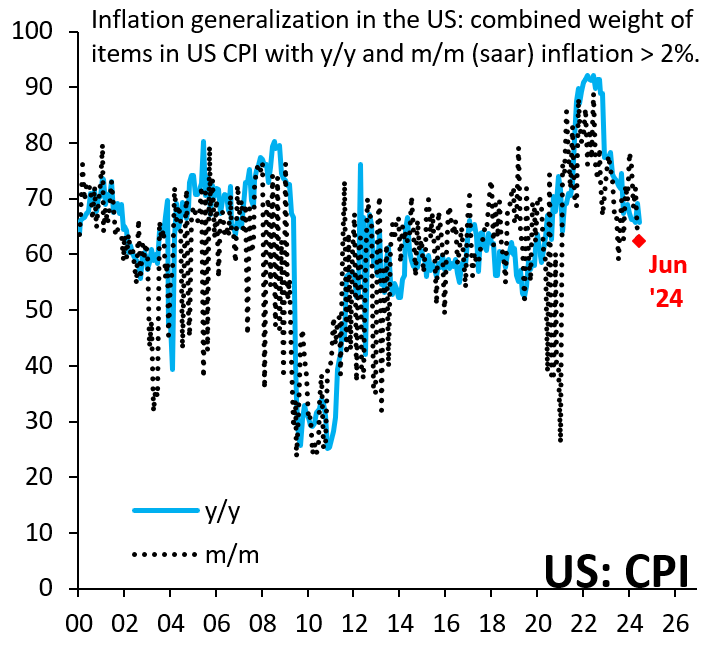
Source: U.S. Bureau of Labor Statistics
Figure 4. Markit manufacturing PMIs: Supplier delivery times expressed as historical Z-scores
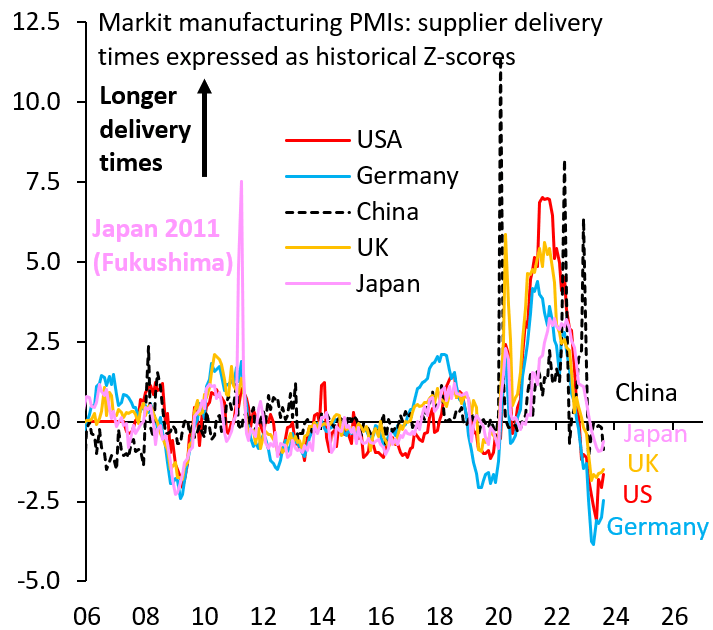
Source: S&P Global
The severity—and length—of COVID supply disruptions holds the key to potential further disinflation, even with supply chains having normalized back in 2022. Bare shelves during the COVID-19 pandemic may have made inventory managers more conservative. That more conservative approach to inventories, in turn, could have generated a wider gap between output prices (where higher prices diminish end demand and therefore boost inventories) and input prices. Figure 5 shows output prices from the global PMIs, which are the prices firms charge customers. Figure 6 shows input prices, which are the prices firms pay suppliers. Output prices rose significantly more than input prices, i.e., firms hiked margins, potentially as a mechanism to better conserve inventory as they grappled with a shock as large and disruptive as the COVID-19 pandemic. (Note that this potential driver of COVID-era margin expansion is distinct from and potentially more plausible than “greedflation.”)
Figure 5. Z-scores for manufacturing PMI output prices in the US, eurozone, and global median across 34 countries
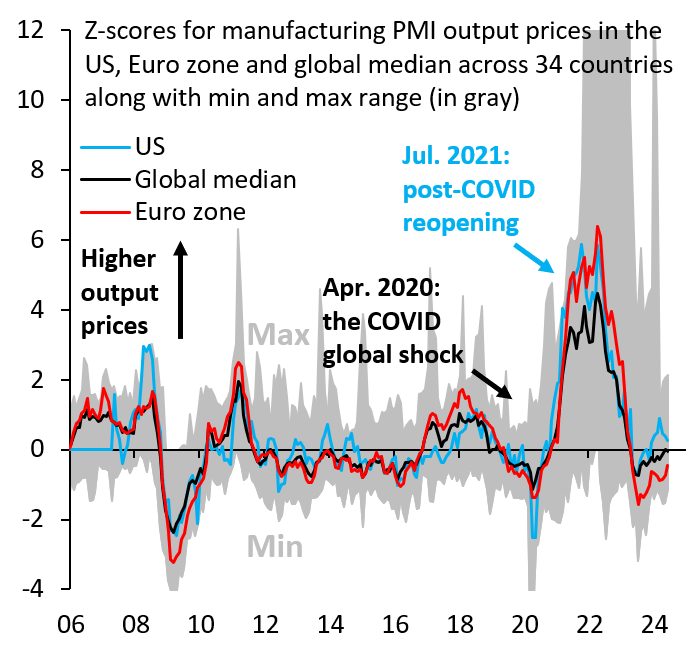
Source: S&P Global
Figure 6. Z-scores for manufacturing PMI input prices in the US, eurozone, and global median across 34 countries
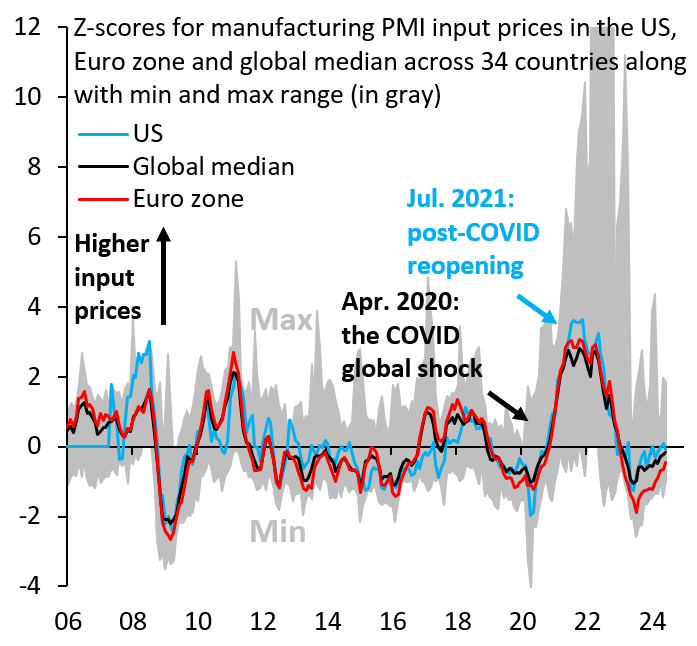
Source: S&P Global
This channel of price inflation is diminishing, however. Despite ongoing geopolitical concerns and some increase in shipping costs recently, salient geopolitical tensions and shipping disruptions in the Panama and Suez canals over the past two years have generally eased relative to their peaks. The implication is that conservative inventory management may also ease further, bringing elevated margins via this effect from COVID-19 down over time.
Lagged effects from supply chain normalization
Figures 7 and 8 compare global PMI delivery times and our proxy for company markups, which we construct as the difference between the Z-scores for output and input prices. While delivery times in the U.S. had fully normalized by Q4 2022, markups only began to fall around one year later and—on some metrics—have yet to fully normalize. This is consistent with our adaptive expectations view on how inventory managers reacted to the COVID shock and subsequent news. Normalizing margins could be one possible driver of continued disinflation, even now that residual seasonality has largely played out for 2024. We will examine lagged effects from supply chain normalization in future posts.
Figure 7. Z-scores for manufacturing PMI delivery times in the US, eurozone, and global media across 34 countries
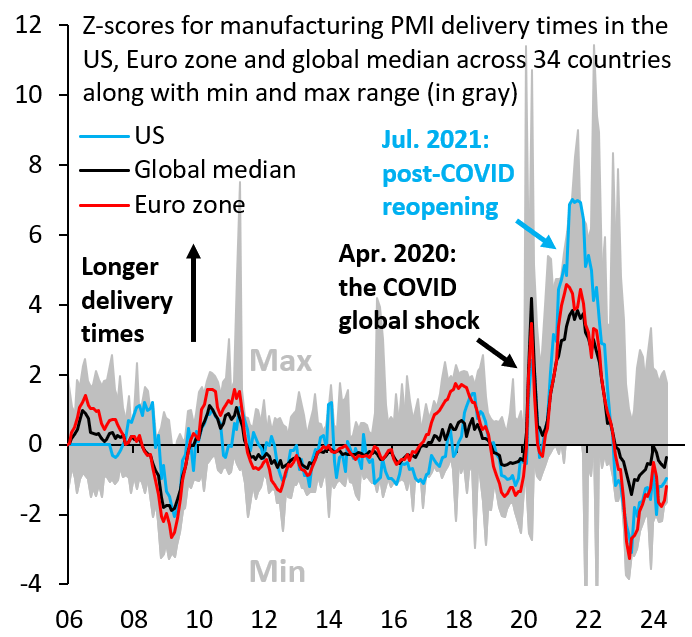
Source: S&P Global
Figure 8. Z-scores for manufacturing PMI output-input prices in the US, eurozone, and global media across 34 countries
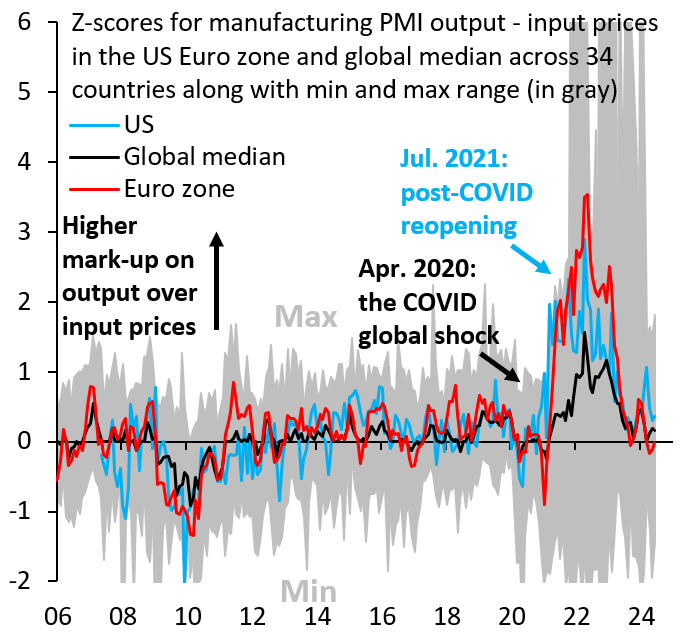
Source: S&P Global


