
The upcoming European Parliament elections taking place on June 6-9, 2024, could have consequences for EU financial markets. Structural changes in the distribution of seats among members of Parliament, particularly across parties and coalitions, may have the potential to shift the direction and momentum of the overall EU economy.[1]
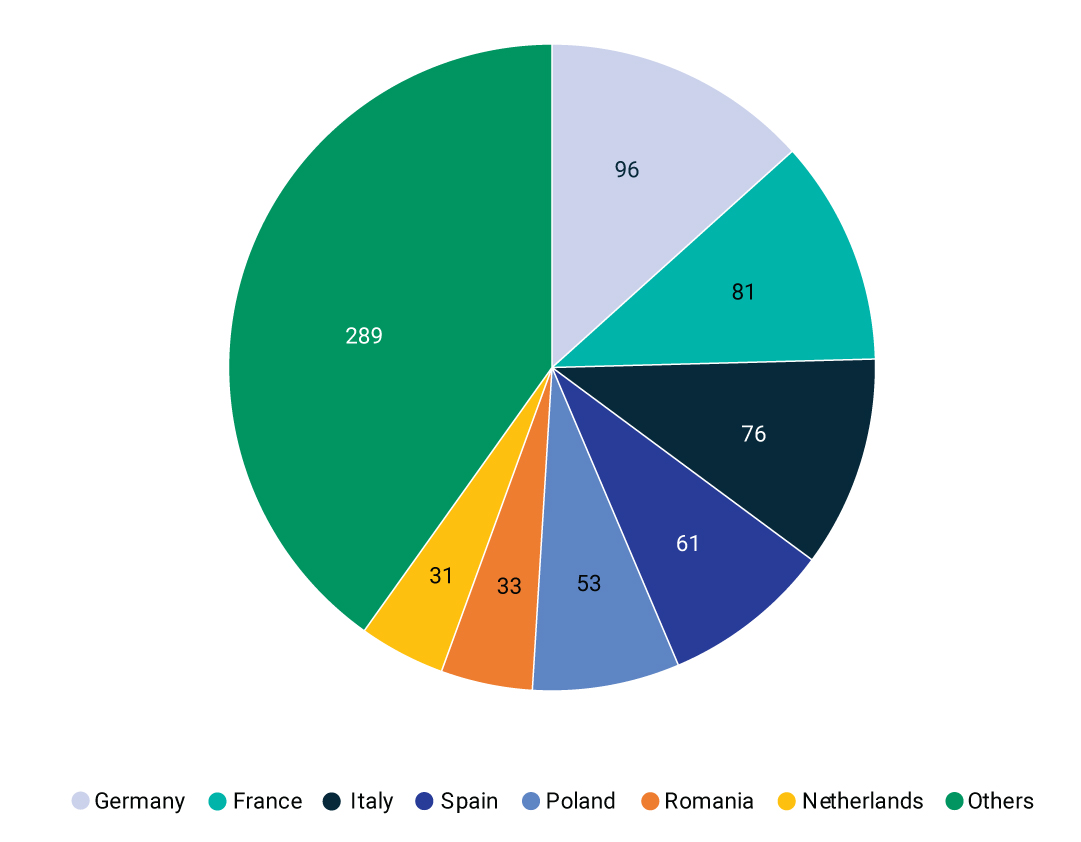
Breakdown of MEP country representation for the 2024-2029 term
As of May 2024, the center-right European People’s Party (EPP) holds the most parliamentary seats, but over the last decade has attracted less support, losing 52 seats in 2014 and another 34 in 2019. While it is expected that the EPP will continue to be the largest party in Parliament, a January 2024 study by the European Council on Foreign Relations predicted a surge in “populist radical right” parties in this year’s election.[2] If this were to materialize, we may see slower progress on EU plans, such as the Economic Security Strategy[3] and Green Deal[4] that remain on the 2024-2029 legislative agenda.
The Economic Security Strategy: Economic dependencies and geopolitical tensions
The Economic Security Strategy aims to capitalize on the EU’s economic openness while reducing risks arising from geopolitical tensions, accelerating technological shifts and economic interdependencies. One goal of the strategy is to promote EU competitiveness and bolster the EU single market.
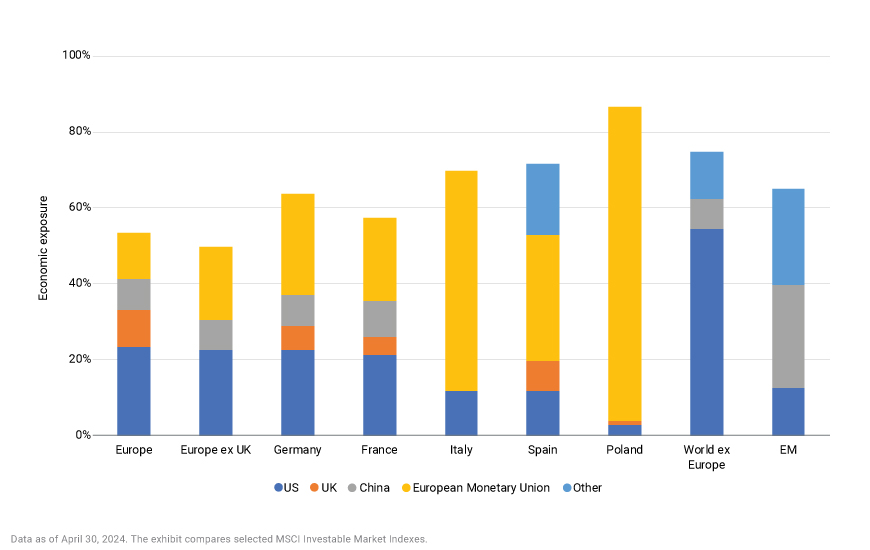
Using MSCI Economic Exposure data, which tracks the geographic distribution of a firm’s revenues, we found that revenue earned by European countries in the U.S. and China markets has grown over the past decade. For instance, Germany’s economic exposure to the U.S. increased to 23% in 2024 from 17% in 2013, and its economic exposure to China increased to 8% from 6% over the same period, while France’s economic exposure to the U.S. increased to 21% from 15% and to China to 9% from 5%.
Maintaining these interdependencies may require rewiring EU companies’ supply chains and nurturing domestic technological progress. The success of these long-term projects will entail attracting capital inflows and maintaining political stability.
Economic exposures of MSCI indexes across Europe and other regions
A potential lack of alignment within the European Parliament, pending the outcome of the upcoming election, could reshape the implementation of the Economic Security Strategy and require reassessment of the economic exposures in investors’ portfolios.
The Green Deal: Ambitions and obstacles
The Green Deal introduced a suite of proposals to implement the EU’s climate, energy, transport and taxation policies with the goal of reducing net greenhouse gas emissions and making Europe the first climate-neutral continent by 2050. To achieve these ambitions, the region will need to maintain and expand capital inflows aligned with this goal.
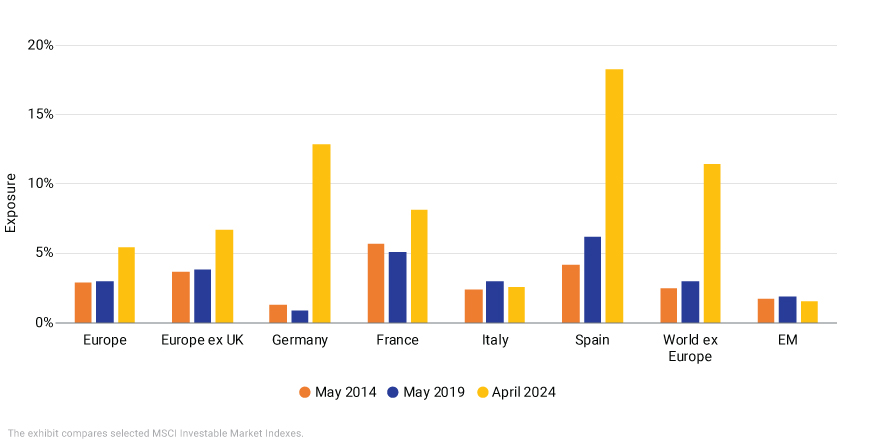
Since May 2014, more European companies have been able to offer low-carbon solutions, particularly in the EU developed markets (DM), although companies in the EU emerging markets (EM) have generally not progressed as far. As of April 30, 2024, green revenue exposures improved, on average, by 41% among the five European countries with the largest representation in Parliament (Germany, France, Italy, Spain and Poland).
Exposures of selected MSCI indexes to companies offering low-carbon solutions
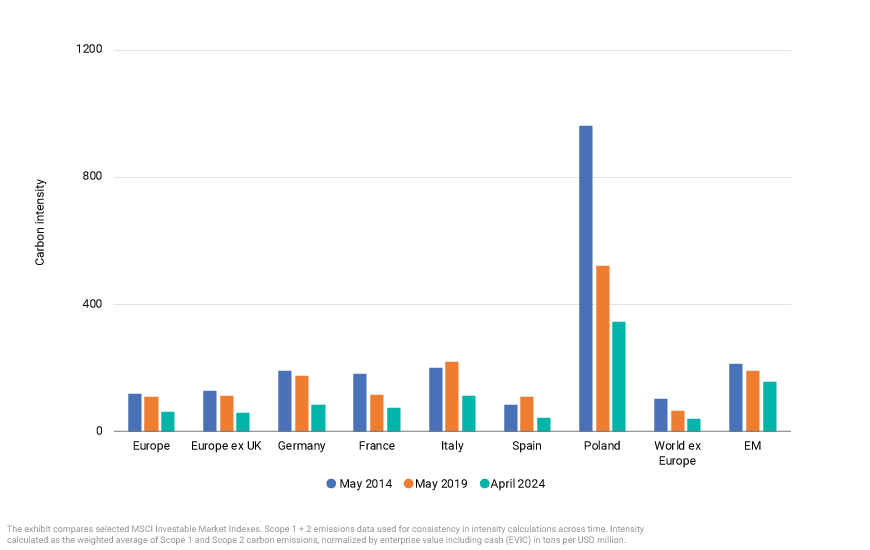
And whereas carbon emissions in Europe decreased, on average, by 45% over the last decade, they were down 28%, on average, across developed and emerging markets outside of Europe.
Carbon intensity to EVIC (Scope 1 + 2) of selected MSCI indexes
If Parliament shifts toward the right after the election, the next steps for the Green Deal may be less clear. These disagreements could impede potential investments in companies that are taking steps in transitioning to the low-carbon real economy, potentially diluting the long-term goals of the Green Deal.
After the election
An anticipated rise of parties to the right of the political spectrum after the upcoming elections could result in a more insular approach in policy making and progress could slow or stall on two key initiatives — the Economic Security Strategy and the Green Deal.
For investors, understanding these dynamics is crucial.
The author would like to thank Stuart Doole for his contributions to this blog post.


