

US Dollar Index Technical Forecast: USD Weekly Trade Levels (DXY)
- US Dollar rallies 1.4% in February, five-week rally extends to multi-month highs
- USD advance testing technical resistance– risk for topside exhaustion / price inflection
- DXY resistance 104.63/77, 106.10, 107.18– Support 102.99-103.49, 101.33, 98.97-99.66
The US Dollar is poised for a fifth consecutive weekly-advance with DXY surging more than 4.3% off the December lows. The rally has been testing technical resistance for the past two-weeks and while the broader outlook remains constructive, the immediate advance may be vulnerable in the days ahead. These are the updated targets and invalidation levels that matter on the DXY weekly technical chart heading into the close January.
Review my latest Weekly Strategy Webinar for an in-depth breakdown of this USD setup and more. Join live on Monday’s at 8:30am EST.
US Dollar Price Chart – USD Weekly (DXY)
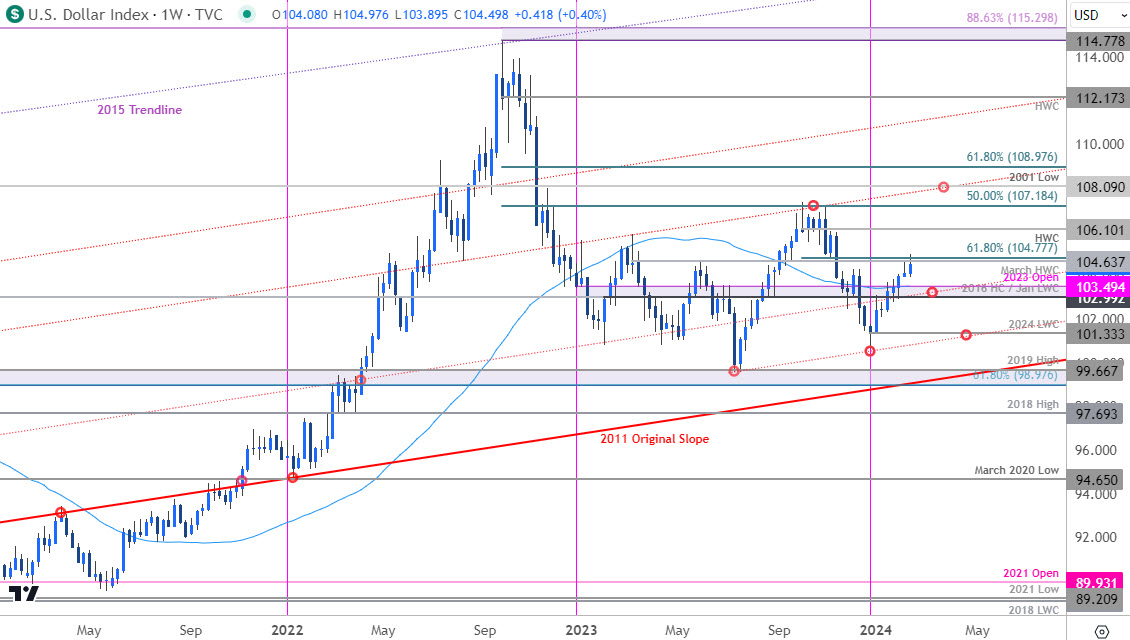
Chart Prepared by Michael Boutros, Sr. Technical Strategist; DXY on TradingView
Technical Outlook: In last month’s US Dollar Technical Forecast we highlighted a key pivot zone at 102.99-103.49– a region defined by the 2016 high close (HC), the January low-week close (LWC), the 52-week moving average, and the objective 2023 yearly-open. Our focus was on possible price inflection into this zone with a topside breach exposing, “resistance objectives at the March high-week close / 61.8% Fibonacci retracement of the October decline at 104.63/77 and the 2023 high-week close (HWC) at 106.10- look for a larger reaction there IF reached.”
A breakout into the start of February has now rallied more than 2% off the monthly low with the advance briefly registering an intraweek high at 104.97 before pulling back. Failure to close above this threshold on Friday raises the threat for some corrective price action here within the broader advance. Weekly support now rests back at 102.99-103.49 with broader bullish invalidation now raised to the January low-week close (LWC) at 101.33.
A topside breach / weekly close above the 104.63/77 resistance zone exposes the next major lateral level at 106.10– still an area of interest for more significant price inflection. Subsequent resistance objectives eyed at the 50% retracement / 2023 high at 107.18/34.

Bottom line: The US Dollar has rallied six of the past eight-weeks with the advance failing at technical resistance for a second week- risk for some exhaustion here. From a trading standpoint, a good region to reduce portions of long-exposure / raise protective stops – losses should be limited by the 103-handle IF price is still heading higher on this stretch. Ultimately, a larger pullback here may offer more favorable entries with a close above 104.77 needed to fuel the next leg higher in the index. Review my latest US Dollar Short-term Outlook for a closer look at the near-term DXY technical trade levels.
Key Economic Data Releases
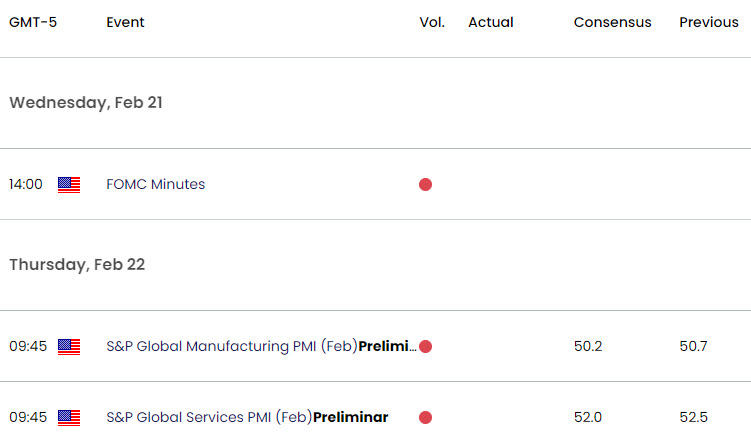
Economic Calendar – latest economic developments and upcoming event risk.
Active Weekly Technical Charts
— Written by Michael Boutros, Sr Technical Strategist with FOREX.com
Follow Michael on X @MBForex

