

US Dollar Talking Points:
- The US Dollar moved down for a test of the 2023 low this week, marking the fifth consecutive weekly decline in DXY.
- The CPI report on Wednesday showed a fall in headline inflation to 5% while Core inflation moved up to 5.6%. The net response was USD-weakness which continued through the Thursday PPI release. The Dollar continued to fall until finally finding support around the same 100.82 level that came into play in early-August.
- I’ll be discussing these themes in-depth in the weekly webinar on Tuesday at 1PM ET. It’s free for all to register: Click here to register.
It was another week of weakness for the US Dollar, with the greenback now working on its fifth consecutive weekly loss. The CPI report on Wednesday was a mixed bag with headline inflation continuing its descent while core inflation increased. The market response was less indecisive, however, as DXY put in a bearish bar on Wednesday and another on Thursday, after the PPI release showed a continued fall in producer inflation. With PPI considered to be a leading variable of consumer inflation, combined with the softer read on headline CPI the day before, USD bears made an aggressive push to craft a fresh 2023 low.
There wasn’t much continuation after that, however, and a bounce developed on Friday that helped to soften the low on the weekly bar.
At this point, there’s a possible double bottom formation if that support can hold in the USD around the 100.87 level in DXY. Double bottoms are often approached with the aim of bearish reversal, but for the formation to come to fruition there’d need to be a bullish breach of the neckline, which is the high point between the two lows. If that doesn’t take place before the lows are taken out, the formation is invalidated, so if this is going to come to fruition, USD bulls have some work to do – which would have some relation with the backdrop in EUR/USD that I’ll look at in a moment.
US Dollar – DXY Weekly Price Chart (indicative only, not available on Forex.com platforms)
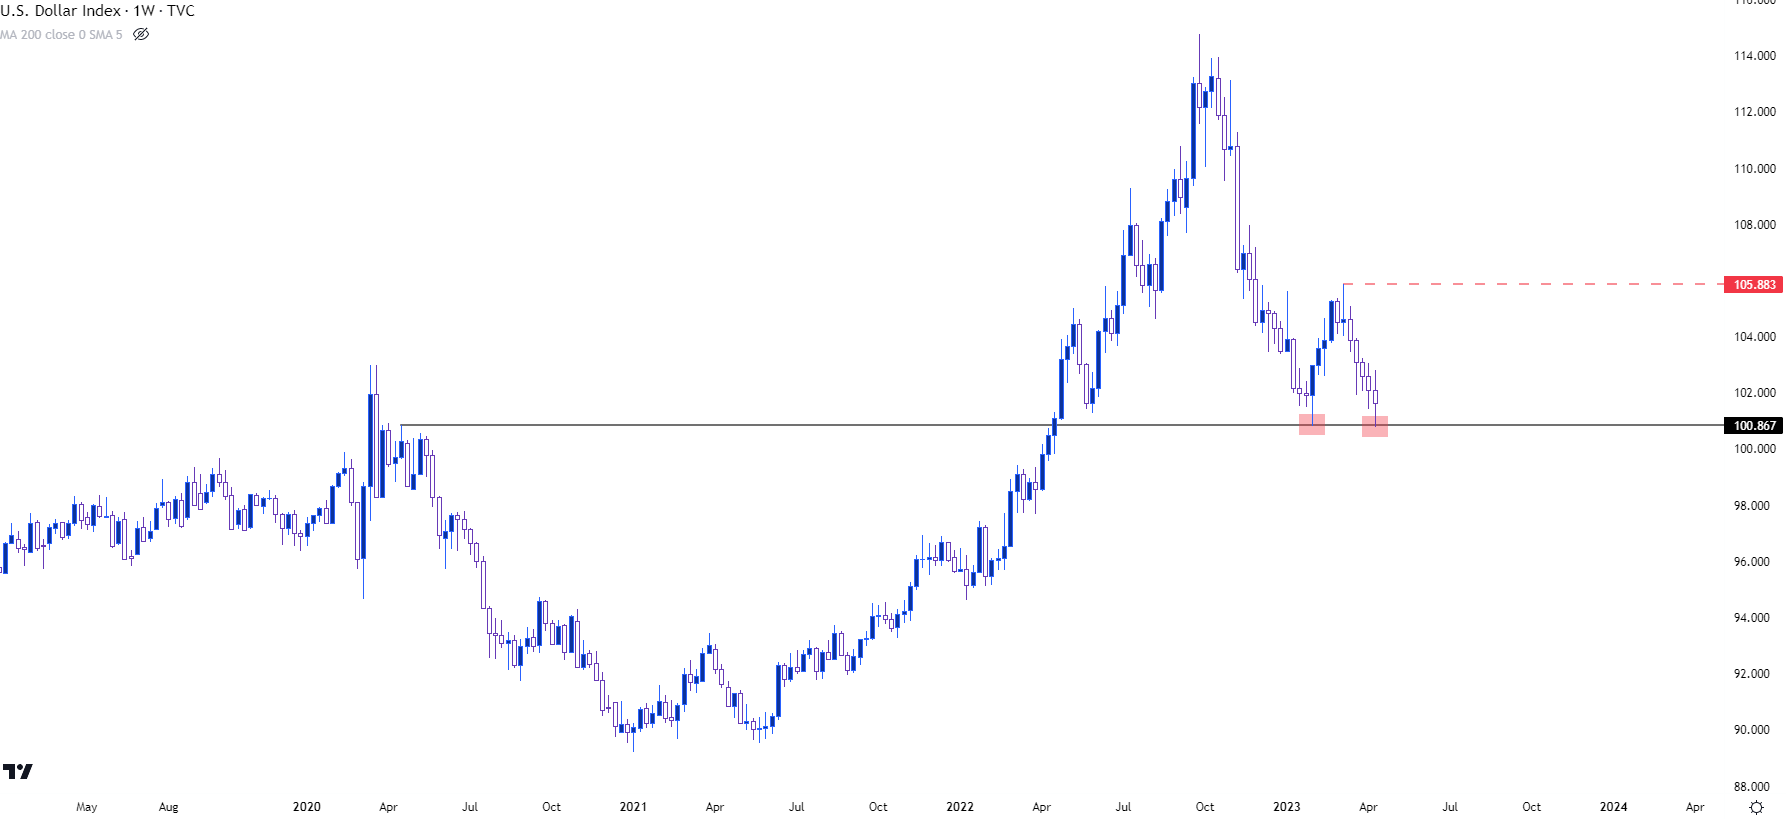 Chart prepared by James Stanley; data derived from Tradingview
EUR/USD Resistance
I wrote about this on Monday as EUR/USD was angling up towards a resistance test. That resistance zone is rather large and has had some element of impact on the pair’s price action over the past couple of months.
Of interest here is the driver(s), as there was verbiage from ECB members this week that took on a hawkish tone, particularly after the Wednesday CPI report. This continues the theme of the ECB showing on a more hawkish appearance than what we’ve seen around the Fed, which has helped EUR/USD to further recover as Euro rates get priced-up and US rates get priced-down. The big question, of course, is one of continuation, as trends in rates can remain just as uncertain as trends in currency pairs.
Regarding the trend in EUR/USD, bulls have thus far been unable to hold the move above the 1.1000 psychological level, which is like what happened in February.
The pair hasn’t reversed, as of this writing, as the morning pullback saw prices find support at a familiar level of 1.0973. This is the swing high from the prior week, and that level was also confluent with the mid-line of a bullish channel.
EUR/USD Four-Hour Price Chart
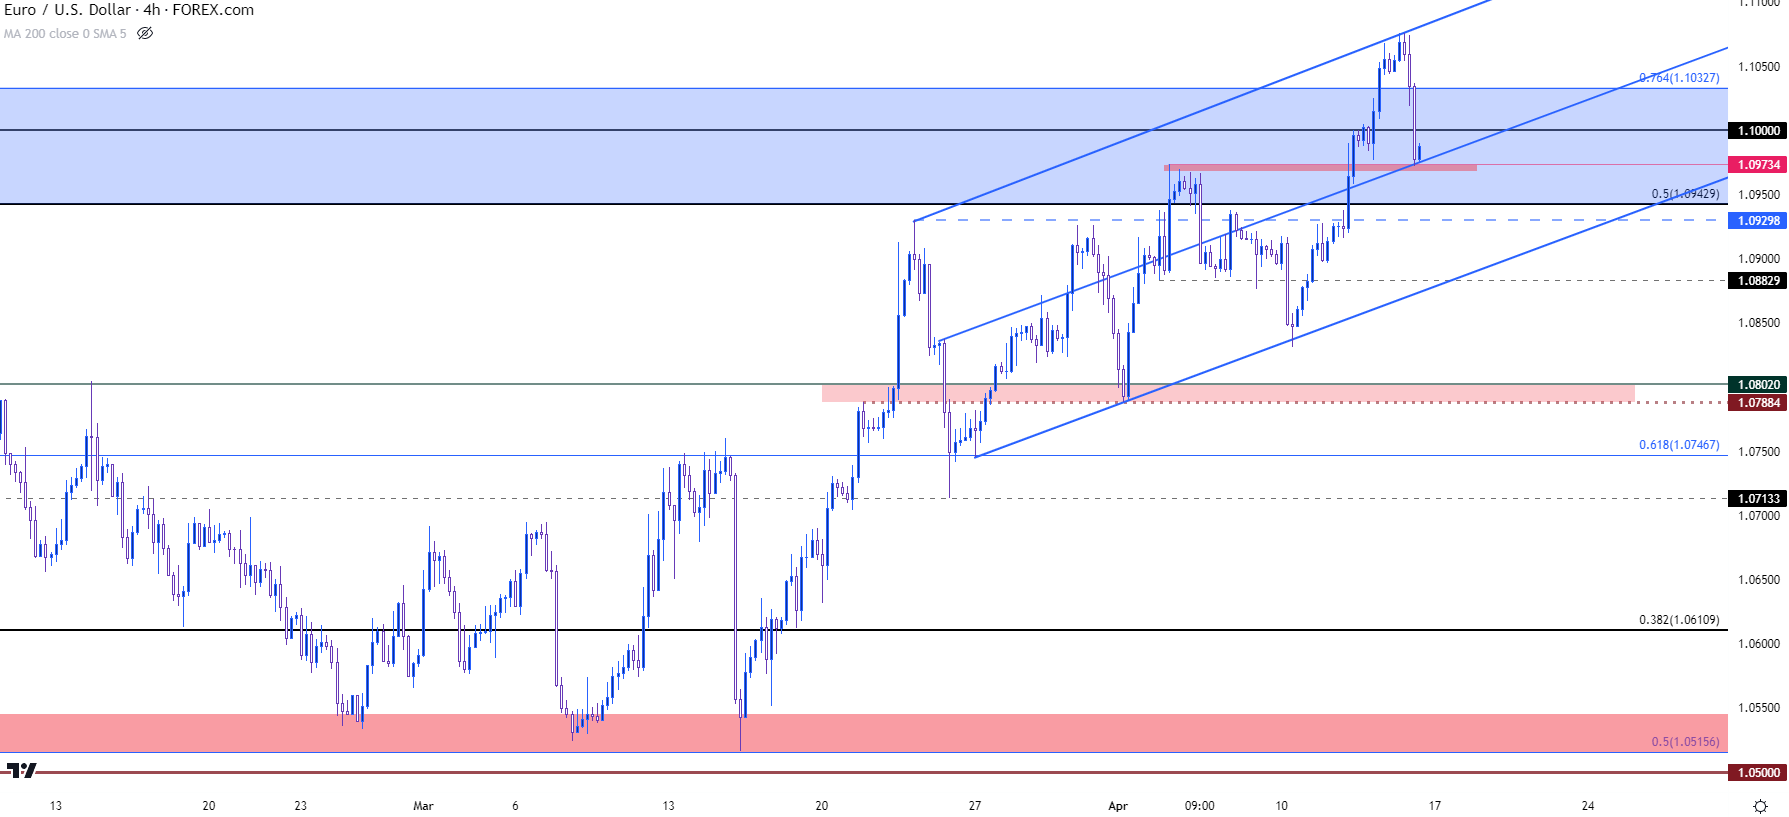
Chart prepared by James Stanley, EUR/USD on Tradingview
GBP/USD
GBP/USD similarly put in a breakout earlier in the week only to pullback below a big figure on Friday. In GBP/USD, the price of interest is the 1.2500 handle, which saw its first test since June of last year. This was an extension of a bull flag formation that was in-play coming into this week.
Last week saw the pair fail at the 1.2500 level which led to a sizable pullback, with support finally setting on Monday. After that support test, however, bulls made a fast move for fresh highs that came into play on Thursday morning.
I wrote about the matter on Thursday, saying “From shorter-term charts, there’s even been a show of support at that 1.2500 spot, which as of this writing, has held the lows; but it does bring to question continuation potential after a really strong move had already developed this week.” I later went on to say, “After that level, it’s the 1.2398 price, and a breach of that can begin to bring question to bullish continuation scenarios.”
Friday saw price pull back to that level but it did not give way – and this can possibly keep the door open for bulls next week. There are a couple of drivers to consider, with UK employment numbers due on Tuesday and CPI due on Wednesday. Inflation remains an issue in the UK after last month’s 10.4% headline CPI read, with expectations for a 9.8% reading next Wednesday.
GBP/USD Four-Hour Price Chart
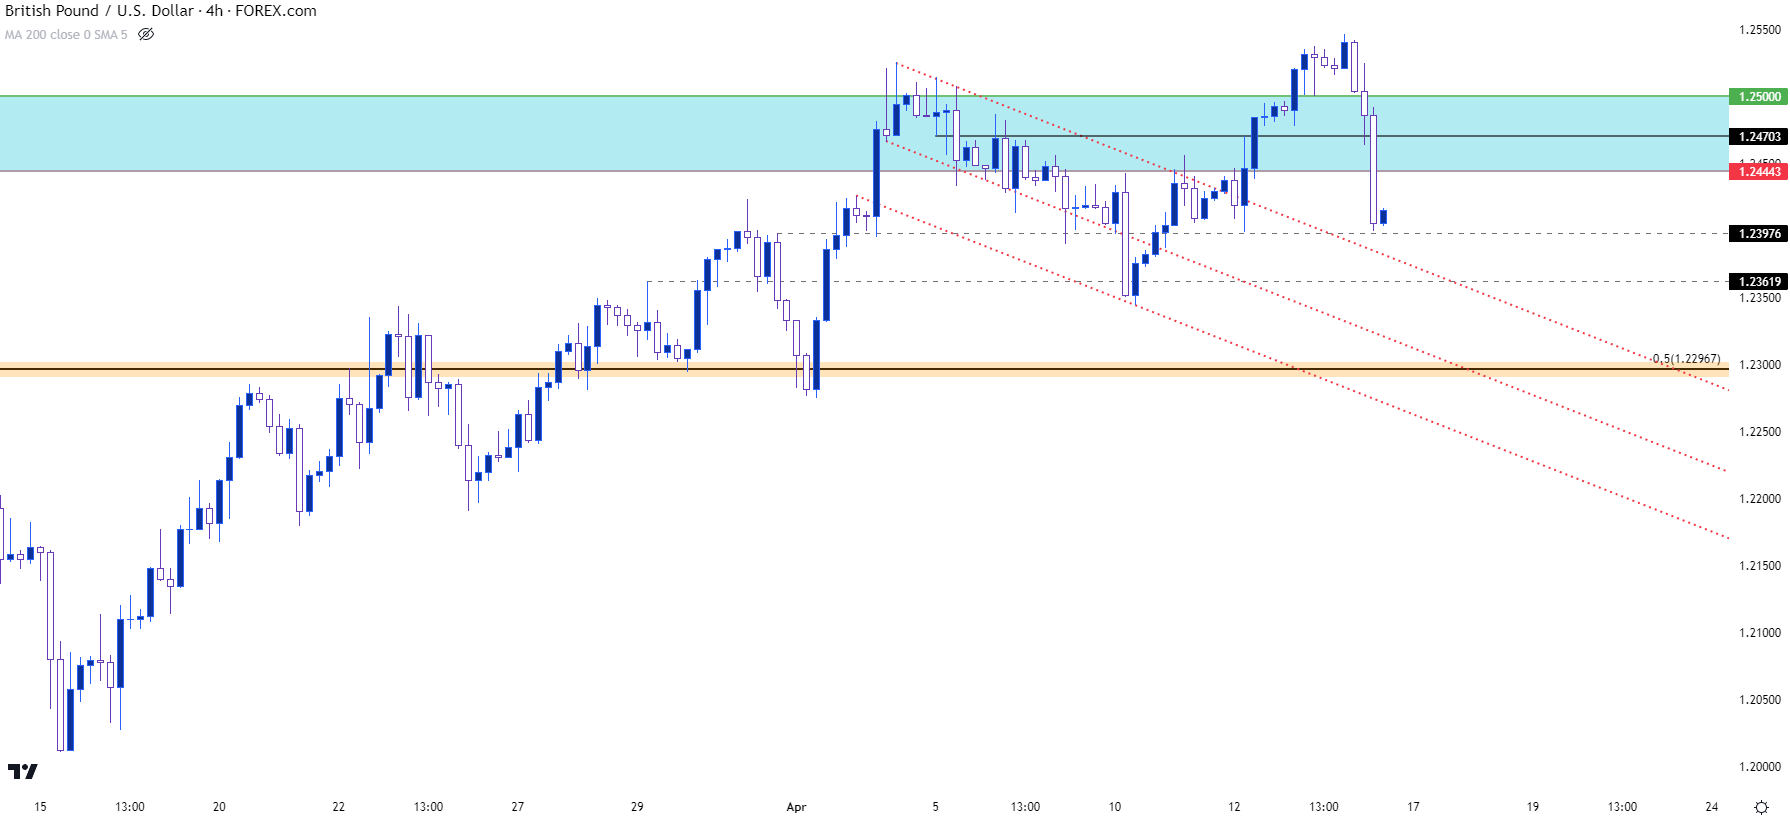
Chart prepared by James Stanley, GBP/USD on Tradingview
USD/CAD
USD/CAD put in a bearish outlay last week and this pushes price closer to range support. Price in the pair has been mean-reverting since last September and there’s already been a previous show of support around the Fibonacci level plotted at 1.3338, which came back into the picture during the week. Below that is the seven-month low at 1.3224.
For a pair that’s shown a tendency to range over the past half-year, the recent trend in USD/CAD has been hurried to the downside, which brings to the equation the potential for short-term reversals, as highlighted by the falling wedge that’s built so far through April trade.
USD/CAD Daily Price Chart
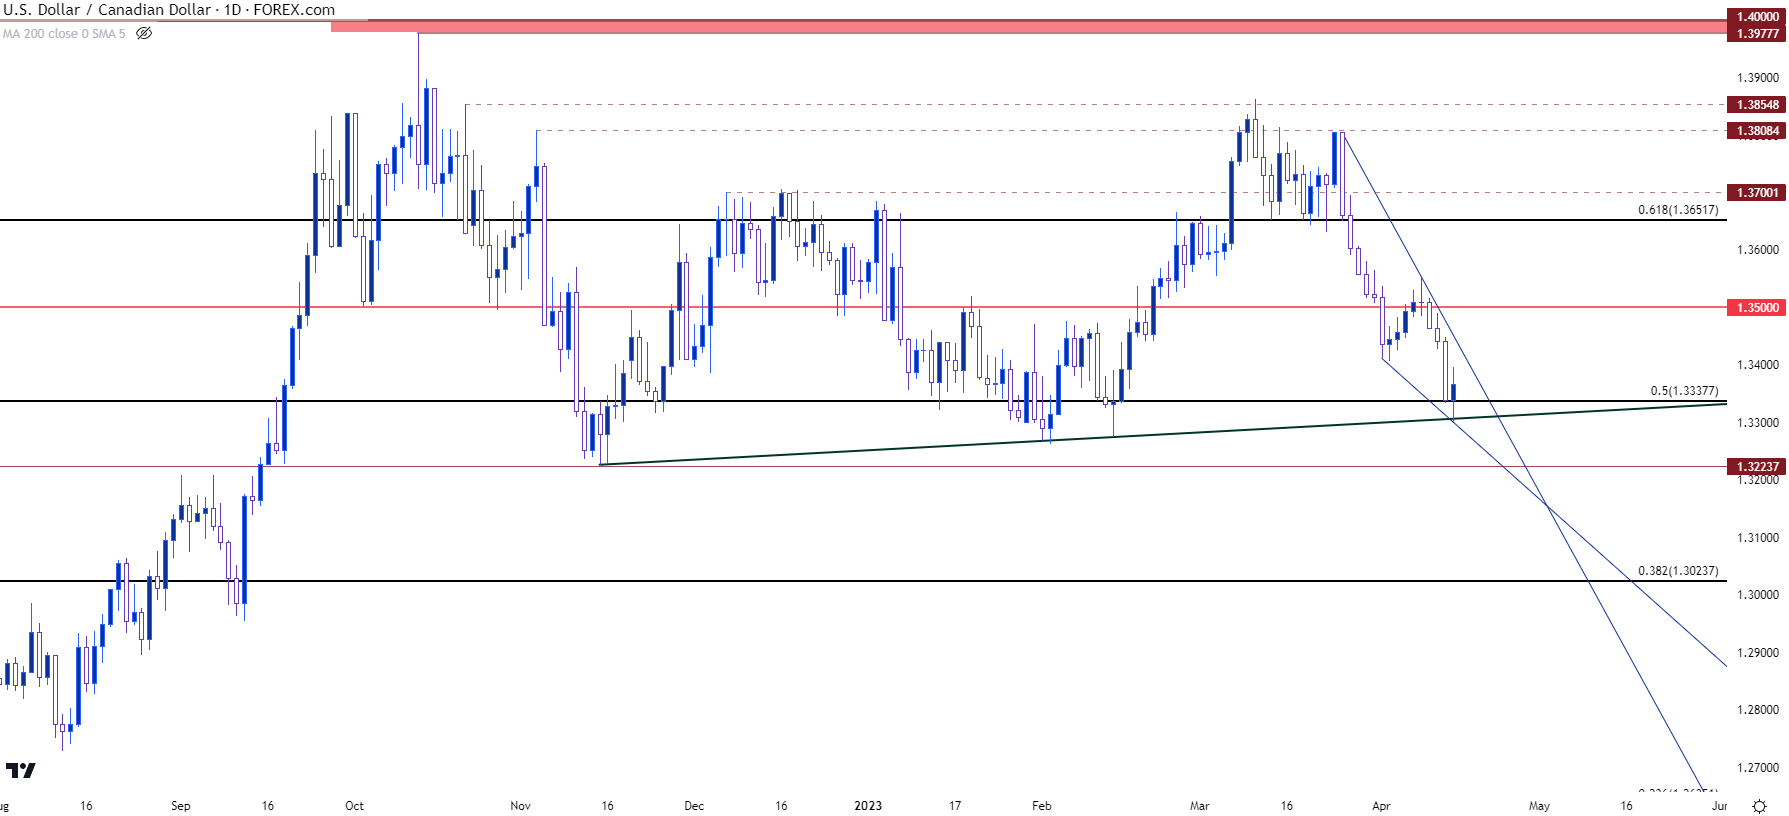
Chart prepared by James Stanley, USD/CAD on Tradingview
USD/JPY
USD/JPY went up for a re-test of the 133.76 level this week, on a couple of occasions. The first failed break led to a pullback to a familiar level at 132.21, which helped to hold support to allow for another test of 133.76 on Friday.
This keeps the door open for bullish breakout potential with price showing an ascending triangle formation, taken from the progressive build of higher lows to go along with that horizontal resistance at 133.76. The next resistance sitting overhead is another familiar price, at the 135.00 psychological level, which had shown resistance in mid-March just before sellers drove down to a fresh lower-low around the 130.00 handle.
USD/JPY Four-Hour Chart
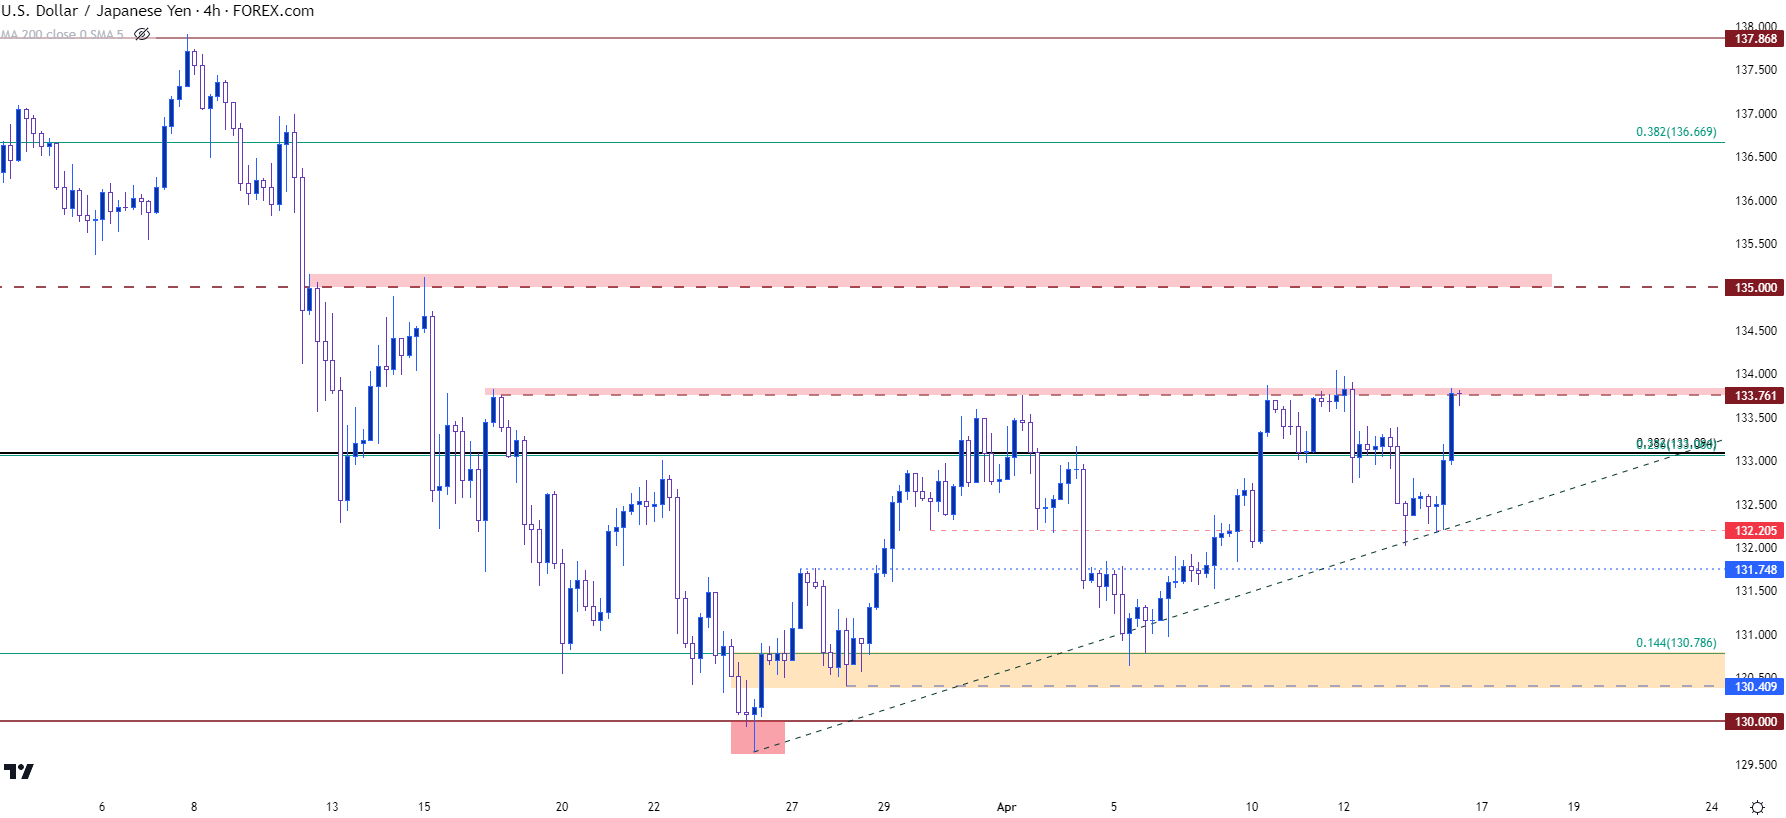
Chart prepared by James Stanley, USD/JPY on Tradingview
— written by James Stanley, Senior Strategist

