

You have reached your limit of 5 free articles for this month.
Get Premium without limits for only $9.99 for the first month
Access all our articles, insights, and analysts.
Your coupon code
- The Pound Sterling advanced to five-week highs against the Dollar this week.
- GBP/USD has so far met decent resistance around 1.2700.
- Next on tap for Cable will be the release of UK inflation figures.
The British Pound (GBP) exhibited a bullish trend throughout the week and managed to advance to fresh five-week peaks around 1.2700 against the US Dollar (USD). This encouraged GBP/USD to close its third week of gains out of the last four ones, leaving behind at the same the key 200-day SMA at 1.2539.
Simultaneously, Cable’s price action followed the resurgence of a marked selling pressure in the Greenback, as investors continued to reprice the likelihood of the start of the Fed’s easing programme in September.
UK inflation comes to the fore
Contributing to the optimism around the British pound, the UK labour market delivered mixed results, while the focus of attention is now expected to gradually shift to the publication of UK inflation figures tracked by the Consumer Price Index (CPI) due on Wednesday.
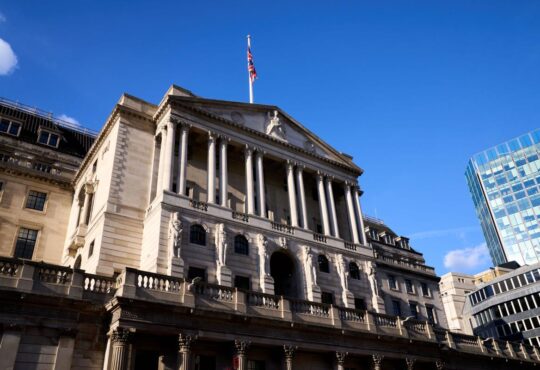
The continuation of the downtrend in UK consumer prices should put the Bank of England (BoE) under extra pressure to start considering reducing its policy rate at some point over the summer, as hinted by some BoE-speak this week.
BoE: To cut now or later?
Still around the BoE, and despite the fact that the UK’s job market remains tight by historical standards, Chief Economist Huw Pill indicated earlier in the week that it may be able to contemplate decreasing interest rates during the summer. In addition, his colleague Megan Greene argued that the central bank should wait for more clear evidence that high inflation pressures in the country are becoming less stubborn before moving to decrease interest rates.
On this, money markets are putting in a 55% possibility of a rate drop in June.
The above came to reinforce comments from Governor Andrew Bailey, who indicated a preference for lowering rates in the coming quarters and highlighted recent inflation improvements.
On another front, data from the advanced PMIs, both in the Manufacturing and Services sectors, as well as UK Retail Sales, should also collaborate with the very near-term price action around the pair.
GBP/USD: Technical Outlook
By surpassing the key 200-day SMA at 1.2539, GBP/USD has now opened the door to potential extra gains in the short-term horizon, along with the change to a more constructive outlook.
That said, the so-far May top at 1.2700 (May 16) is being identified as the upcoming resistance level. Closely following this level emerges the April peak of 1.2709 (April 9), prior to the weekly high of 1.2803 (March 21), and the 2024 top of 1.2893 (March 8). Further up comes the weekly peak of 1.2995 (July 27, 2023), just below the psychological 1.3000 yardstick.
On the flip side, there is a key contention zone at the 200-day SMA of 1.2539. Once Cable clears this region, it could embark on a potential test of the 2024 bottom of 1.2299 (April 22), seconded by the weekly low of 1.2187 (November 10, 2023), and the October 2023 low of 1.2037, all ahead of the relevant support of 1.2000.
On the daily chart, the Relative Strength Index (RSI) improved to around 63.
British Pound PRICE Today
The table below shows the percentage change of British Pound (GBP) against listed major currencies today. British Pound was the strongest against the Swiss Franc.
| USD | EUR | GBP | JPY | CAD | AUD | NZD | CHF | |
|---|---|---|---|---|---|---|---|---|
| USD | -0.06% | -0.25% | -0.06% | -0.09% | -0.15% | -0.16% | 0.10% | |
| EUR | 0.06% | -0.19% | 0.02% | -0.02% | -0.07% | -0.09% | 0.17% | |
| GBP | 0.25% | 0.19% | 0.20% | 0.17% | 0.13% | 0.09% | 0.35% | |
| JPY | 0.06% | -0.02% | -0.20% | -0.06% | -0.10% | -0.14% | 0.15% | |
| CAD | 0.09% | 0.02% | -0.17% | 0.06% | -0.05% | -0.07% | 0.19% | |
| AUD | 0.15% | 0.07% | -0.13% | 0.10% | 0.05% | -0.02% | 0.23% | |
| NZD | 0.16% | 0.09% | -0.09% | 0.14% | 0.07% | 0.02% | 0.26% | |
| CHF | -0.10% | -0.17% | -0.35% | -0.15% | -0.19% | -0.23% | -0.26% |
The heat map shows percentage changes of major currencies against each other. The base currency is picked from the left column, while the quote currency is picked from the top row. For example, if you pick the British Pound from the left column and move along the horizontal line to the US Dollar, the percentage change displayed in the box will represent GBP (base)/USD (quote).
- The Pound Sterling advanced to five-week highs against the Dollar this week.
- GBP/USD has so far met decent resistance around 1.2700.
- Next on tap for Cable will be the release of UK inflation figures.
The British Pound (GBP) exhibited a bullish trend throughout the week and managed to advance to fresh five-week peaks around 1.2700 against the US Dollar (USD). This encouraged GBP/USD to close its third week of gains out of the last four ones, leaving behind at the same the key 200-day SMA at 1.2539.
Simultaneously, Cable’s price action followed the resurgence of a marked selling pressure in the Greenback, as investors continued to reprice the likelihood of the start of the Fed’s easing programme in September.
UK inflation comes to the fore
Contributing to the optimism around the British pound, the UK labour market delivered mixed results, while the focus of attention is now expected to gradually shift to the publication of UK inflation figures tracked by the Consumer Price Index (CPI) due on Wednesday.
The continuation of the downtrend in UK consumer prices should put the Bank of England (BoE) under extra pressure to start considering reducing its policy rate at some point over the summer, as hinted by some BoE-speak this week.
BoE: To cut now or later?
Still around the BoE, and despite the fact that the UK’s job market remains tight by historical standards, Chief Economist Huw Pill indicated earlier in the week that it may be able to contemplate decreasing interest rates during the summer. In addition, his colleague Megan Greene argued that the central bank should wait for more clear evidence that high inflation pressures in the country are becoming less stubborn before moving to decrease interest rates.
On this, money markets are putting in a 55% possibility of a rate drop in June.
The above came to reinforce comments from Governor Andrew Bailey, who indicated a preference for lowering rates in the coming quarters and highlighted recent inflation improvements.
On another front, data from the advanced PMIs, both in the Manufacturing and Services sectors, as well as UK Retail Sales, should also collaborate with the very near-term price action around the pair.
GBP/USD: Technical Outlook
By surpassing the key 200-day SMA at 1.2539, GBP/USD has now opened the door to potential extra gains in the short-term horizon, along with the change to a more constructive outlook.
That said, the so-far May top at 1.2700 (May 16) is being identified as the upcoming resistance level. Closely following this level emerges the April peak of 1.2709 (April 9), prior to the weekly high of 1.2803 (March 21), and the 2024 top of 1.2893 (March 8). Further up comes the weekly peak of 1.2995 (July 27, 2023), just below the psychological 1.3000 yardstick.
On the flip side, there is a key contention zone at the 200-day SMA of 1.2539. Once Cable clears this region, it could embark on a potential test of the 2024 bottom of 1.2299 (April 22), seconded by the weekly low of 1.2187 (November 10, 2023), and the October 2023 low of 1.2037, all ahead of the relevant support of 1.2000.
On the daily chart, the Relative Strength Index (RSI) improved to around 63.
British Pound PRICE Today
The table below shows the percentage change of British Pound (GBP) against listed major currencies today. British Pound was the strongest against the Swiss Franc.
| USD | EUR | GBP | JPY | CAD | AUD | NZD | CHF | |
|---|---|---|---|---|---|---|---|---|
| USD | -0.06% | -0.25% | -0.06% | -0.09% | -0.15% | -0.16% | 0.10% | |
| EUR | 0.06% | -0.19% | 0.02% | -0.02% | -0.07% | -0.09% | 0.17% | |
| GBP | 0.25% | 0.19% | 0.20% | 0.17% | 0.13% | 0.09% | 0.35% | |
| JPY | 0.06% | -0.02% | -0.20% | -0.06% | -0.10% | -0.14% | 0.15% | |
| CAD | 0.09% | 0.02% | -0.17% | 0.06% | -0.05% | -0.07% | 0.19% | |
| AUD | 0.15% | 0.07% | -0.13% | 0.10% | 0.05% | -0.02% | 0.23% | |
| NZD | 0.16% | 0.09% | -0.09% | 0.14% | 0.07% | 0.02% | 0.26% | |
| CHF | -0.10% | -0.17% | -0.35% | -0.15% | -0.19% | -0.23% | -0.26% |
The heat map shows percentage changes of major currencies against each other. The base currency is picked from the left column, while the quote currency is picked from the top row. For example, if you pick the British Pound from the left column and move along the horizontal line to the US Dollar, the percentage change displayed in the box will represent GBP (base)/USD (quote).
