U.S. trade deficits hit record highs in 2021: More effective trade, industrial, and currency policies are needed to create more domestic manufacturing jobs

The U.S. goods trade deficit reached a record $1.09 trillion in 2021—an increase of $168.7 billion (18.3%) from the 2020 trade deficit—according to new U.S. Census Bureau data. The broader goods and services deficit reached $859.1 billion in 2021, an increase of $182.5 billion (27.0%). These records were driven by a $576.5 billion increase in goods and services imports, including a $501.8 billion increase in goods imports.
The surge in the U.S. goods trade deficit extends a surge in offshoring that has eliminated more than 5 million manufacturing jobs and nearly 70,000 factories since 1998, with overlooked costs for Black workers and other workers of color, as we describe in this new EPI report.
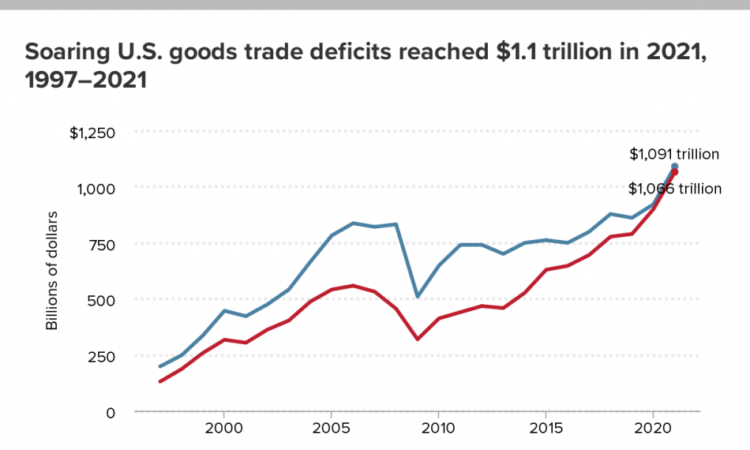
While both imports and exports were depressed in 2020 due to the COVID recession, U.S. trade deficits increased sharply in both 2020 and 2021, as shown in the figure below. This is because the United States was unable to produce the goods needed to respond to the pandemic and to meet increased domestic demand for consumer goods.
However, contrary to popular opinion, the growth in U.S. imports was not just caused by increased domestic goods consumption coming out of the 2020 COVID recession. Imports explained more than 60% of the growth in U.S. goods consumption in 2021, and U.S. goods imports increased faster (21.3%) than domestic goods consumption (17.8%).
Soaring U.S. goods trade deficits reached $1.1 trillion in 2021, 1997–2021
| U.S. goods trade deficit | Manufacturing trade deficit | |
|---|---|---|
| 1997 | $198.4 | $130.7 |
| 1998 | $248.2 | $186.5 |
| 1999 | $337.1 | $259.0 |
| 2000 | $446.8 | $317.2 |
| 2001 | $422.4 | $304.1 |
| 2002 | $475.20 | $362.6 |
| 2003 | $541.60 | $403.1 |
| 2004 | $664.80 | $487.4 |
| 2005 | $782.80 | $541.4 |
| 2006 | $837.30 | $558.5 |
| 2007 | $821.20 | $532.1 |
| 2008 | $832.50 | $456.1 |
| 2009 | $509.70 | $319.3 |
| 2010 | $648.70 | $412.6 |
| 2011 | $741.00 | $440.5 |
| 2012 | $741.10 | $467.7 |
| 2013 | $700.50 | $458.8 |
| 2014 | $749.90 | $526.9 |
| 2015 | $761.90 | $629.8 |
| 2016 | $749.80 | $647.3 |
| 2017 | $799.30 | $695.5 |
| 2018 | $878.70 | $777.4 |
| 2019 | $861.50 | $789.4 |
| 2020 | $922.00 | $900.1 |
| 2021 | $1,090.70 | $1,066.3 |
Source: EPI analysis of Census Bureau and the USITC trade data.
Growing trade deficits have hurt U.S. manufacturing output and employment during the recovery, contributing to the net loss of 226,000 U.S. manufacturing jobs since December 2019. Federal relief spending is leaking away from domestic producers and supporting job creation in other countries.
U.S. trade deficits are almost entirely explained (98.8%) by the deficit in manufactured products, as shown in the figure above, in part because the United States has become a net exporter of crude oil and refined petroleum products over the past two years. The U.S. trade deficit in manufactured goods is explained by China’s soaring global trade surplus, which has increased 60% since 2019, and by imports from other countries with structural trade surpluses, including Japan, South Korea, and the European Union.
These trade surpluses are, in part, the result of these countries undertaking trade and industrial policies to boost manufacturing. If the United States fails to do the same, we’ll continue to lose ground. In addition, China and other surplus countries have maintained persistently undervalued currencies since the 1990s through financial manipulation and excess U.S. capital inflows, which help explain these trade imbalances.
To rebuild demand for domestically made manufactured goods, U.S. policymakers need to develop more effective Buy America and other trade and industrial policies, and offset unfair trade and currency policies. Rebalancing U.S. trade and capital flows can create millions of good jobs for U.S. manufacturing workers.
Sign up for EPI’s newsletter so you never miss our research and insights on ways to make the economy work better for everyone.


