
Editor’s note: Seeking Alpha is proud to welcome Anil Dang as a new contributor. It’s easy to become a Seeking Alpha contributor and earn money for your best investment ideas. Active contributors also get free access to SA Premium. Click here to find out more »
DNY59
Sources, Causes, and Current Status
As and when discussion about the US dollar occurs, phrases like “cleanest shirt in the dirty laundry”, “most powerful navy” and many others like that are used to advance the US dollar supremacy narrative. This article gets into US Dollar math and how it is now approaching scary levels. The object of this article is to analyze data, on the math of the US Dollar, where the US Dollar has been, and analyze where it could go.
Pre-eminent Position of the USD
The United States Dollar (“USD”) is not like any other currency. Leaving aside Intra Europe Trade, over 2/3 of the remaining global trade is still invoiced in USD. Global Asset Managers, Central Banks, and International Agencies use the USD as the accounting unit. All globally traded commodities are quoted and mostly invoiced in USD. The United States Dollar is like the sun of the global monetary system, by which the rest of the world’s economic activity is referenced and measured. The primary reserve currency is a privileged position. The US can (and needs to) run a routine (within reason) current account deficit every year, as the world economy needs a certain amount of liquidity for growth, which is created by the US running trade and current account deficits. Over the last 20 years, the US has run an average current account deficit “CAD” of $0.5 trillion. Yet, the Dollar Index “DXY” (DXY) per my analysis has stayed in a 15% range of 95 level 95+% of the time. No other country in modern times has had the privilege of running a CAD this high and for such a long time, and has had no significant negative economic consequences.
DXY Year End Values (Federal Reserve Bank of St. Louis, Public Source)
Most of the financial media and investing public are focused on Stock Indices and Interest rates. However, longer term, the most important market is the value of the underlying national currency. In the US, there is a general apathy toward dollar value vs. other currencies. What Americans think of the dollar is perfectly summed up in the quote by Treasury Secretary John Connelly in 1971 “The dollar is our currency, but it’s your problem“. If the USD stays in a range, as it has for a very long time, that is likely to be true, but a serious appreciation like in the mid-80s which led to Plaza Accord, or a serious depreciation of USD, like in the mid-70s is completely another matter. Those large moves will affect the US along with the rest of the world. If the USD stages a large increase or decrease relative to the rest of the world, it affects the economy and also creates directions for all the other markets like stocks, bonds, commodities, inflation, and economic indicators.
No reserve currency status is permanent. Abuse the privilege, and push out large deficits, which the rest of the world is unable or unwilling to absorb, the result will be that of potentially losing the primary reserve currency status. If the currency value fluctuates beyond an acceptable range, it could also call into question the entire premise of the reserve currency status. Over the past 10 years (2012-2021), low USD volatility has given rise to complacency among investors and policymakers. However, there were unique reasons why USD stayed range bound even with the growing US twin deficits (budget and trade deficits). In summary, the massive inflow of capital in the last 10 years, far greater than any prior period has allowed twin deficits to be neutralized. Can this continue at an even greater scale?
There are good data-backed reasons to believe that perhaps with the US running massive twin deficits (over 5% of GDP, almost double the prior levels), and a negative balance sheet ($17 trillion negative Net International Investment Position “NIIP”, at 75% of GDP), the primary reserve currency status could come into question.
Current privileged Position of the USD
All money has had a starting point linked to either Gold or Silver. For hundreds of years, the pre-eminent industrial power and most important economy of the UK maintained the gold standard. Following the Pound, Europe also adopted the Gold standard, as did the newly established USA. Since the rise of US industrial power in the 20th century, the USD became the standard-bearer of Gold backed hard currency of the world.
After WW2, the US had accumulated almost 2/3rds of the world’s central bank gold reserves. That was the backdrop of the Bretton Woods agreement for the post-war global monetary framework. As a result, instead of Gold, US Dollar was made the center of the global monetary system, with a fixed price of $35/oz of Gold to the USD. All the other currencies were tied to US Dollar with a fixed exchange rate. The world monetary system transitioned from the Gold standard to the US Dollar standard, also known as Bretton Woods Monetary System.
In the following 25 years after Bretton Woods Agreements, USD got into the world monetary and trade Ecosystem. As a result, even after breaking the gold convertibility in 1971, the system of the USD as the primary reserve/accounting/reference currency did not change. Money needs a starting point, as established practices continue; global financial ecosystems are hard to change until there is a substantial financial or geopolitical imperative.
The US dollar is so dominant that 65+ countries peg their currencies to USD, and many use it as their medium of exchange, like Panama. 85% of FX trades are in USD vs. other currencies. Trade and Commodity invoicing are overwhelmingly in USD. So even though we are discussing imbalance in the US and potential weakness, these embedded uses are not likely to change quickly or likely for a long time.
The US Treasury Department, in a paper published in 2009, states following on the dollar as the primary reserve currency;
“The dollar’s role as the primary reserve currency (and, more generally, as the primary international currency) was not established by decree but, rather, because of the emergence of the U.S. as the world’s major economy. Economists point to several key factors that determine the use of a currency for reserves. These are:
- the size of the domestic economy,
- the importance of the economy in international trade,
- the size, depth, and openness of financial markets,
- the convertibility of the currency,
- the use of the currency as a currency peg, and
- domestic macroeconomic policies. “
My thinking on the above paper is, that it is all true. However, the true motivation of the US Treasury was that the USD is the only one that qualifies for this, so we can continue to run deficits, and nothing will ever happen. It is this logic that justified running ever greater twin deficits, first, they were manageable and somewhat needed, then 50+ years later, they are far beyond what the global economy and monetary system can absorb. Also, potentially very damaging to the global monetary architecture. The timing of this paper is also a little suspect, as in 2009, the first Trillion-dollar budget deficits appeared.
Core Problem: Consumption far above major economies
Consumption as % OF GDP (WORLD BANK)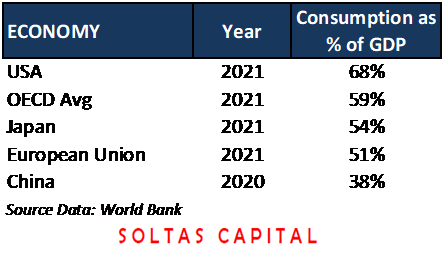
The above data shows just one year, although going back decades, the same lineup exists. The lower consumption in the EU, Japan, and China (vs. the US) has caused a structural savings surplus in those three blocks. While higher US consumption created structural and large dis-savings in the US. These dis-savings have translated into large trade deficits, which were balanced by foreign capital inflows into Treasury Securities and other assets like MBS, Corporate bonds, Stocks, and Real Estate. US overconsumption is structural; largely aided by government policies through large budget deficits & transfer payments. In addition, ultra-easy consumer credit, the largest per capita retail square feet on the planet, has also encouraged outsized consumption. The United States is structured as a consumer-driven, consumption economy. Lower savings are also encouraged by various insurance and retirement programs, where people don’t need to save for a rainy day. Being the center of the Global monetary system, able to run structural deficits year after year, the entire economy has shaped into a consumption-driven economy. It is structured to print dollars out of thin air, send them abroad, and buy whatever it (US Economy) needs. The result is the US balance sheet (as evidenced by NIIP) has continued to become more and more in deficit against the rest of the world
The political gridlock is such that deficits are likely to continue. The current discussions at best are going to result in changes at the margin, but the core problem will not be solved. Except for a large external shock, which I believe, is the disorderly USD breakdown at some point.
Exploding Federal Budget Deficit
Most economists will agree with the following sequence;
Overspending (via budget deficits) by government –> Economy of overconsumption –> Current account deficits –> Deteriorating national balance sheet–> Potential currency crises.
How did the deficit/debt-ridden economy come into creation is the topic of this section. The Federal Government budget deficits are one of the biggest sources of these problems and in the last 15 years, it (budget deficit) has been out of control.
US Budget Deficit in $ billions (Federal Reserve Bank of St. Louis, Forecast by Soltas Capital) US BUDGET DEFICIT % of GDP (Federal Reserve Bank of St. Louis)

The budget deficit forecasts are created by Soltas Capital analytics and are very likely in conflict with CBO forecasts. I believe CBO is way over-optimistic and potentially hiding worsening federal deficits.
Most of the deficit has been driven by overspending. Federal Government spending has been out of control as a % of GDP as well. Based on my analysis of OMB data from whitehouse.gov, the Post War Average for outlays has been at 20.2% of GDP, and during the Post Global Financial Crises of 2008 “GFC” outlays moved up to over 21%. Even this 21% also included the benefit of zero interest rates for almost a decade, if you normalize for 4% interest rates; post-GFC spending was at 22.5% of GDP. Now outlays are hovering at 25%+ due to the huge interest burden along with another large expansion of the federal government. While tax receipts have stayed between 17-18.5% of GDP, at a post-war average of 17.2%. This excess and increasing profligacy have resulted in ever-increasing federal budget deficits.
US Budget Outlays (whitehouse.gov, Forecast by Soltas Capital)
Same Chart Shorter Time Frame
US Budget Outlays (whitehouse.gov, Forecast by Soltas Capital)
It is clear from the charts above, even though the federal outlays have moved around with some spikes and fluctuations before GFC. However, since GFC outlays have moved in stair step function ever higher. All of it is financed by deficits, as receipts have stayed relatively constant. Multi-Trillion dollar budget deficits first started in 2009 after GFC, then in Pandemic relief in 2020-2022. Now that Pandemic related spending is almost over, the Federal government is operating at an even higher structural deficit at 6-8% of GDP (more on that below).
Apologists will use Japan as an example of a government in debt with no potential crises on the radar. Not quite, Japan is a saver society, 15% of its GDP is saved. To avoid a deflationary collapse of high savings, Japan exports savings abroad (Japan is the largest creditor nation by GDP of almost 80% in positive NIIP). In addition, to absorb the excess savings, the government runs deficits; all the while Japan is normally running current account surpluses. The opposite is true in the US. The US barely saves enough to finance even the private sector, all the government deficits have to be financed by foreigners, as domestic savings are insufficient to meet capital needs.
Expanding Trade and Current Account Deficits
US Current Account Deficits (Bureau of Economic Analysis, Forecast Soltas Capital)
The US Federal Government runs deficits; shoveling consumption dollars into the economy. Productive capacity and savings in the economy are insufficient to meet excess demand created by government deficits. To meet this excess demand for goods and services, trade deficits and current account deficits have continuously expanded. The previous high was a trade deficit of $763 billion in 2006, which was in large part also due to the surging cost of Oil imports. The macro imbalance was also caused by a credit expansion to finance the US housing bubble. In the last 10 years, the shale revolution has turned energy trade into a surplus and brought the trade deficit down to an average of $400 billion per year. Due to ever larger budget deficits, funneling consumption dollars far and wide into the US economy, the goods trade deficit and current account deficit have exploded to greater than $1 trillion.
While net interest and investment returns owed to foreigner-owned US assets (gross $45 trillion, net liabilities of $17 trillion) were small before 2022 due to zero interest rates, now with rates almost at 5%, the negative investment returns will explode from almost net zero to $500 billion+ in 2023 and 2024. Combined with the trade deficit (although the trade deficit will decline, though not enough), the new Current account deficit may exceed $1.3 trillion in 2023 (my estimate), which could be as much as $1.5 trillion, the highest ever. Going even higher in the future as lower coupon debts mature and get reinvested in higher coupon new debts, assuming they are rolled over, otherwise, we have an even bigger problem in the United States.
Negative US Balance Sheet as represented by Net International Investment Position
US Net International Investment Position (“NIIP”), is the net of market values of Assets and Liabilities of the US Government, corporations, and individuals. Sort of like a national external balance sheet. Assets are owned by US persons and entities in foreign nations, and Liabilities are investments by foreigners and central banks of the rest of the world in the US.
Over time, the trade and current account deficits have been balanced by large capital inflows, which have resulted in an increasing negative Net International Investment Position (NIIP).
US NIIP Assets and Liabilities (US Bureau of Economic Analysis) US Net International Investment Position (US Bureau of Economic Analysis)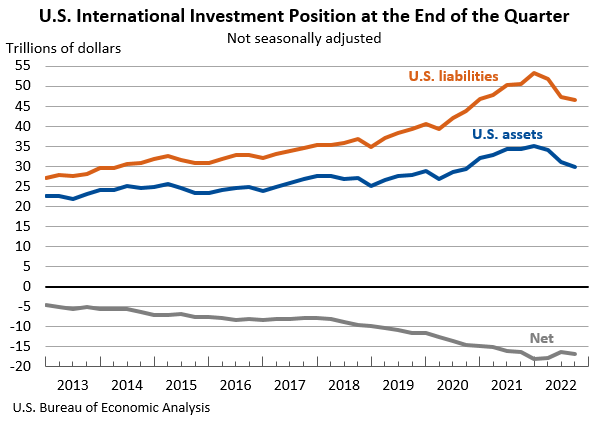
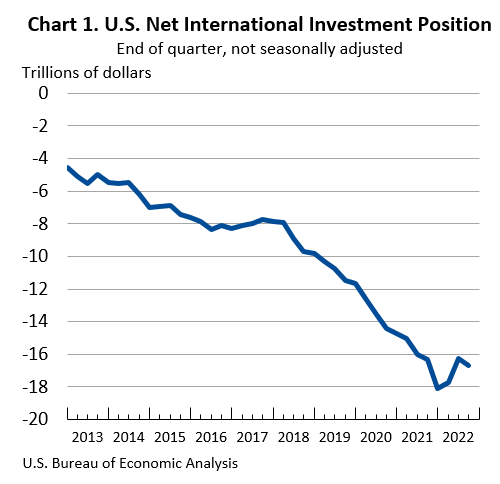
The major trend from 2007, NIIP has deteriorated from $1.2 trillion to $18.1 trillion in 2021. The slight tick-down in net liability in 2022 is a reflection of how this data works. This is the market value of assets and liabilities. Since 2022 was a very significant bear market in virtually all assets, market values of all assets declined, so both sides of the balance sheet shrank, which resulted in a slight net improvement in 2022. The improvement in 2022 is temporary, as current account deficits (our forecast) are projected even higher due to higher coupon payments to foreign bond/asset holders. There is a continued need to attract $1.5~ trillion in 2023 to cover the projected current account deficit (+ rollovers of exiting capital) and even more in years beyond. The need for even greater inbound capital into the US year after year will keep on increasing negative NIIP to an ever more worsening situation.
Worse still, most of the deficit as measured by NIIP is in the portfolio investments, which can be sold in short order followed by selling USD for another currency. Portfolio investments are generally liquid publicly traded instruments vs. an investment by Toyota Motors (TM) to set up factories in the US. The portfolio NIIP deficit reached $12 trillion in 2021, up from negative $2.2 trillion in 2007. What happens if, the US Portfolio investors also start diversifying away from US assets, not just foreign holders selling? These multi-trillion moves are just clicks on the trading screens and could trigger a crisis, as there are no FX reserves in the US to counter these outflows. In short, the whole setup is like a tinderbox, waiting for a light.
US NIIP – Portfolio Investments (US Bureau of Economic Analysis)
To close out this point, we need to view NIIP vs. GDP, here again, steady deterioration with a slight uptick due to valuation reasons in 3Q22.
US NIIP – Portfolio Investments % of GDP (US Bureau of Economic Analysis)
Lastly, another data point to bring out the whole problem from a proper global perspective, the US is a larger debtor based on NIIP numbers, than all the top 10 top creditors combined. You have to include Saudi Arabia to come close to balancing the negative US NIIP.
Top 10 NIIP Creditors and Debtors (Source IMF, World Bank, Soltas Capital Analytics)
The only significant countries close to or greater than the US in NIIP (based on % of GDP) are Portugal, Ireland, Greece, and Spain (Famous PIIGS club which consists of profligate countries, from a Financial and balance sheet perspective). The bottom line, numbers are negative, getting worse, and probably headed to a crisis level in the next few Quarters/Years. Unless, of course, twin deficits are drastically brought down and soon with a credible plan.
The future may be different from today; what changes?
The core of the global financial market thinking is that the US has been in deficit mode for decades, nothing has happened, so nothing will happen. There were very specific reasons why things have been rather stable, even though the US government and NIIP balance sheet has progressively deteriorated.
In the 1980s: Even though the US was running large deficits, the US had a Flood of Japanese and European Capital and for the first time much higher interest rates in the US, central banks bought a record amount of treasuries. The United States was a net creditor nation, so deficits and increasing debt were not net negative to USD external value. In the middle 80s USD became very strong due to very high US interest rates and DXY hit an all-time high in 1985. To contain record USD strength, Plaza Accord was entered, which allowed USD to get back down to its more normal channel.
1990-1995: Deficits were brought down significantly and the need for new capital was a lot lower, and the dollar strengthened.
1995-2002: The US was running budget surpluses and the trade deficit was also constrained, so the need for attracting capital was rather limited. The dot com bubble in the US attracted large capital. The net effect of the record capital inflows was that current account deficits were more than overcome by much larger capital inflows, and it pushed up USD to a decadal high of 111 in 2001-2.
2002-2008: Globalization was in full swing, imports were going to up dramatically, and the housing bubble was pushing US consumption to new highs. So even though the capital was flowing into the US, DXY declined markedly as inflows were insufficient to cover the current account deficit.
2009-2016: Massive budget deficits were countered by substantial contraction in private credit. That resulted in a contraction of Trade Deficit/CAD. Capital inflows accelerated, and China was running large trade surpluses, to keep yuan appreciation in check China was heavily buying treasuries through the People’s Bank of China (“PBOC”). Additional capital flows accelerated with PIIGS crises in Europe, capital fled from Europe into the US in record amounts. So even though trade and Current account deficits were high although stable, Capital inflows more than covered those deficits. Capital inflows were strong enough to push the DXY to highs again in 2016.
2016-2020: Commercial real estate bubble and FAANG mania attracted huge capital into USD. The Shale Revolution in the US pushed the US energy deficit into a surplus. So with stable or contracting CAD + record capital flowing into the US, DXY remained strong.
2020-2022 Multiple asset bubbles (FAANG, Real Estate, etc.) in progress attracted record foreign capital, so even with the Current Account deficit at record highs, capital inflows once again pushed up DXY to almost 115.
2023 – Future: For stable to a stronger dollar to continue three possibilities with some combination 1) Either we blow a huge new bubble (I can’t see how and where), 2) the Situation in the rest of world becomes horrible so capital gets scared and flows into the US 3) We dramatically reduce Current account deficit and turn into a surplus. At least two of the above are not likely, as a result, the need to shrink the large $1.5 trillion current account deficit (by shrinking Budget deficit) is the only real way the US can stave off a crisis. The only other possibility is #2, but even that is short-term.
Conclusion
The most likely outcome is a disorderly downturn in US Dollar to a point where it will cause a crisis. The downturn will not be just against the major FX pairs, but also with Asian and Middle Eastern currencies. The follow-on result will be commodity inflation, rising bond yields, asset deflation in real term, and elevated long-term volatility in all asset classes.
Editor’s Note: This article covers one or more microcap stocks. Please be aware of the risks associated with these stocks.


