

Emerging market (EM) equities and bonds registered positive returns in Q1. This was despite a pick-up in volatility, amid global macroeconomic uncertainty. Our EM Lens provides a snapshot of performance over the period and looks at the latest valuation picture for both EM equities and bonds.
This consists of separate EM equity and debt chartbooks/presentations, packed full of data and insights to help you navigate the world of emerging markets. The aim here is to provide an unbiased top-down view of markets. Please note that the EM debt presentation is split into sections on hard currency debt, local currency debt, and currencies.
Download the full EM Lens packs here:
EM assets got off to a flyer in January before positive sentiment waned
EM equities and bonds made a strong start to 2023 as markets shrugged off the risks of a global slowdown in January. The re-opening of the Chinese economy continued to support sentiment. Meanwhile, some Asian emerging markets began to price in such a potential cyclical recovery. Falling energy prices provided relief for net EM importers, including in emerging Europe which saw natural gas prices plunge. The risk-on environment was reflected in net inflows to both EM equities and EM debt in January.
Q1 equity and bond market performance
Past performance is not a guide to future performance and may not be repeated. Percentage total return. US dollars. Source: Refinitiv Datastream, MSCI, Schroders Strategic Research Unit, as at 31 March 2023.
Q1 EMD performance
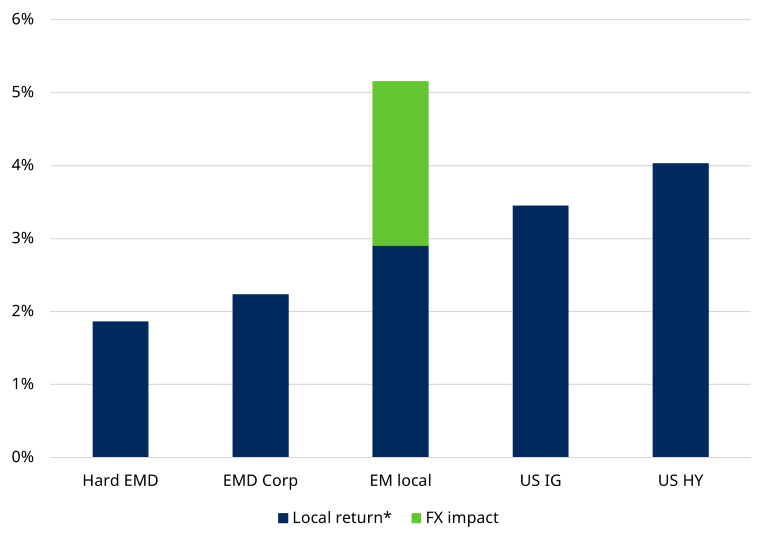
*Local currency = US dollar for all apart from local EMD which is in the relevant local EM currency. Source: Schroders, Refinitiv Datastream, JP Morgan, Schroders Strategic Research Unit. Data as at 31 March 2023.
However, uncertainty in the global macroeconomic outlook returned. This was initially triggered by more resilient-than-expected data in the US in February, suggesting monetary policy tightening had further to run, and that rates may be higher for longer. March saw the failure of Silicon Valley Bank, raising concerns that further policy tightening could exacerbate banking sector stress and tighten credit conditions more rapidly. Geopolitical concerns also picked up. Against this backdrop, inflows to EM equities slowed and EM bonds saw net outflows later in the quarter.
Net EM equity and bond market flows (USD billion)
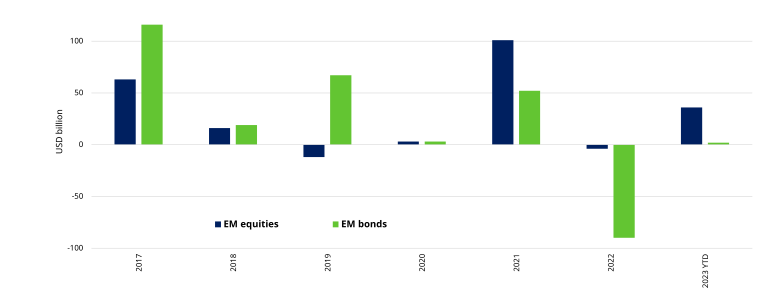
Source: J.P. Morgan, EPFR Global, Bloomberg Finance L.P. as at 31 March 2023. Includes ETFs and non-ETFs.
The weaker US dollar
US dollar weakness was supportive of EM assets over the quarter, despite some volatility. Latin America and emerging European currencies saw the greatest appreciation versus the greenback. Is this the beginning of a downtrend for the US dollar?
A weaker dollar has typically been associated with outperformance of EM equities versus developed markets (DM), and vice versa, as this next chart shows. It also provides a tailwind in terms of amplifying EM local currency debt returns.
US dollar and EM vs. DM equities performance
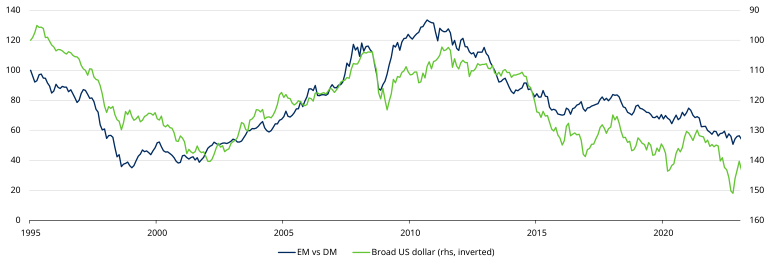
Past performance is not a guide to future performance and may not be repeated. Source: Refinitiv Datastream, MSCI, Schroders Strategic Research Unit.
What do valuations look like?
EM Equities
The valuation picture in EM equities is similar to that at the start of 2023. Aggregate EM equities are slightly expensive on a forward price-earnings basis. The price-book ratio is close to its historical median, while EM remains very cheap versus history on a dividend yield basis.
There is still considerable variability between sector valuations. Various growth sectors remain much more expensive than value sectors. From a style perspective, it is notable that the growth re-rating, which started at the end of October, came to a halt in February.
EM equities are cheaper than DM equities, but the difference is not extremely large, especially on a sector neutral basis. On a regional basis, Latin America remains cheap on a forward price-earnings basis. Valuations in Europe, the Middle East and Africa (EMEA) are close to their historical median, while EM Asia is slightly expensive.
On a combined valuation basis, shown in the chart below, all EM are cheap relative to history, other than India, Thailand, Czech Republic and South Korea.
Average (trailing P/E, P/E, P/B, dividend yield) (z-score 1)
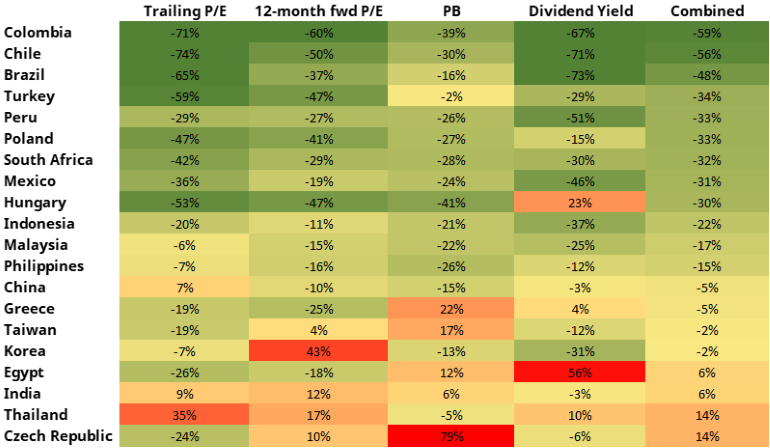
1The z-score is a measure of how far valuations are from historical mean, calculated since January 2000.Excludes UAE, Qatar, Saudi Arabia and Kuwait due to limited data history. Combined figure is an average of trailing P/E, 12-month forward P/E, P/B, and dividend yield. Source: Schroders, Refinitiv Datastream, MSCI, IBES, Schroders Strategic Research Unit. Data as at 31 March 2023.
EM Bonds
Hard currency emerging market debt (EMD):
The hard currency index yield remains elevated relative to its long-term history. This is entirely down to the elevated spread on the high yield (HY) sovereign index. The spread on the investment grade (IG) sovereign market is below its historical average. In the corporate market, both the IG and HY spreads are close to average levels.
Hard currency sovereign EMD regional index yield
Russia was removed from all JP Morgan EMD indices from 31 March 2022. Source: Schroders, JP Morgan. Data as at 31 March 2023.
Local currency EMD:
The real yield pick-up over DM bonds has fallen to a very low level. This is primarily due to the sharp decrease in EM real yields in the past 12 months, as inflation has increased by more than nominal yields.
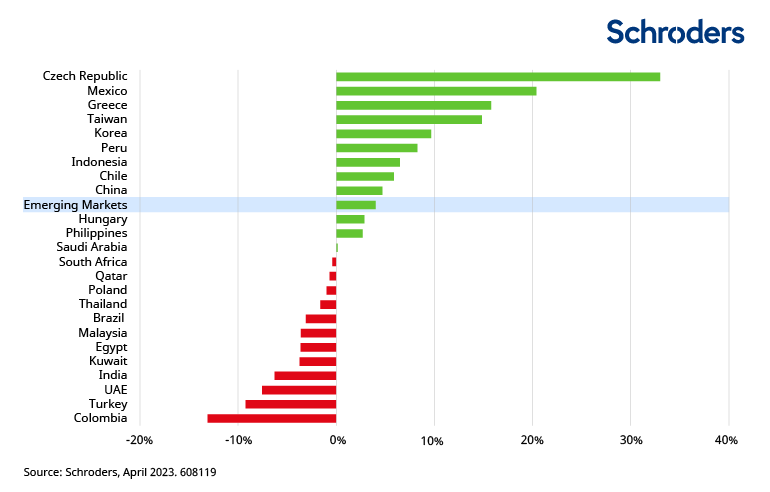
There are undervalued currencies in all three EM regions. The degree of value in EM currencies varies significantly.
Real exchange rate: deviation from average
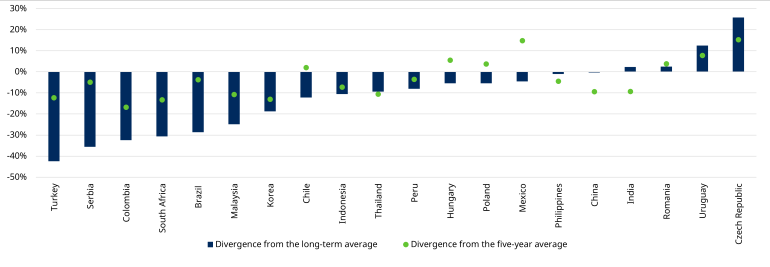
Source: Schroders, Refinitiv Datastream. Data as at 31 March 2023. Real exchange rate is the nominal dollar exchange rate deflated by the consumer price index (CPI) of each EM country vs. US. Long-term average is since January 1995.
Read all about it
More detailed analysis of EM equity and bond market valuations can be found in the dedicated EM equity and EM Lens packs. These are available via the links below, and include analysis of EMD issuance so far this year.


