Amidst all the din over March’s banking sector chaos, here is something that seems to have surprised many commentators we follow: Stocks surged in the month’s second half, finishing it and Q1 with some pretty nice returns.[i] The S&P 500 rose 7.5% in dollars in Q1, bringing its return since 12 October’s most recent US bear market low to 15.8%.[ii] The pound’s strengthening dampened UK investors’ returns on global shares, but even there, the MSCI World Index returned 4.8% in pounds.[iii] Yet based on our reading of the latest financial commentary, sentiment hasn’t caught up to stocks’ rebound from last year’s declines.[iv] We think surveys and a quick tour of financial headlines we read show many investors continue dismissing the rally and seeking reasons to be pessimistic. Meanwhile, as we will also show, economic data, whilst not stellar across the board, keep beating analysts’ expectations. This is encouraging, in our view—a backdrop that our research shows makes today’s environment look more and more like the normal backdrop for stocks early in a bull market (a long period of generally rising equity prices).
Whilst UK stocks and global returns in pounds didn’t decline into bear market territory, stocks in dollars did—a meaningful development for investors everywhere, in our view, given US stocks’ large weighting in global markets and the large amount of people investing in dollars.[v] Whilst currency swings mean investors elsewhere may experience higher or lower investment returns in dollars, we find broader trends are global. Therefore, a new bull market in dollars would likely represent an expansion for all developed-world investors. So we think it is helpful to look at market cycle turns from a dollar-based perspective.
With that in mind, until and unless stocks eclipse their prior peak, returns alone won’t tell you if a new bull market is underway. Our research of market history shows false dawns are common, and bear market rallies can get pretty big—as last spring and summer proved.[vi] Assessing sentiment can help a lot on this front, in our view. In our experience, if a rally from a market low attracts plenty of investor cheer, it has a higher likelihood of being a headfake—it would likely indicate sentiment hadn’t run its full bear market course to what we find is its typical ultra-pessimistic trough. We have observed new bull markets, by contrast, are usually unloved and disbelieved—a phenomenon Fisher Investments Founder and Executive Chairman Ken Fisher calls “the pessimism of disbelief.”[vii]
We think pessimism of disbelief sums up sentiment now—and not just the revolving warnings from commentators we follow over banks, US Federal Reserve (Fed) rate hikes, oil prices, the US’s debt ceiling and more. A CNBC survey of professional investors found 70% of the “chief investment officers, equity strategists, portfolio managers and CNBC contributors who manage money” think stocks are likely to fall from here.[viii] Just over one-third called Fed error the biggest risk, and another third cited inflation—basically overlapping fears, in our view, considering how many associate inflation with more rate hikes … and rate hikes with bear markets. Only 32% said the low is nearby or in the rearview. When asked their preferred alternative to stocks, 59% said cash, indicating, in our view, last year’s bond market woes have professional investors similarly skittish toward fixed income.
Some commentators we follow are reaching for technical reasons to argue stocks’ rally in dollars is a mirage. One piece that got a fair amount of attention last Friday argued that whilst the S&P 500 is up, relatively few stocks are driving it—market breadth is too low, if you will pardon the technical term.[ix] The article goes further to explain, with the equal-weighted S&P 500 index several points behind the headline market-capitalisation weighted index in the quarter, returns must be coming from just a handful of companies hiding dim results amongst the vast majority of stocks.[x] In other words, if most companies aren’t up, the article posits the S&P 500’s rally isn’t real.
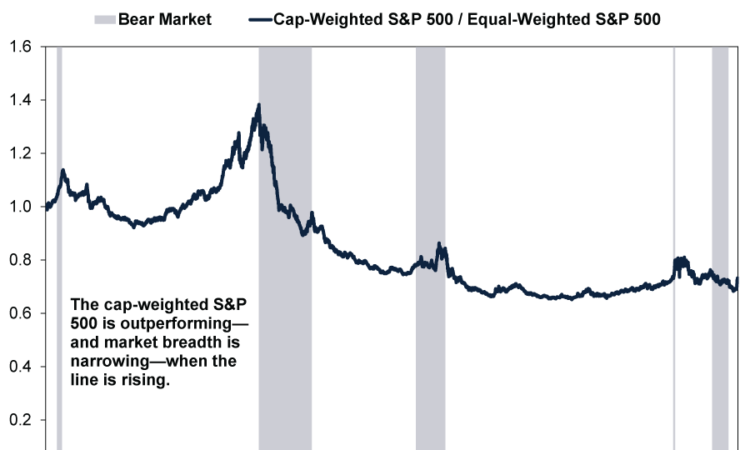
We think a look at market history should put this to bed. Exhibit 1 shows the capitalisation-weighted S&P 500’s returns relative to the equal-weighted since early 1990, just before the S&P 500’s first bear market since daily data begin. When the line is rising, the capitalisation-weighted index is outperforming, indicating narrower market breadth. As you will see, little wiggles early in a bull market aren’t unusual, and the most recent little bump isn’t out of step with those that came before. (For visual clarity, we ended the 2022 bear market shading at the October low, although we cannot know for sure if that is the ultimate low yet.)
Exhibit 1: Market Breadth Isn’t an Ironclad Indicator
Source: FactSet, as of 31/3/2023. S&P 500 and S&P 500 Equal-Weighted Index total returns, in dollars 30/3/1990 – 30/3/2023. Currency fluctuations between the dollar and pound may result in higher or lower investment returns.
Moreover, as Exhibit 1 shows, breadth doesn’t have a standard bear market pattern. It narrowed in 1990’s short downturn but mostly widened during the dot-com bust. It went back and forth during the 2007 – 2009 global financial crisis and widened irregularly during 2022, as stock returns in dollars entered a bear market. (The global 2020 COVID-driven bear market is too short to glean any meaningful trends from, in our view.) About all we think it is fair to say is that breadth usually narrows as bull markets mature—which is consistent with what our research shows: the tendency for the biggest stocks to lead later in the cycle—but that doesn’t mean it can’t narrow at times early on.
So sentiment and market behaviour, as related to the S&P 500, are pretty standard for an early bull market, in our view. Crucially, so are economic drivers. As we have often said, we don’t think new bull markets need perfection—just a reality that goes modestly better than investors expect. That is the power behind pessimism, in our view—it lowers the bar to clear after the bear market destroys sentiment and darkens analysts’ expectations … and reality has been clearing it. We think Citi’s Economic Surprise Indexes—gauges that summarise whether incoming data are topping or missing analysts’ forecasts—are a handy, if imperfect, way to see this. They show a mild upward trend in data beating investors’ expectations across global markets. Financial publications we read dwell on high-profile misses like manufacturing purchasing managers’ indexes (PMIs, monthly surveys that track the breadth of economic activity; readings above 50 indicate expansion, below 50, contraction) and US retail sales, but these are the exceptions, not the rule, as Exhibit 2 shows.
Exhibit 2: Positive Surprise Is Trendy
Source: FactSet, as of 3/4/2023.
With all this said, we think it remains possible that this is an unloved bear market rally. Time will tell. But, in our experience, investing is about probabilities, not possibilities or certainties. To us, the probability that a new bull market in dollars is either very close or underway looks quite high.
[i] Source: FactSet, as of 6/4/2023. Statement based on MSCI World Index return with net dividends, in pounds, 13/3/2023 – 31/3/2023 and 31/12/2022 – 31/3/2023.
[ii] Ibid. S&P 500 total returns, in dollars, 31/12/2022 – 31/3/2023 and 12/10/2022 – 31/3/2023. A bear market is a prolonged, fundamentally driven broad equity market decline of -20% or worse. Currency fluctuations between the dollar and pound may result in higher or lower investment returns.
[iii] Ibid. MSCI World Index return with net dividends, in pounds, 31/12/2022 – 31/3/2023 and 12/10/2022 – 31/3/2023.
[iv] Ibid. Statement based on MSCI World Index return with net dividends in pounds and euros 8/12/2021 – 16/6/2022 and 4/1/2022 – 16/6/2022, respectively. A correction is a sentiment-driven decline of around -10% to 20%. Currency fluctuations between the euro and pound may result in higher or lower investment returns.
[v] Ibid. Statement based on MSCI World Index returns with net dividends, in dollars, pounds and euros, 4/1/2022 – 12/10/2022, and US as a percentage of MSCI World Index market value on 5/4/2023. Currency fluctuations between the pound and other currencies may result in higher or lower investment returns
[vi] Ibid. Statement based on MSCI World Index return with net dividends, in dollars, 8/3/2022 – 29/3/2022 and 17/6/2022 – 16/8/2022. Currency fluctuations between the dollar and pound may result in higher or lower investment returns.
[vii] “A Bull Market Is In Full Swing—And Most of Us Are In Denial,” Ken Fisher, New York Post, 5/3/2023.
[viii] “Investors Believe the Stock Market Is Set for Losses, and Cash Is Best Safe Haven, CNBC Survey Shows,” Yun Li and Patricia Martell, CNBC, 31/3/2023.
[ix] “This Stock Market Splash Has a Disturbing Undertow,” Robert Burgess, Bloomberg, 31/3/2023. Accessed via Wealth Management. Market breadth is the percentage of shares outperforming the broader market.
[x] Source: FactSet, as of 5/4/2023. Statement based on S&P 500 and S&P 500 Equal-Weighted Index total returns, in dollars, 31/12/2022 – 31/3/2023. An equal-weighted index allocates a fixed weight to each constituent’s stock, regardless of the company’s market value, so each stock carries equal importance. Market capitalisation (share price times number of shares outstanding) is a measure of a company’s market value. Currency fluctuations between the dollar and pound may result in higher or lower investment returns.


