

ugurhan
For investors based in the U.S. there are plenty of excellent domestic choices for investments. Over the past decades, U.S. companies have created an exceptional amount of wealth for investors, and the S&P 500 (SP500) is considered by many as the best stock index in the world.
I am based in Europe and have many stocks from my continent in my portfolio. In this article, I share my experiences and discuss whether the concept of investing in European stocks is similarly straightforward to investing in the U.S. stock market.
Europe is one of the world’s leading economic areas
Investing in stocks from the EU provides exposure to one of the world’s leading economic areas.
The United States are the largest economy of the world with a GDP of $23.3 trillion in 2021, more than five times of Germany, the largest European economy ($4.3 trillion). However, European states can’t be just viewed on their own when it comes to assessing Europe’s impact on the world economy.
One has to take into account that 27 European states have formed a single market within the European Union. Together, the EU has a GDP $17.2 trillion, which is not far away from the United States and China, the second largest economy ($17.7 trillion).
World Bank website, 2021 data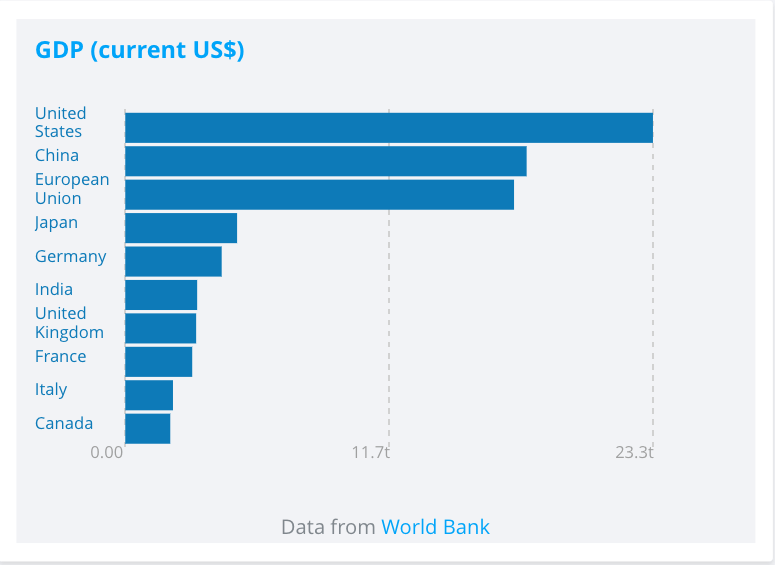
The EU as a whole is a top player in global trade. Looking at the flows of exports and imports, the EU even had the second largest share of global exports and third largest share of imports of goods in 2021.
Eurostat website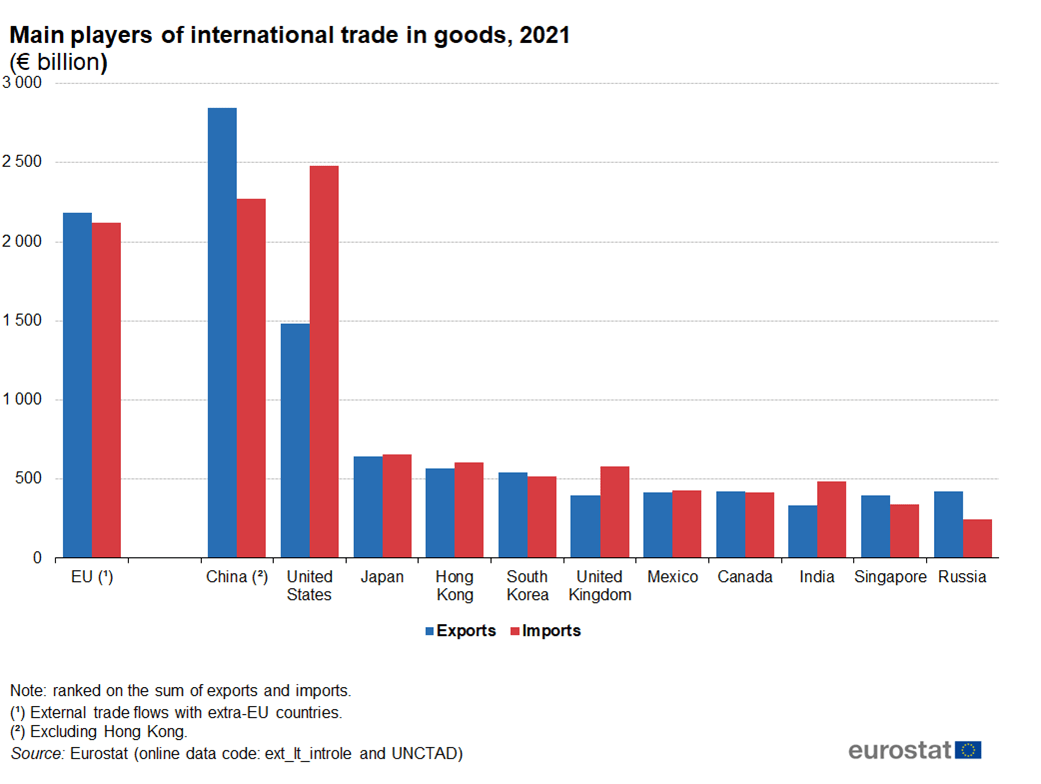
According to Eurostat, the EU’s statistical office, in 2021 the EU’s exports of goods were equivalent to 14.6 % of the world total. Only China (19.1 %) had a higher share while the United States (10.0 %) followed at some distance.
Eurostat website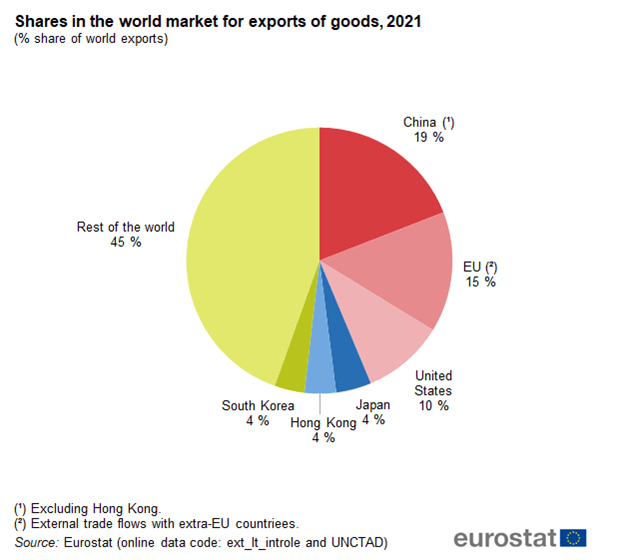
The main goods traded between the EU and other parts of the world were machinery and vehicles, as well as other manufactured goods, furthermore chemicals and food and drink. The largest category in exports of machinery and vehicles was road vehicles, followed by electrical machinery and general industrial machinery and equipment. The largest category in exports of chemicals were medicinal and pharmaceutical products.
Eurostat website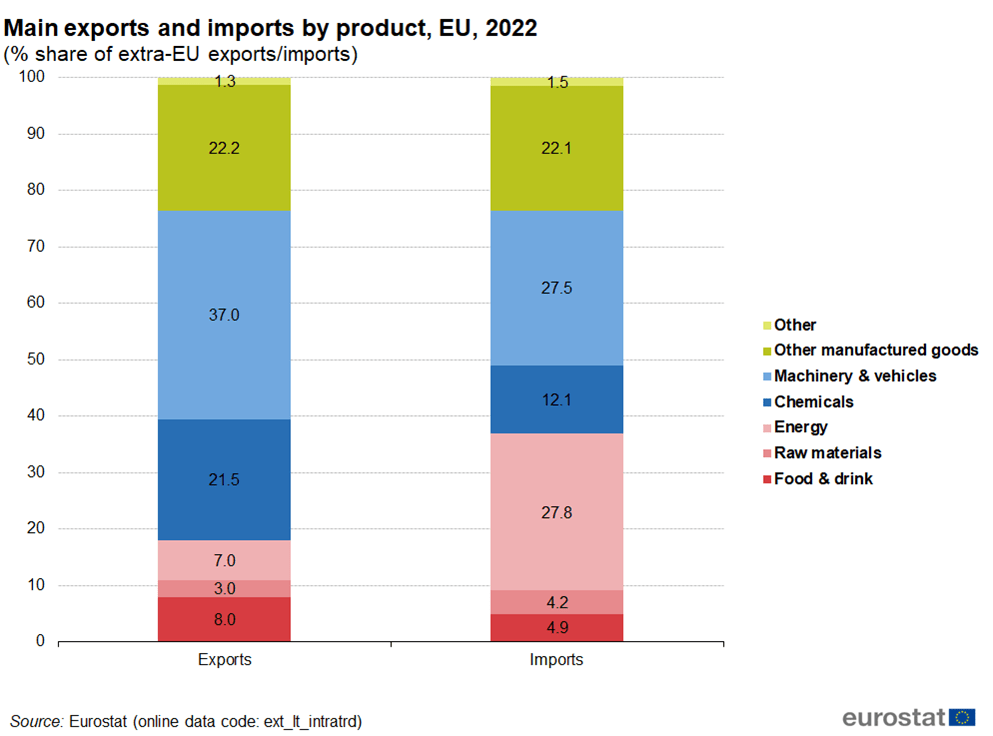
Europe lags behind the U.S. in economic growth
However, the U.S. economy has historically grown faster than the European economy as a whole.
GDP (current US$) 1961-2021 (World Bank website)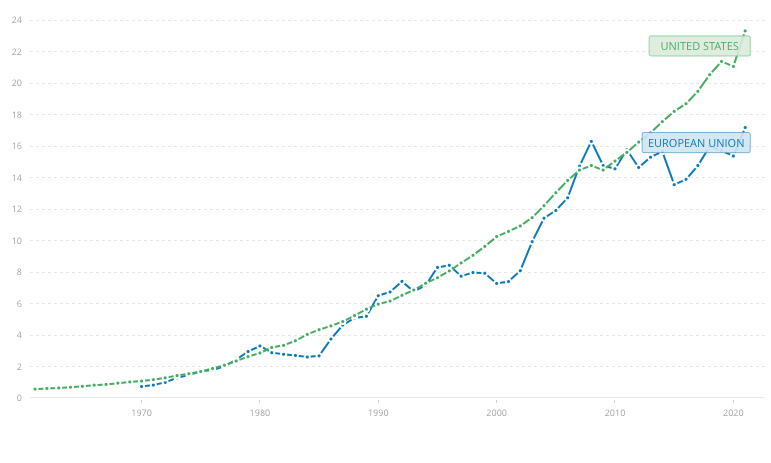
Regarding the economic outlook, the economic headlines in Europe are dominated by inflation and the consequences of the European central banks’ rate hikes. In the near future, Europe’s economy is currently expected to continue growing, however at a slightly lower pace than the United States.
The International Monetary Fund (IMF) estimates for the United States a GDP growth of 1.6% in 2023 and 1.1% in 2024. On the other hand, the IMF forecasts a GDP growth of 0.8% in 2023 and 1.4% in 2024 for the Eurozone (the 20 EU Member States that have adopted the Euro as their currency).
International Monetary Fund website, data of April 2023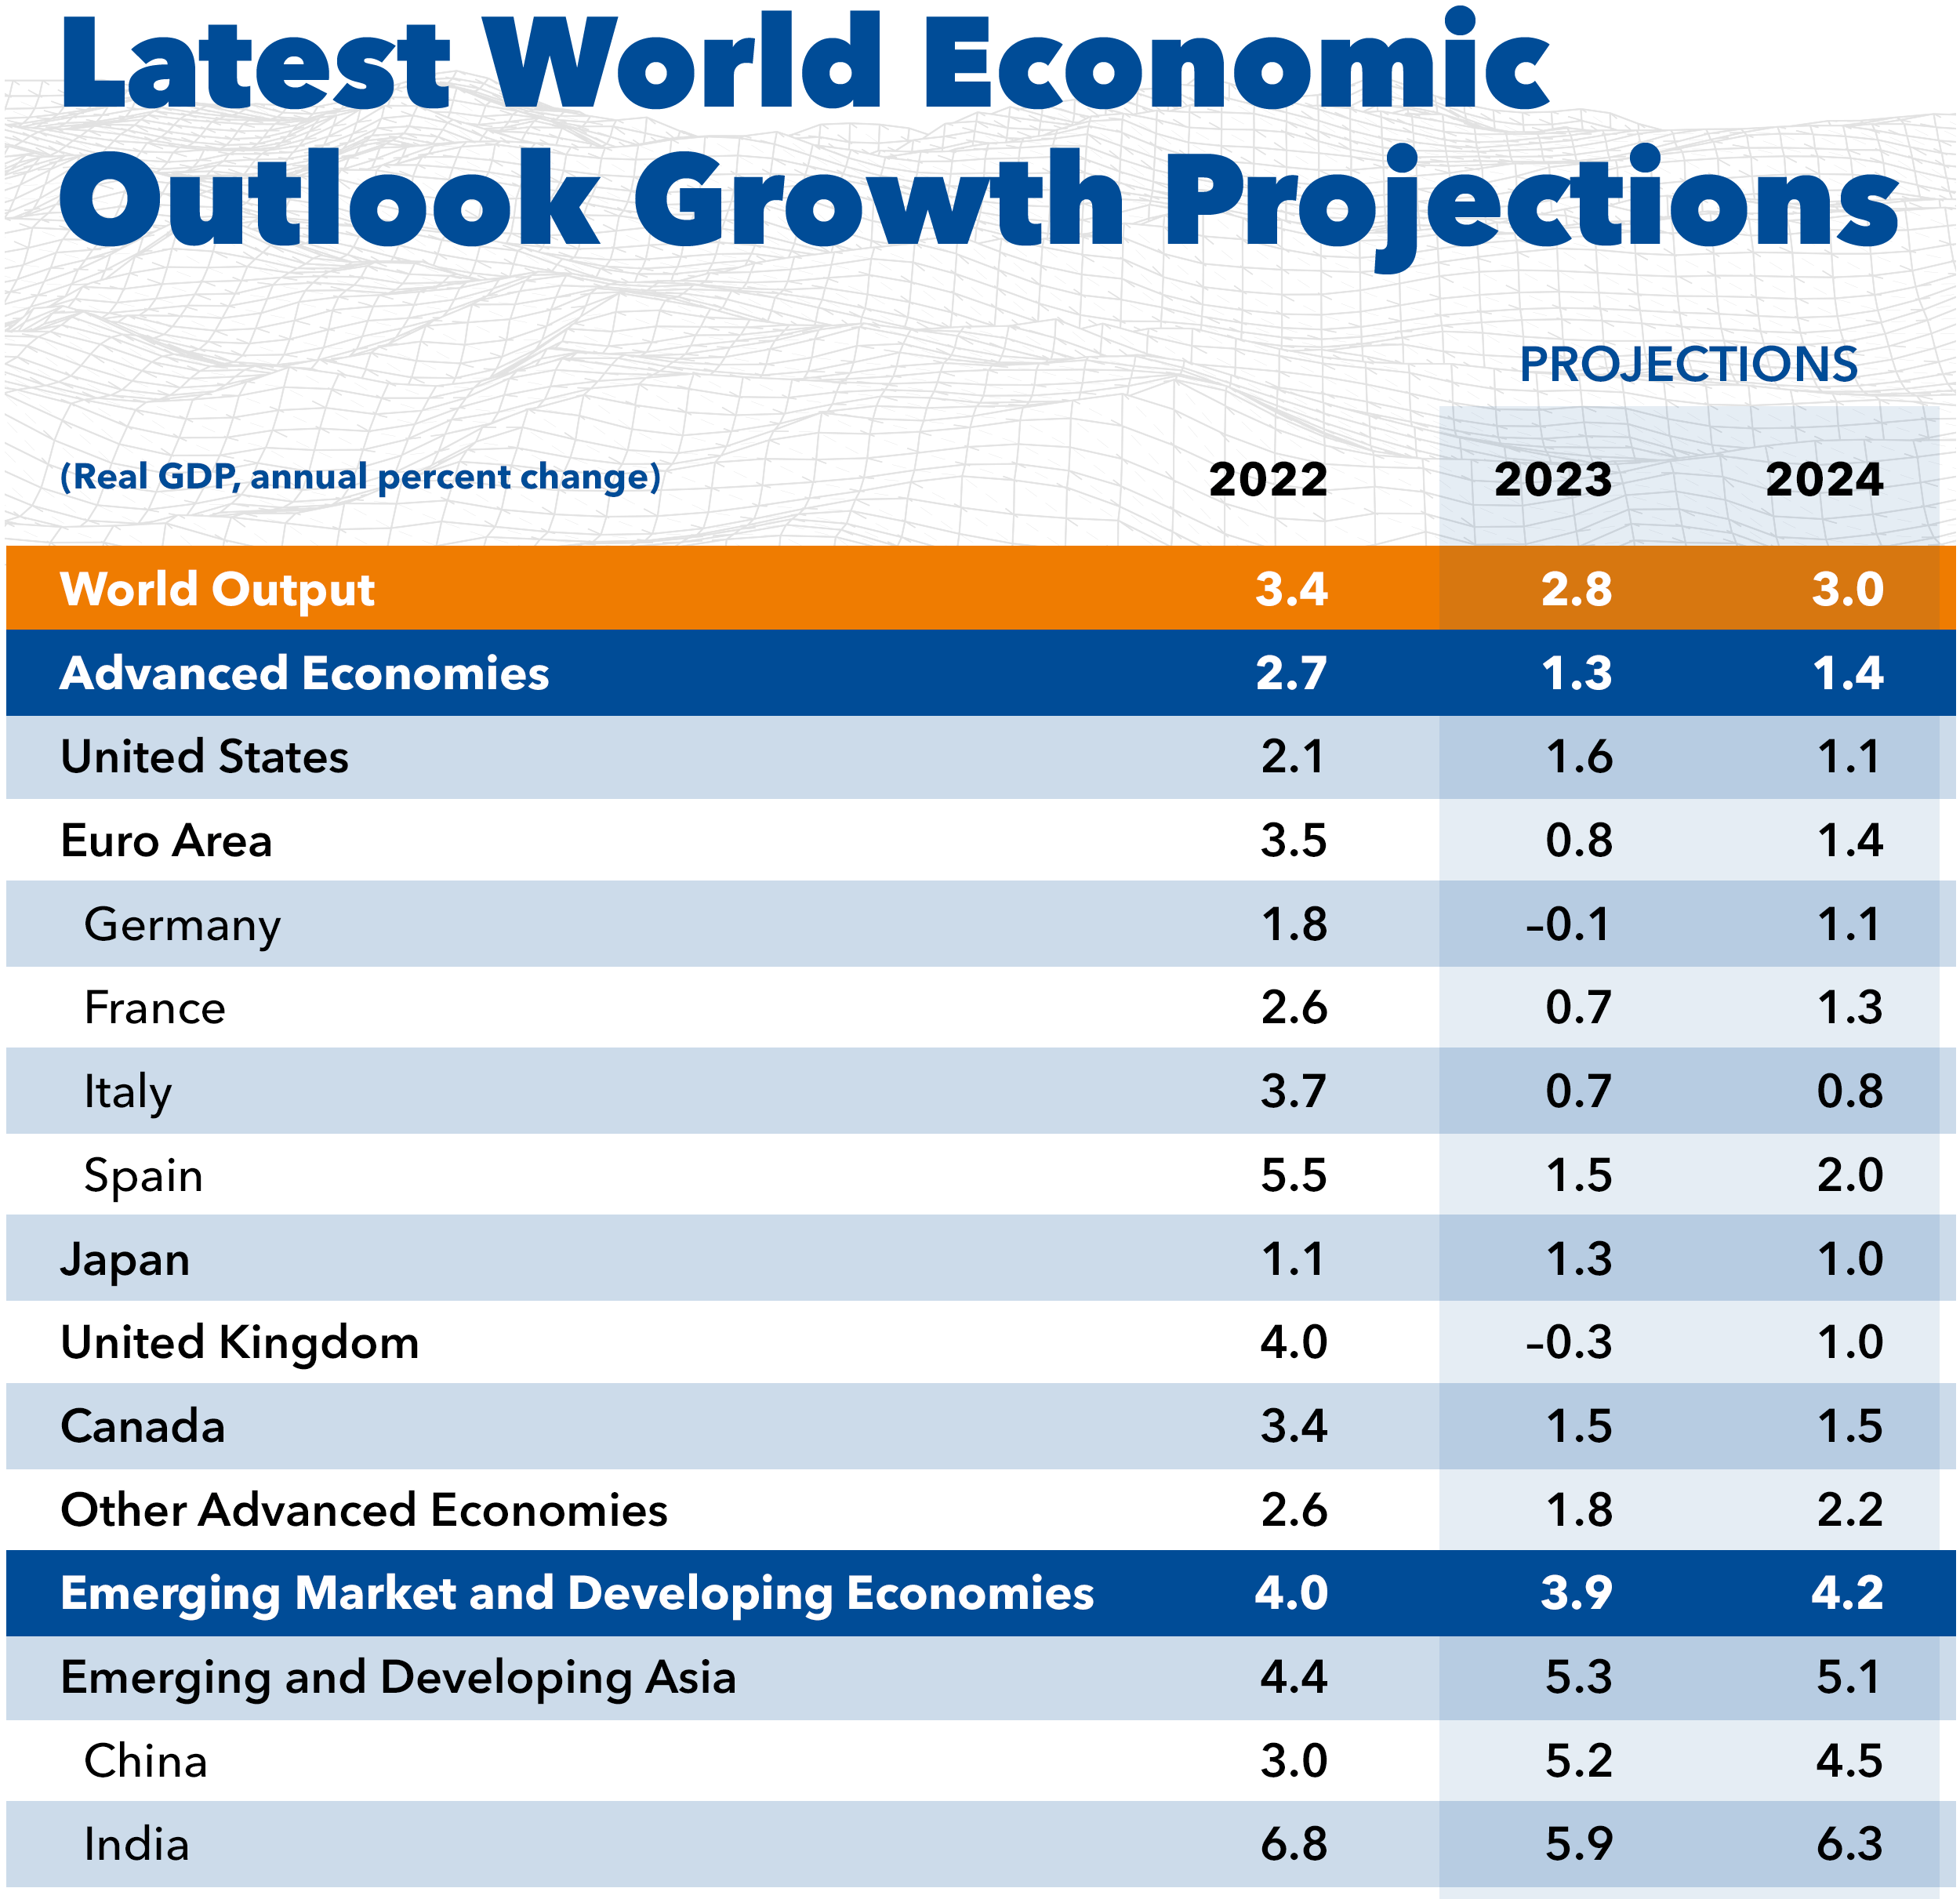
European indices have underperformed the S&P 500
With this economic data in mind, it is no surprise that over the past years, European stock indices have underperformed the S&P 500.
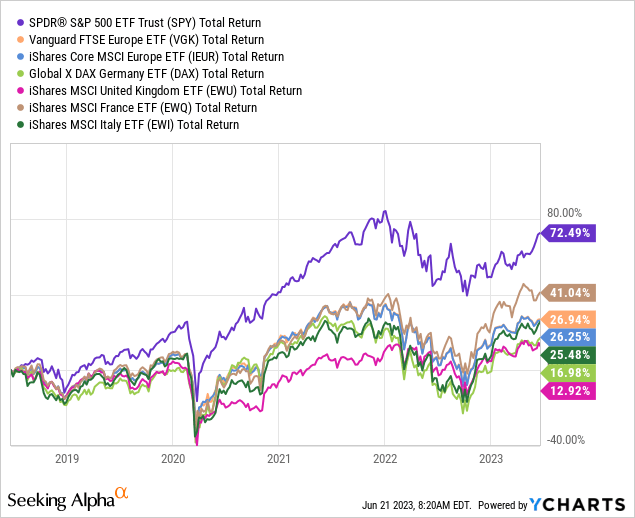
The underperformance is quite striking. On the other hand, European indices trade at a lower average valuation than the S&P 500, and offer a higher dividend yield.
| Fund | P/E ratio | Dividend yield |
| SPY | 23.1 | 1.49 |
| IEUR | 14.1 | 2.90 |
| VGK | 12.3 | 3.14 |
| DAX | 11.4 | 2.36 |
| EWU | 11.8 | 3.36 |
| EWQ | 16.4 | 2.48 |
| EWI | 10.1 | 3.69 |
This discrepancy in performance and fundamentals is also linked with the composition of the indices and the growth perspectives of their major holdings. The current Top 5 positions of SPY are all high growth mega caps that have shown in recent years a phenomenal outperformance: Apple (AAPL), Microsoft (MSFT), Amazon (AMZN), Nvidia (NVDA) and Alphabet/Google (GOOG).
Furthermore, the fast growing information technology sector is by far the largest sector represented in SPY (nearly 29% of the index), with health care (13.6%) and financials (12%) in second and third place.
Meanwhile major European indices have a much larger exposure to the “old” economy, with mostly industrials and financials being the largest sectors in the indices.
| Index fund | largest sector | 2nd largest sector | 3rd largest sector |
| IEUR | Industrials | Financials | Healthcare |
| VGK | Financials | Industrials | Healthcare |
| DAX | Industrials | Financials | Technology |
| EWU | Consumer Defensive | Financials | Healthcare |
| EWQ | Industrials | Consumer Cyclical | Consumer Defensive |
| EWI | Financials | Consumer Cyclical | Utilities |
There are high quality European stocks that have performed very well
Therefore, ETF investors will likely not have had much pleasure in comparing the returns of investing in the U.S. and Europe. However, does this does disqualify European stocks as an investment in general?
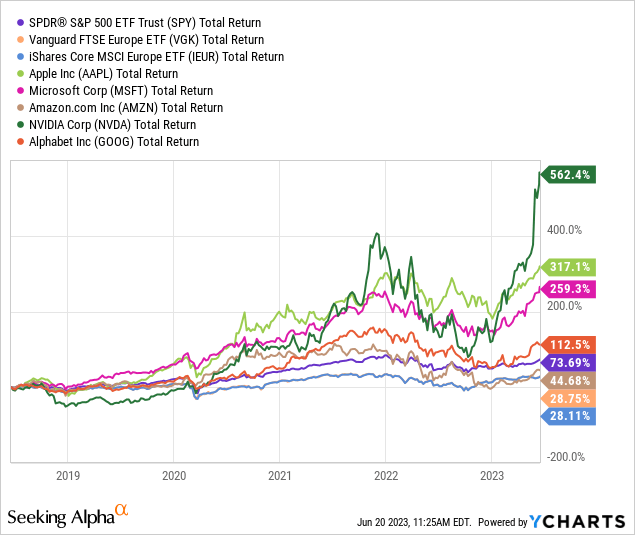
Let’s take a look at the largest constituents of the FTSE Europe index. These are high quality multinational companies, with the top 5 positions being: Nestle (OTCPK:NSRGY), ASML Holding (ASML), Novo Nordisk (NVO), Roche (OTCQX:RHHBY) and LVMH Louis Vuitton Moet Hennessy (OTCPK:LVMHF).
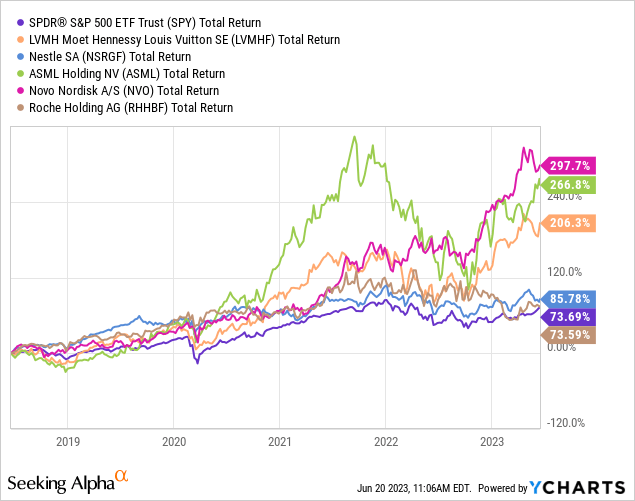
The chart shows that over the past five years, Novo Nordisk, ASML, LVMH and Nestle have outperformed both major European indices and the S&P 500. Roche is lagging behind only marginally on the S&P500. It is therefore fair to say that while major European stock indices have underperformed, some individual stocks have been great choices for investors who wish to invest in Europe’s economy.
For dividend investors it is worth mentioning that all of these five companies currently pay a dividend. In particular, the dividend growth rates for ASML and LVMH look very attractive. It has to be noted however that LVMH cut its dividend in 2020 during the COVID-19 pandemic.
Unfortunately, quality comes at a price also in Europe. If you look at the P/E ratios of these companies, they are not exactly cheap: Novo Nordisk, ASML and LVMH have currently P/E ratios of above 30.
| Security | Sector | Market cap | P/E ratio | Dividend Yield | 5 year dividend growth rate |
| Nestle | Consumer Staples | $322.55B | 20.6 | 2.73% | 6.50% |
| ASML | Information Technology | $281.84B | 34.8 | 1.04% | 29.12% |
| Novo Nordisk | Health Care | $358.22B | 31.9 | 1.48% | 6.56% |
| Roche | Health Care | $247.70B | 14.0 | 3.34% | 3.41% |
| LVMH | Consumer Discretionary | $460.73B | 30.7 | 1.67% | 22.54% |
Challenges when investing in European stocks, my perspective
This underlines that with the right picks of strong companies with good business models and growth perspectives, it is possible to invest successfully in European stocks.
Unfortunately, when investing in stocks from across Europe, including EU and non-EU countries, Euro- and non-Euro-countries, I have encountered numerous practical challenges, even as an EU based and therefore “domestic” investor:
1 – Taxation: First of all the obvious: Europe is not a country – it is a continent full of larger and smaller countries. And while the EU has harmonized many laws within its Member States, the laws regarding taxes on investment income differ from country to country. And these taxes are usually high in Europe. In addition, there is the issue of withholding taxes on dividend income from foreign securities. Within Europe, to my knowledge only the United Kingdom has no withholding tax on dividends. While there are often bilateral agreements to avoid double taxation, in some cases the total tax deduction on income from foreign shares will be significantly higher than for domestic shares.
2 – Currencies: Only 20 Member States of the EU are using the Euro as currency. Other EU and non-EU states use their own currencies. Fluctuations in exchange rates can influence companies’ profits, but also value of and income from investments in a positive or negative way. Furthermore, I find it sometimes more difficult to do research on companies which do their accounting in foreign currencies, especially when comparing them with peers from other countries.
3 – Fees: For some foreign shares, my broker charges very high trading fees. This is especially the case if I have to buy shares over a foreign stock exchange. This immediately impacts returns negatively and makes economic sense only for larger trades and is therefore a significant limitation.
4 – Management attitude to dividends: Whereas the United States are home to many companies with decade-long dividend histories, there are only few real dividend aristocrats in Europe, meaning companies that have raised the dividend year after year over a long period of time. In Europe, it seems to be much more common to cut or maintain the dividend in difficult economic times. For income-oriented investors this can be a severe setback.
5 – Policymakers attitude towards the economy: Policymakers in Europe have recently made decisions that negatively impact companies and therefore investment returns. Examples are the effects of environmental and energy policies on energy-intensive companies like chemical giant BASF SE (OTCQX:BASFY), strict alcohol and tobacco legislation and increasing market interventions in the pharmaceutical sector. Another – however extreme – example is the continuous discussion about expropriating large residential landlord companies like Vonovia (OTCPK:VONOY) in Berlin, Germany.
Please note that this is my personal experience based on my individual situation, and that the list is not exhaustive.
Summary
The concept of investing in European stocks, especially dividend stocks, is definitely not straightforward, even if you are based in Europe like me.
- Investing in stocks from the EU provides exposure to one of the world’s leading economic areas. Europe is home to well-established multinational companies whose services and products are sought after by clients from around the world, and which can be attractive investments.
- Investing in Europe via an index fund can be an easy way to gain exposure to Europe. The major European indices currently have a lower valuation and offer a higher average yield than the S& P500. However, one has to keep in mind that historically the major European indices have underperformed the S&P 500. One has to hope that the common phrase “past performance is no indication for future performance” is true here.
- There are high quality individual European stocks that have been great investments over the past years. However, investing in individual stocks from across Europe means investing in stocks from different countries with different currencies and political, legal, economical and societal circumstances. This can be seen as a positive in terms of portfolio diversification, however it can also impact shareholder returns negatively. In addition, practical difficulties around buying, holding and selling foreign shares can arise, including fees and taxation.
- I am content with my personal exposure to European stocks, but at the end of the day, every investor has to consider the difficulties and risks connected, and decide for themselves whether it is indeed worth the hassle.
Editor’s Note: This article discusses one or more securities that do not trade on a major U.S. exchange. Please be aware of the risks associated with these stocks.


