


pawel.gaul
Canada is the world’s second-leading country by total land area, second to Russia and ahead of China. Meanwhile, Canada is the thirty-eighth country by population, behind Poland and ahead of Morocco.
Canada’s ten provinces and three territories extend from the Atlantic to the Pacific and northward to the Arctic Ocean. English and French are Canada’s co-official languages, while immigration over the past years has made Chinese Mandarin and Indian Punjabi commonly spoken tongues. Meanwhile, over 75% of the country speaks English as a first language, and 23% primarily speak French.
Canada shares a 5,525-mile border with the United States, making the U.S. its leading trading partner.
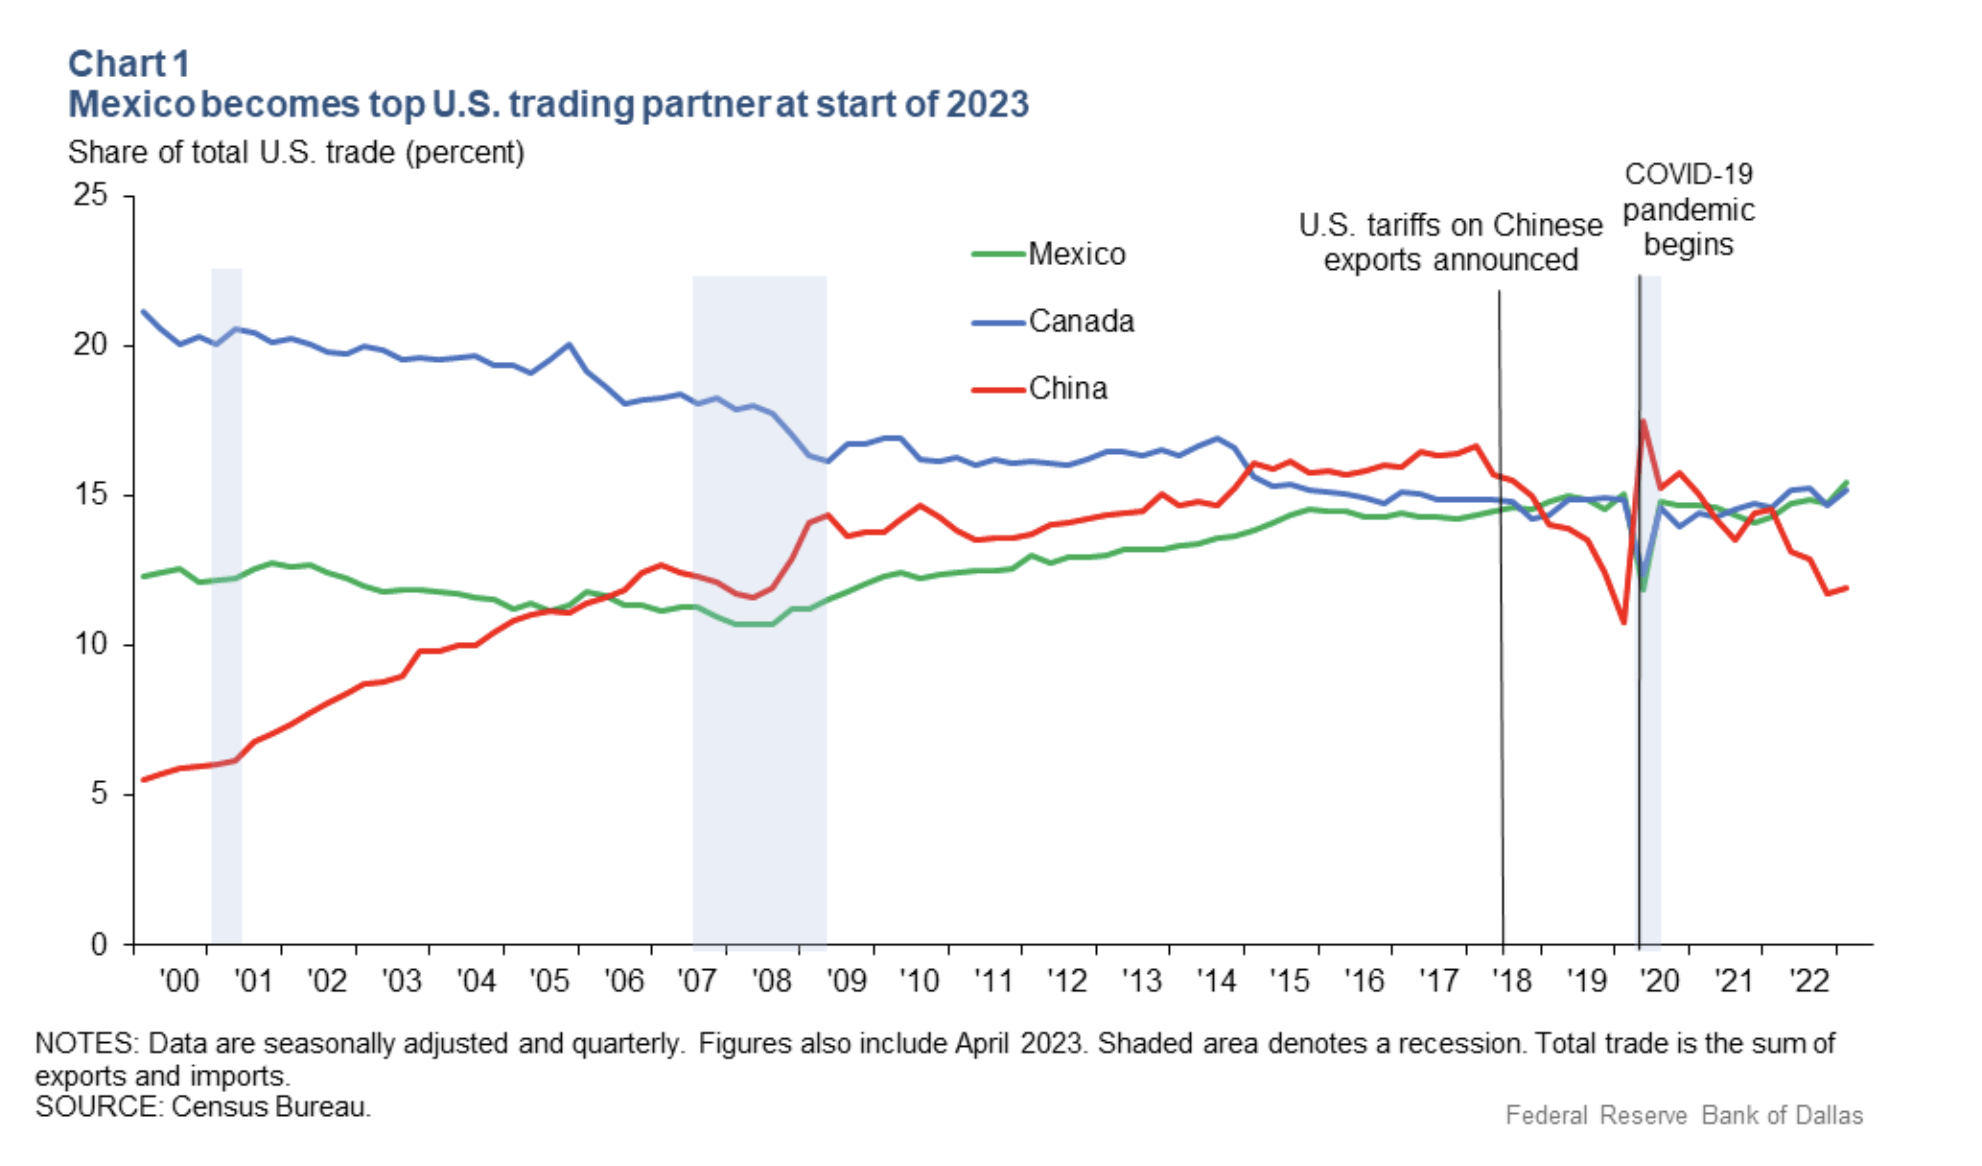
Chart of the U.S. Leading Trade Partners (Source: Dallasfed.org)
The chart shows that Canada, Mexico, and China are the U.S.’s leading trade partners.
The close and mutually beneficial economic and political relationship and cooperation between the U.S. and Canada cause low volatility in the C$ versus U.S. dollar currency pair. The Invesco CurrencyShares® Canadian Dollar Trust ETF (NYSEARCA:FXC) is the exchange-traded fund, or ETF, product that reflects changes in the Canadian dollar’s value versus the U.S. dollar.
A bearish trend since 2011 turned into a consolidation pattern
The Canadian dollar made lower highs and lower lows from 2011 through 2016.
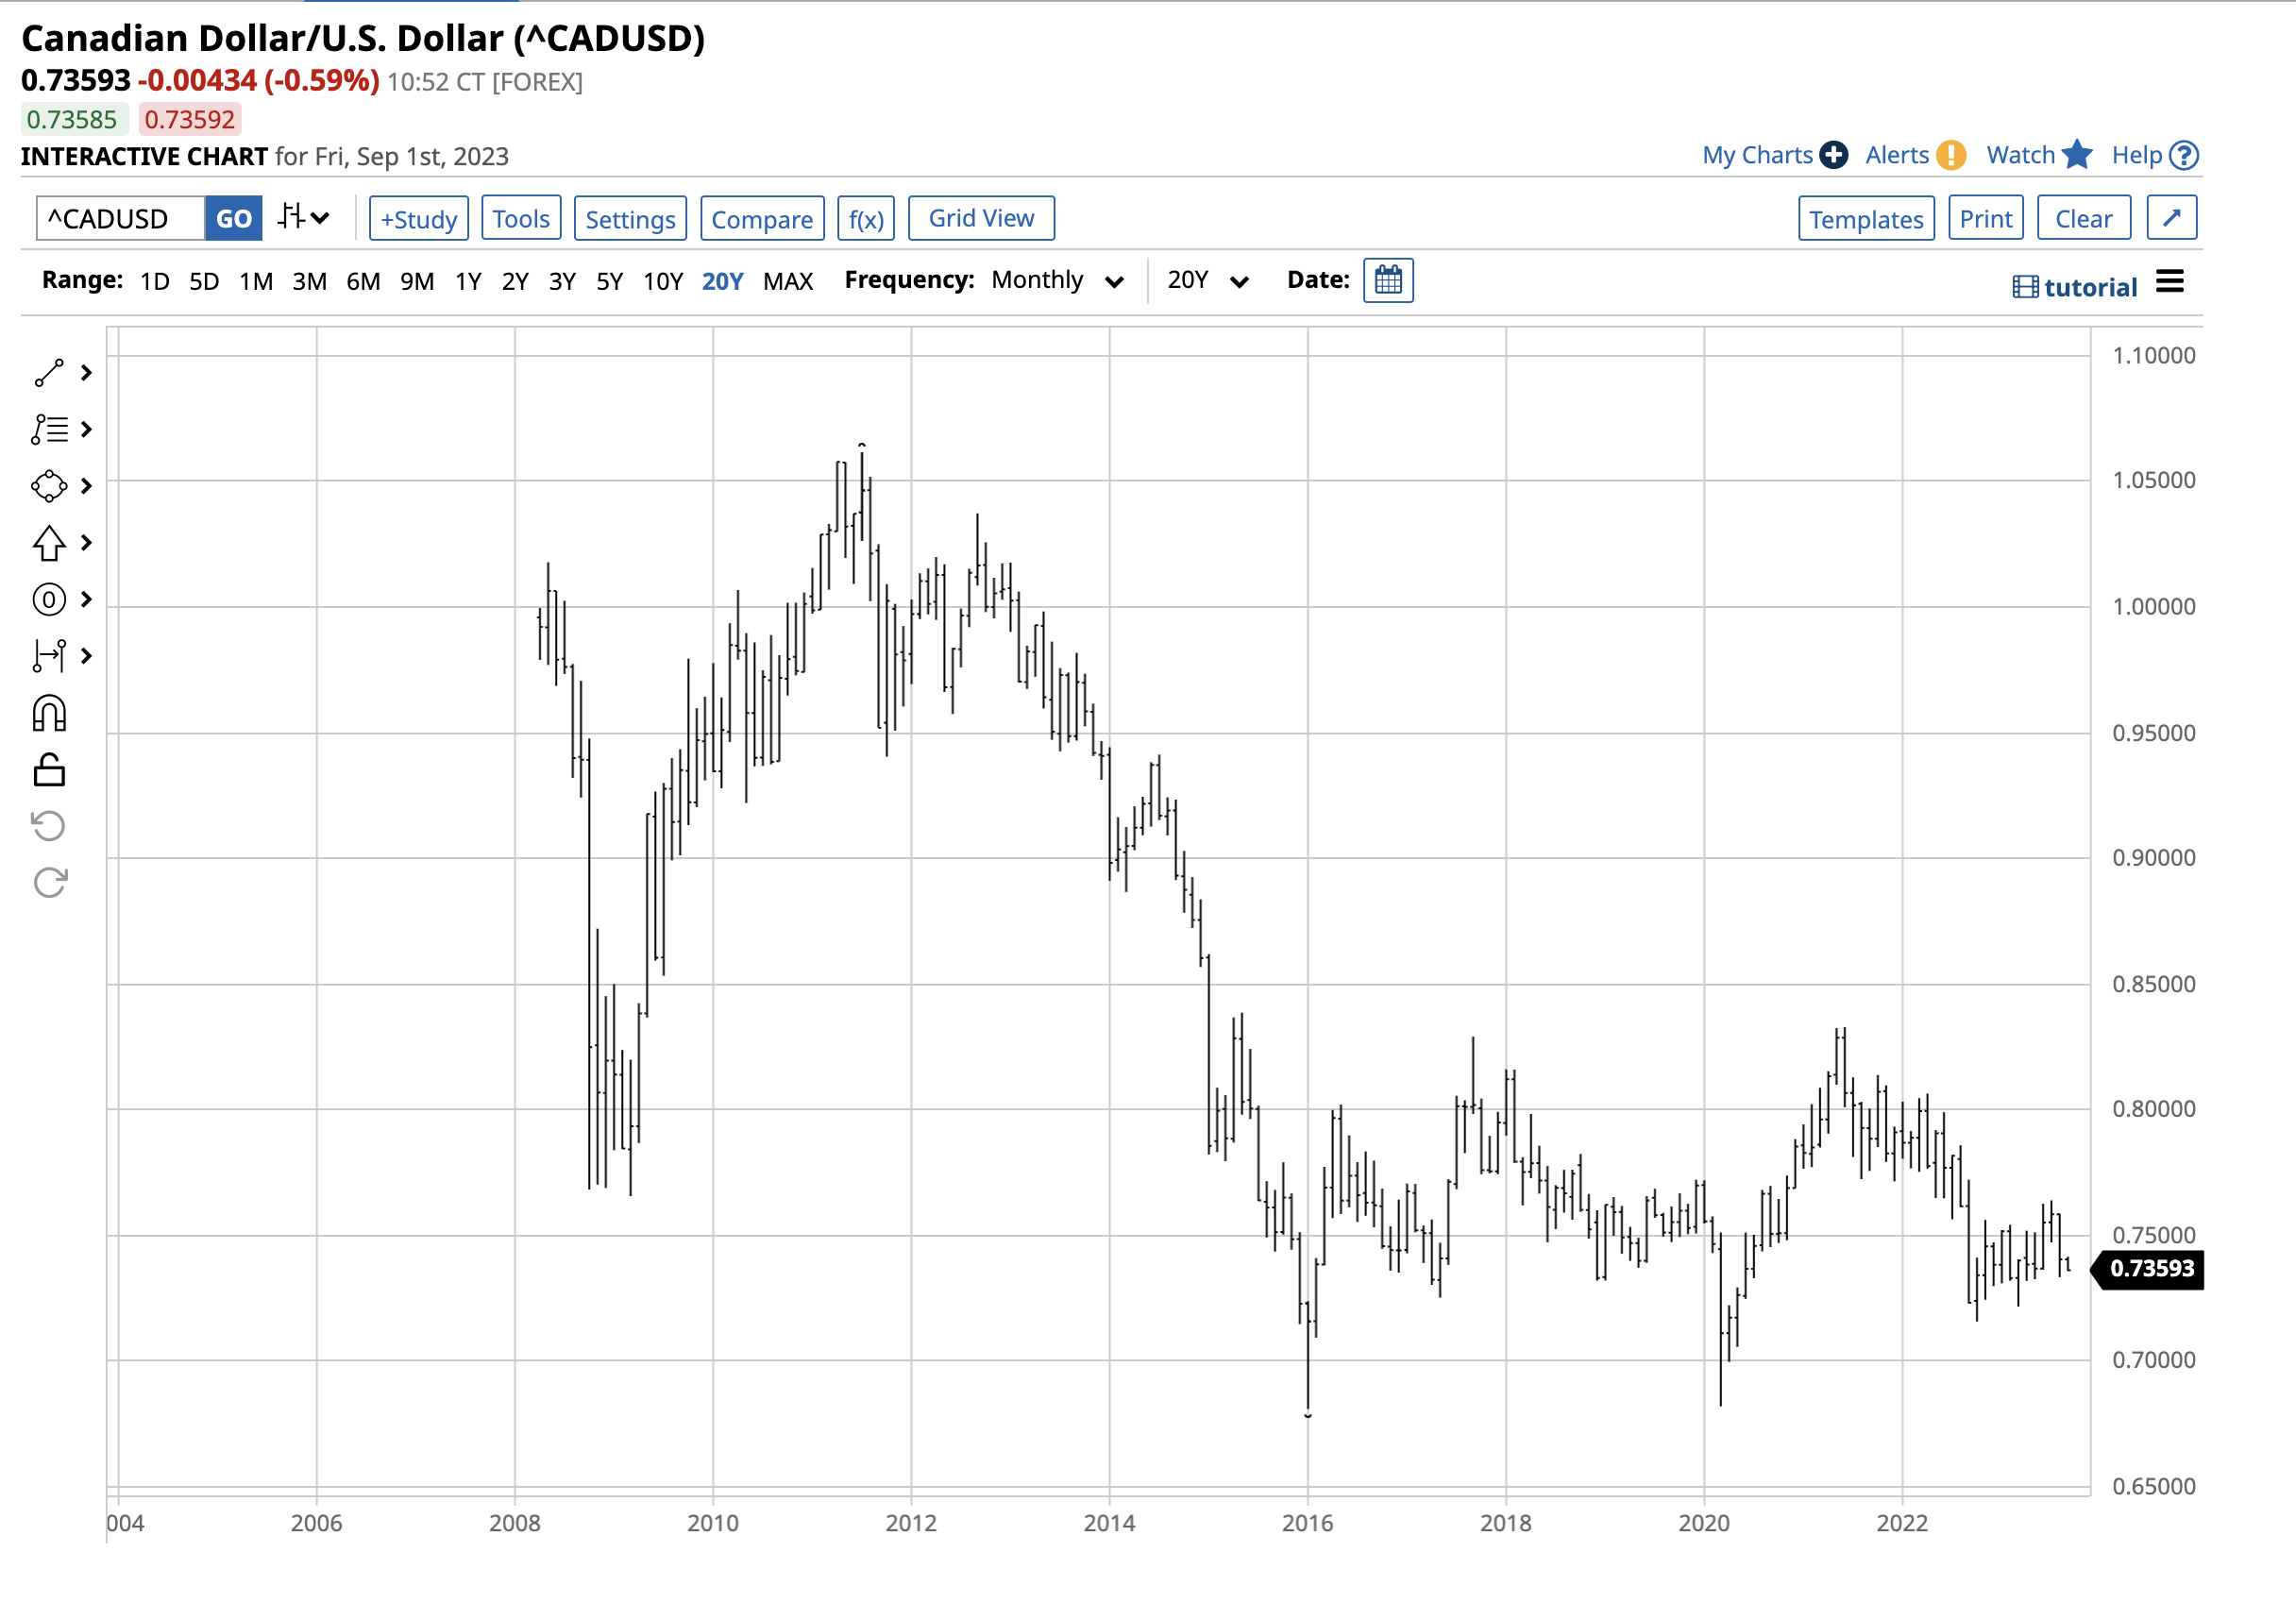
Chart of the Canadian versus the U.S. Dollar (Barchart)
The chart highlights the 35.9% decline from $1.06164 in 2011 to $0.68081 in early 2016. Since then, the currency relationship has primarily traded in a $0.70 to $0.80 range. While the C$ fell to $0.6817 against the U.S. currency in March 2020 as the global pandemic gripped markets across all asset classes and flight-to-quality buying supported the U.S. dollar, the C$ managed a slightly higher low.
Over the past seven years, the Canadian versus U.S. dollar foreign currency relationship has been in a consolidation range.
Canada is a commodity economy – The C$ peaked in 2011
In 2011, many raw material prices reached highs after the global financial crisis. Since Canada is a significant commodity-producing and exporting country, corporate profits and tax revenues caused the Canadian dollar to peak against the U.S. dollar. In early 2016, many commodity prices reached the bottoms, along with the Canadian currency.
Canada’s vast land arena, rich in natural resources, and small population make it a commodity supermarket to the world. Meanwhile, the central bank liquidity and government stimulus during the 2020 global pandemic planted inflationary seeds that bloomed and sent raw material prices to multi-year and, in some cases, all-time highs over the past three years. However, the Canadian dollar has not been able to mount a sustained rally over the $0.80 level against the U.S. dollar.
Canada and the U.S. are a political mess in 2023
The pandemic was a watershed event unleashing a wave of political division across the U.S. and Canada. Markets reflect the economic and political landscapes, which remain a mess in 2023.
Government leaders have suffered from declining support. The current and former U.S. administrations have suffered from low approval ratings. In Canada, disapproval of Prime Minister Trudeau has been between 50% and 60% since 2020. The U.S. Congress has an over 75% disapproval rating, and the Biden administration’s was 54% in August.
Voters are unhappy, creating a political hornet’s nest in the U.S. and Canada. Since voters make choices with their pocketbooks, much of the disapproval stems from rising prices and economic issues. Meanwhile, the leading opposition candidates also have low approval ratings, dividing the electorates.
Canada has a parliamentary system, with the next elections scheduled on or before October 20, 2025. The U.S. will vote for President and Congress on November 5, 2024. Given the political division, the elections are too close to call, which will likely continue to be the case. The trading range in the C$ versus the U.S. $ exchange rate will likely continue as political uncertainty in each country remains high, with neither exhibiting a clear political path for the coming years.
Rate differentials remain critical for the cross-rate
Addressing the highest inflation in decades caused the U.S. Fed to increase the short-term Fed Funds Rate from zero percent in March 2022 to a midpoint of 5.375% in early September 2023. Quantitative tightening to reduce the central bank’s swollen balance sheet pushed rates higher further along the yield curve.
Canadian rates have increased with U.S. rates, with three-month Treasury bill rates rising from almost zero in early 2022 to 5.01% in July 2023. Interest rate differentials are significant when measuring one currency’s value against another. The U.S. versus Canadian interest rate environments support the current trading range.
Safety of the U.S. favors the dollar – The potential for rising commodity prices favors the C$ – FXC is the currency pair ETF product
Interest rate differentials and similar political concerns validate the consolidation and narrow range of the Canadian dollar versus U.S. dollar currency pair. Rising inflation because of higher commodity prices favor the Canadian economy because of its exports. However, the geopolitical landscape and the bifurcation of the world’s nuclear powers favor the U.S. dollar because of its reserve currency role and flight-to-quality status. Therefore, the range will likely continue, with the optimal trading or investing strategy buying the Canadian currency on dips and selling the C$ versus the US$ on rallies.
The most direct route for a risk position in the currency pair is the over-the-counter foreign exchange market or the Chicago Mercantile Exchange’s futures. The Invesco CurrencyShares® Canadian Dollar Trust ETF trades on NYSE Arca. It provides an alternative to the FOREX or futures market for market participants seeking Canadian dollar exposure on the long or short side. FXC rises when the Canadian dollar appreciates versus the U.S. dollar.
At $71.96 per share on September 1, FXC had over $79.6 million in assets under management. FXC trades an average of 12,250 shares daily and charges a 0.40% management fee.
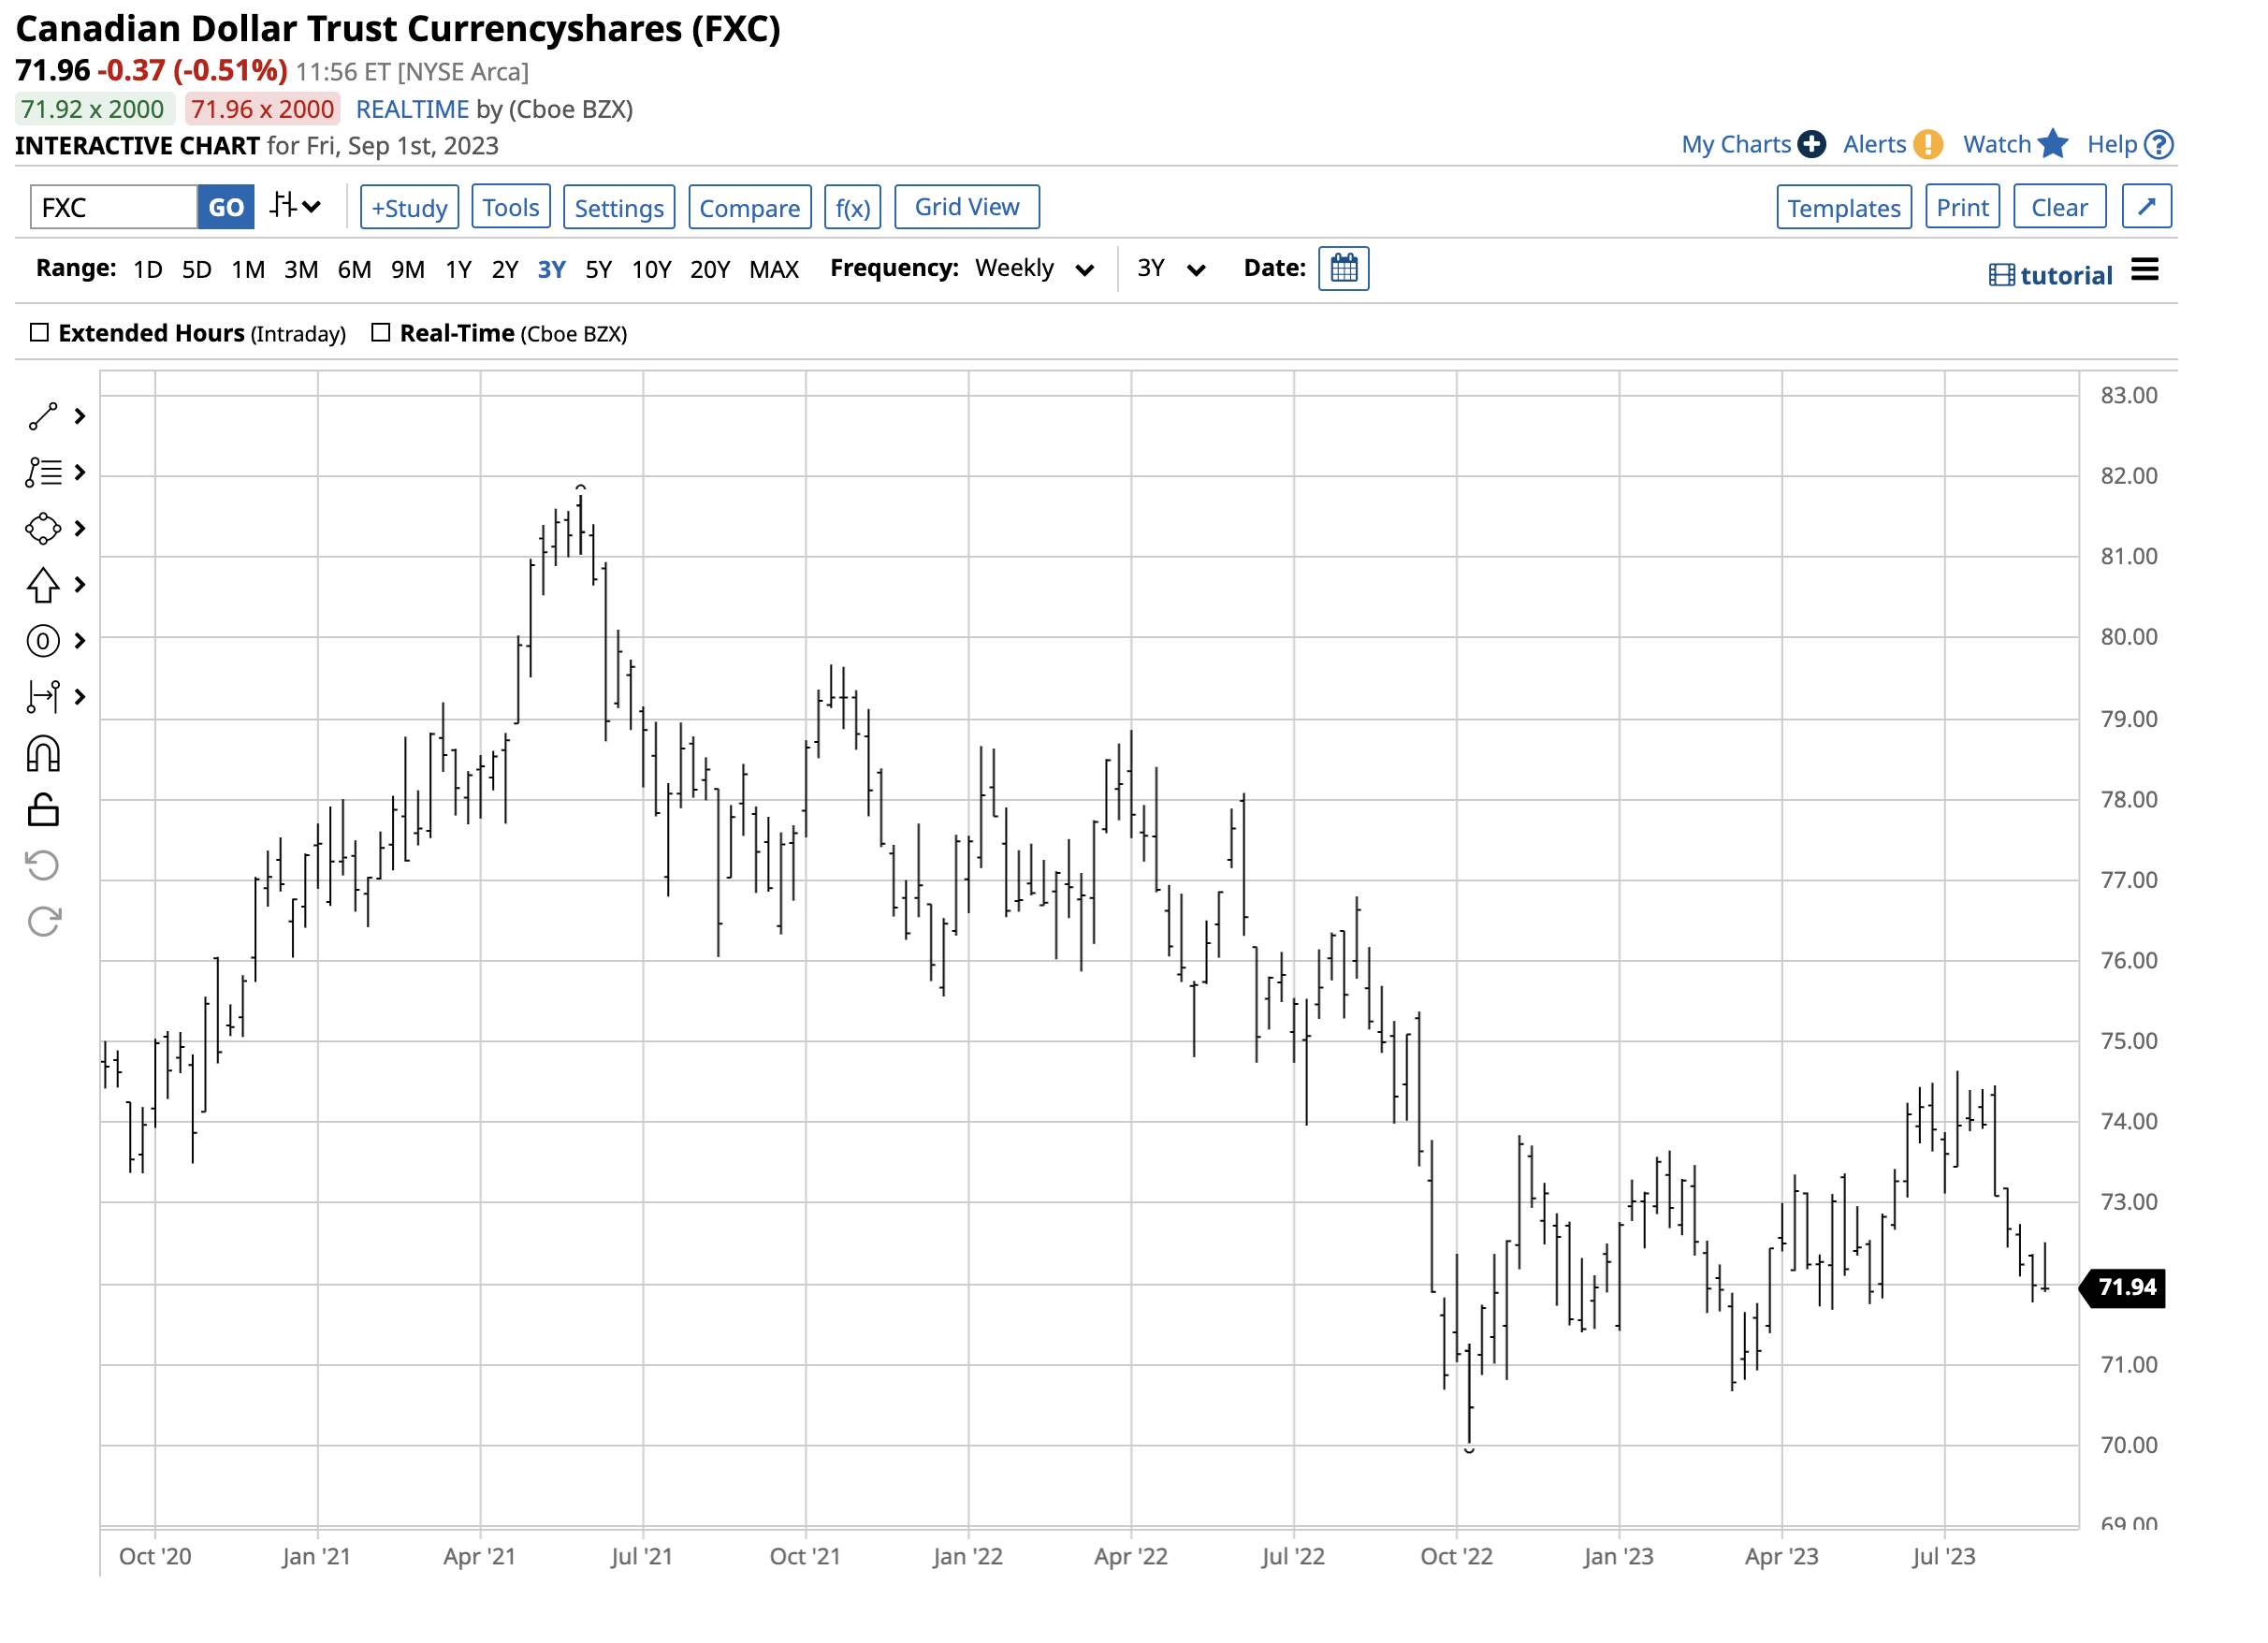
Chart of the FXC ETF Products (Barchart)
The three-year chart highlights FXC’s bearish pattern of lower highs and lower lows from May 2021 through October 2022. However, FXC has made higher lows and higher highs over the past ten months.
Technical support for FXC stands at $70.67, the March 2023 low, and $70.03, the October 2022 bottom. Resistance is at the mid-July $74.64 high.
Canada and the U.S. are close allies and trading partners, sharing a long border. The odds favor continuing a narrow trading range in the currency pair. In early September 2023, the Invesco CurrencyShares® Canadian Dollar Trust ETF trend suggests a continuation of higher lows and higher highs, but the potential for significant gains in the C$ remains low.

