

MicroStockHub/iStock via Getty Images
The British pound has declined 16.2% since peaking at a 3-year high of 1.42504 in May 2020. The question then becomes whether the currency is now ripe for the picking. Is this a good time to invest in sterling in view of a rebound?
Since reaching its all-time low of 1.03565 in September 2022, cable has rallied by 15.3%. So, it looks like momentum is picking up again. But can this new rally be sustained? And does the medium to long-term trend hold for a continued rally?
For those looking to trade or invest in sterling, the FXB ETF represents a cheap, easy, and liquid option. But before making a final decision, let’s have a look at some fundamentals for the British currency and the technical outlook for the GBPUSD currency pair.
Fundamental Analysis
Fundamental analysis for currency pairs always needs to be comparative. In this case, the FXB ETF is a play on GBPUSD. Let’s take a look at how the fundamentals of these two currencies match up. The table below shows the most recent data, and forecast for the next release of the most relevant macro data for sterling and the US dollar.

Trading Economics
GDP growth in the UK has been on the decline throughout 2022 and looks set to decline further going into H1 2023. The forecast for the next data on March 31, is for growth to improve slightly and remain flat at 0.00%.
US GDP growth was last reported at 2.90% and is expected to remain unchanged at the same level. Currently, the US is experiencing a healthier although not buoyant economy compared to the UK. Further, the outlook from the OECD for GDP growth in the two countries is in the table below:
|
Country |
2023 Forecast |
2024 Forecast |
|
UK |
-0.40% |
0.20% |
|
US |
0.50% |
1.00% |
The forecasts aren’t rosy for either economy, but the US economy looks like it will perform marginally better than the UK. Let’s look at interest rates and inflation. What I like to look at are yields. Interest rates set by the central bank are important, but it’s the asset yield that will drive capital from one currency into another.
We can see from the first table that the UK has a much higher inflation rate than the US, yet the central bank rate is slightly lower in the UK compared to the US. This may create a real yield disparity, since inflation is way higher in the UK, asset yields should be a lot higher than in the US.
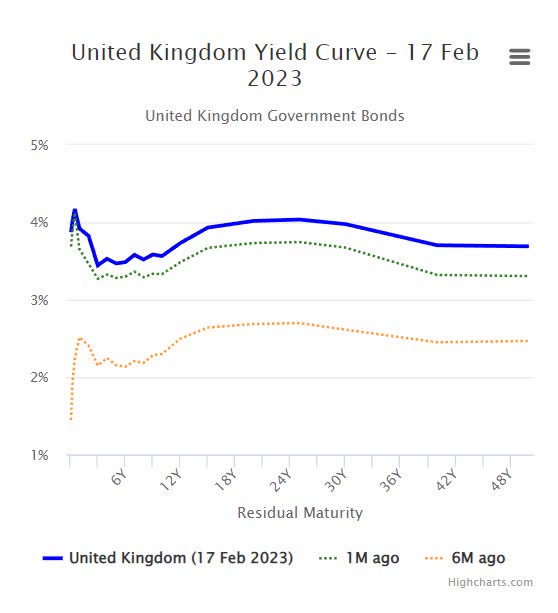
WorldGovernmentBonds.com
We can see from the two charts, above for UK yields and below for US yields, that the real yield is higher in the US than in the UK. Not only, but absolute yields are higher in the US than in the UK. There could be several reasons for this. Firstly, the QE unwinding pace of the central banks, and second, the perceived risk of default.
However, for now, the yield curves in the two countries favor the US as they have higher absolute and real yields. This situation could change if the Fed stops raising rates before the BoE and the latter continues if inflation does not decrease.
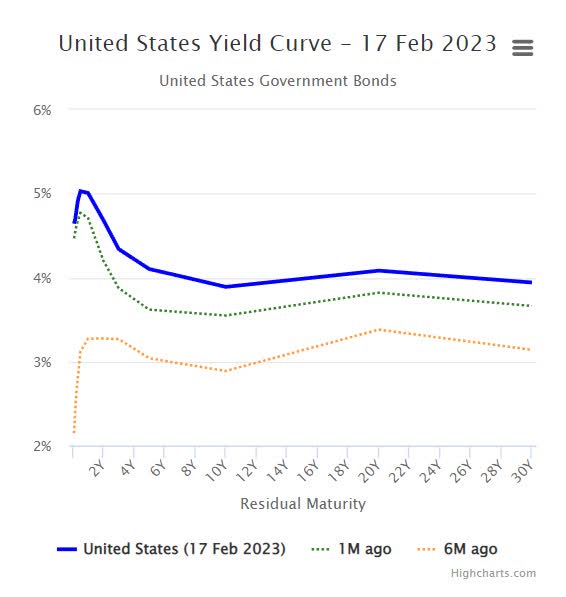
WorldGovernmentBonds.com
For now, it looks like there’s more incentive to buy dollars and sell sterling, based on what I consider to be the two largest drivers in macro factors of FX rates. Looking at unemployment and current account balance we also see a less favorable picture for the pound.
Although unemployment is very low in the UK as it is in the US, it is still slightly higher, even though marginally. The current account balance is negative for both countries, and that’s typical. However, the UK is forecast to increase its negative balance by almost 100%. This is a secondary factor from what I see, but still has its implications.
Overall, the macro fundamentals of these two currencies seem to favor the US dollar. And with the two biggest factors showing a large divergence in favor of the US, I would expect the dollar to appreciate in value over the rest of the year.
Technical Analysis
Let’s take a look at the technical outlook for this currency pair. I use the Ichimoku Kinko Hyo system and typical chart analysis with the RSI to help. Looking at the daily chart below we see an ongoing short-term bear trend.
However, that trend may be running out of momentum as price action has traded into the cloud for several days. The cloud area is a type of no man’s land with no levels of support or resistance. While the boundaries of the cloud act as support and resistance levels. The last candle is also below the blue line area of support.
Further dips below that area could mean more downside action, with the first support to be found on the belly of the cloud, around the 1.1840 area. A break below the cloud could give way to further declines with the next support around the 1.1600 level.
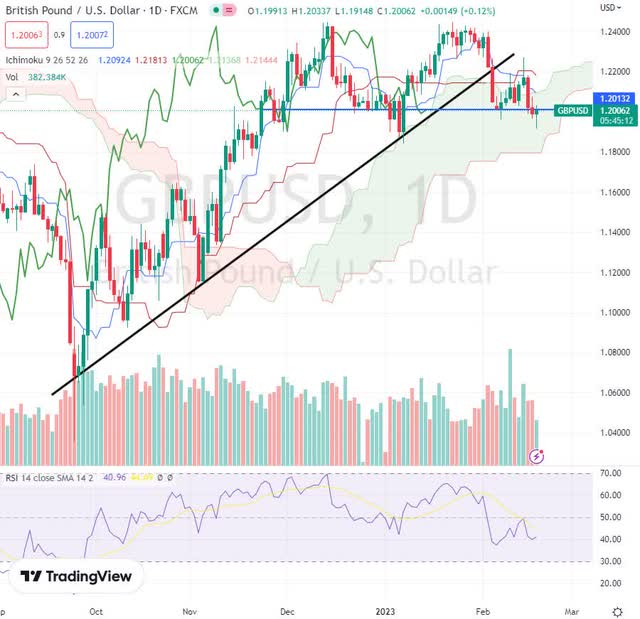
TradingView
The weekly chart below shows a clear bear trend in progress. The most recent leg higher from the low in September 2022 at 1.03565 looks like it may be running out of steam. The past 5 candles have met resistance on the lower side of the Ichimoku cloud and have been unable to go higher.
The previous 11 candles formed a support zone (blue line) with 4 touches on the area. However, this week’s price action looks like that support may be broken. Also, the last candle to print is forming an upside-down hammer.
Although this is not the typical point where we want to see this pattern, it’s still significant. The RSI is also sloping downwards, below the 50 level, and the moving average. This setup currently looks bearish, with the likely exhaustion of the correction mentioned earlier.
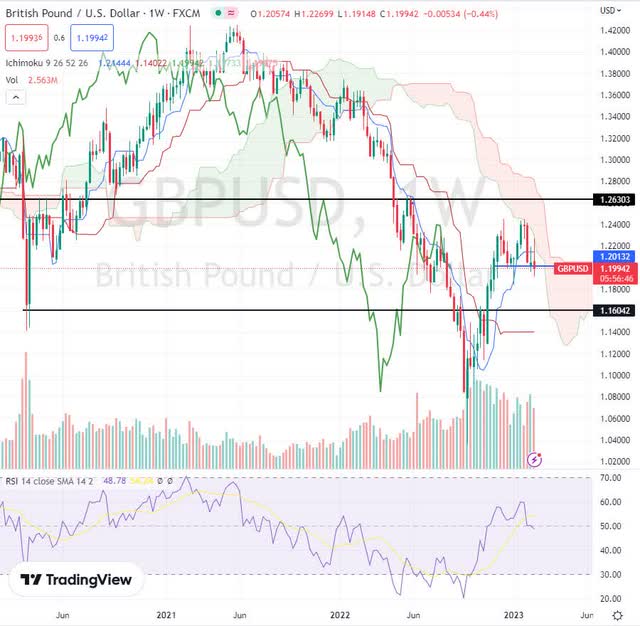
TradingView
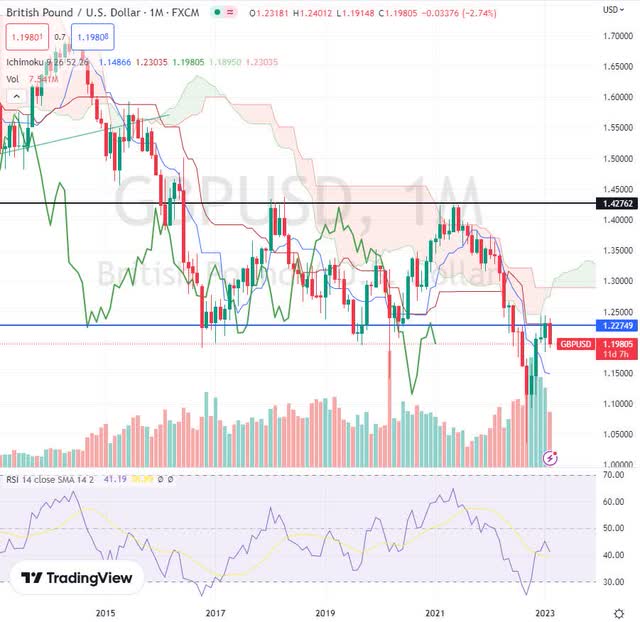
The long-term trend for GBPUSD is also bearish. With price action below the chart since January 2015. The most recent attempt to break out above the cloud failed back in May 2021. And gave way to the most recent low at 1.03565.
The retracement in price that followed has hit the resistance area (blue line) in January, and this month’s candle is showing a setup that, if completed, would be very bearish. The January candle also hit another resistance line, the slow moving average (crimson line) as well as the bottom side of the cloud.
The RSI is below 50 and if this month’s candle completes as red, will begin to dip down again. Overall, the long-term trend is bearish and further confirmation from the next weeks’ candles and the current month’s candle are needed to be conclusive.
In any case, the scenario at the moment is that of a long-term trend still underway after having experienced a retracement from an all-time low.
TradingView
Conclusion
The summary of my two aspects of analysis brings me to the conclusion that the US dollar looks likely to appreciate against the UK pound. That said, FX markets tend to be fairly volatile, but with the current macro scenario in place, I believe the GBPUSD is headed back to the range of 1.05 – 1.10.
There is certainly the possibility that cable doesn’t reach those levels. For example, if the Fed puts a halt to more hikes, or pivots earlier than expected. While at the same time, the BoE continues raising rates and perhaps more than expected.


