Source: Investing.com from 27.11.18 to 27.11.23.
Past performance is not a reliable indicator of future returns.
Just as importantly, a 5% yield from cash deposits this summer highlighted gold’s main deficiency – it produces no investment income. Now, bond markets are starting to look forward to a time when short-term interest rates are going down. The yield on 10-year US Treasuries is back at 4.4% having briefly been above 5% in late October2.
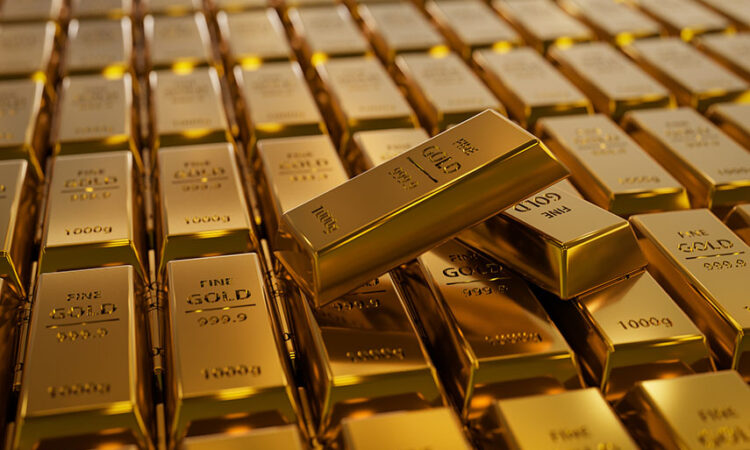
Gold has a complex personality. So far this century it has shown protective qualities in the face of multiple wars and conflicts; acted as a hedge against the devaluation of paper currencies during periods of quantitative easing; and worked as a risk asset, sometimes correlated with crypto currencies or even US technology stocks.
There’s little doubt gold retains the capacity to help protect investment portfolios in times of economic or market stress. Gold moved largely sideways in 2022, while still comfortably outpacing stock and bond markets. In 2023, treading water has been the predominant trend again. Until recently, that is.
The year ahead will undoubtedly contain risks, some of which could materialise into market shocks. Geopolitics may well stay choppy, threatening supply chains and raising energy costs. Recession risks could rise again if cash-strapped households finally capitulate at the tills. Either event would be a negative for shares.
Equally, gold bugs need to know there are always risks that could usher in a period of underperformance. For instance, a relaxation in tensions in Gaza or elsewhere would likely see gold retreat from its present levels, if only temporarily.
Furthermore, hiccups on the road to lower inflation could see interest rates staying higher for longer than markets are currently expecting.
Even so, none of these factors essentially detract from gold’s credentials as a long-term store of value or hedge against economic and market shocks. As such, gold retains its potential as a valuable tool for dampening down the effects of paper asset volatility.
How much gold to own is not an exact science. It largely depends on your personal tolerance to risk and at what stage of your investing life you find yourself. However, we could derive a starting point by comparing the relative sizes of the global gold and stock markets.
The value of the world’s above-ground gold reserves is estimated to total $13.5 trillion, or about 13% of the market value of global stock markets ($106 trillion)3.
A weighting around half this level might be appropriate for an investor with a portfolio comprising roughly equal weightings in shares and bonds. That’s assuming these assets revert to being inversely correlated with one another after the extraordinary period of positive correlations we have just lived through.
Fidelity’s Select 50 list contains two gold funds, with differing characteristics and levels of risk. The Ninety One Global Gold Fund, previously the Investec Global Gold Fund, invests in a diverse portfolio of gold mining companies worldwide while also having the flexibility to buy physical gold funds (gold ETFs) and shares in companies that mine for other precious metals.
Remember, a fund like this is unlikely to faithfully track the price of gold – it could do substantially better or worse over time. That’s because shares in gold miners are pushed and pulled by many factors, including capital spending, energy costs and new discoveries.
However, investing in the shares of gold mining companies has a potential advantage when gold is moving higher. Gold miners generally have high fixed costs, meaning that a small percentage rise in the price of gold can lead to a disproportionately large increase in gross mining profits.
The main disadvantage of this approach is that gold mining funds are ultimately still paper assets and, in extremis, not as safe as holding physical gold in a bank vault.
The second gold fund among the Select 50 – the iShares Physical Gold ETC – has a closer association to the gold price and is backed by a physical gold entitlement.
Got a burning question you want to ask? Why not drop us a line. Click here to ask an expert your question.
| (%) As at 31 Oct |
2018-2019 | 2019-2020 | 2020-2021 | 2021-2022 | 2022-2023 |
|---|---|---|---|---|---|
| Gold Price | 23.9 | 20.8 | -6.1 | -8.6 | 20.9 |
Past performance is not a reliable indicator of future returns
Source: Refinitiv from 31.10.18 to 31.10.23 in US$ terms.
1 Kitco, 28.11.23
2 Bloomberg, 28.11.23
3 World Gold Council, 08.02.23, and SIFMA, 23.10.23


