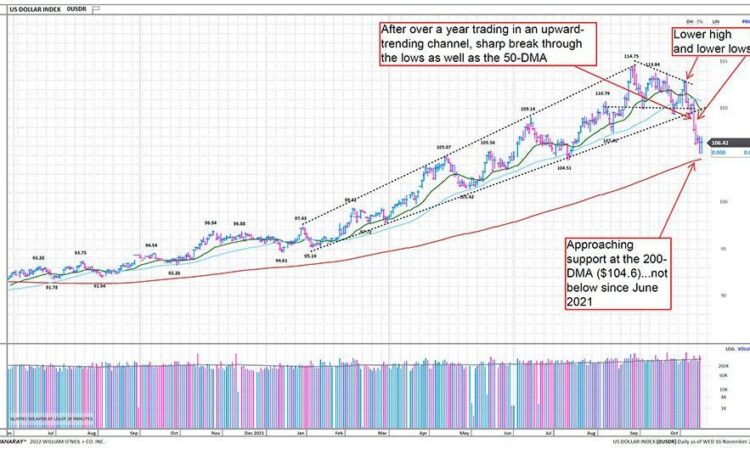
The US dollar (USD) has had a strong year versus most currencies in the world. In this article we explain this move and its impact on the global equity markets. The rise of the USD has coincided with economic weakness in many foreign nations during a time the US Federal Reserve has been increasing interest rates, which in turn has fueled demand for US Treasury Bonds and the US currency. Recently though, the trade-weighted US dollar (versus a basket of developed market currencies) has pulled back sharply due to weaker-than-expected Consumer Price Index and Producer Price Index results. This caused US long-term bonds yields to fall and the US dollar with them. As shown on the DataGraph™ below, the US dollar is testing its 200-DMA, which it has remained above since June 2021.
Daily Trade-Weighted USD (vs. euro, pound, yen, franc, krona, Australian dollar), Jul-2021 – Oct-2022
William O’Neil + Co
Looking at a longer-term monthly DataGraph below, the US dollar has had a substantial rise from its 2021 lows to its recent highs, appreciating roughly 28%. The short-term top in the dollar was confirmed by lower highs in October and early November, and then a sharp downward break of the 50-DMA last week. Given the magnitude of the upside and the sharpness of the recent breakdown, it is possible the dollar is forming a longer-term top, although it has not yet broken long-term support.
Monthly Trade-Weighted USD (vs. Euro, pound, yen, franc, krona, Australian dollar), 1993 – 2022
William O’Neil + Co
It is important to note the effects currencies have on global equity markets. The bulk of the move higher for the USD began at the start of 2022, which coincided with a peak in many global markets. Often, US dollar strength results in relative underperformance of foreign equity markets, particularly emerging markets. This is exacerbated for US-based investors holding foreign funds, as USD-based ETFs are harmed by the rising dollar. The last multiyear period of US dollar weakness (2002-2007) coincided with strong global market outperformance (in USD terms) and was especially true in emerging markets. So, the rising dollar aids US stock market relative outperformance.
Year to date (YTD) and through the recent dollar peak, the damage to other currencies was widespread as seen in the table below; some of the most affected lost between 8-20% YTD through September. The only relatively unscathed major currencies were the Brazilian real and the Mexican peso.
The combination of peaking local stock markets in late 2021 followed by currency depreciation versus the US dollar resulted in these foreign equity markets falling an average of 25% YTD through September in US dollar terms. The only markets (using popular ETFs as proxies) not down at least 20% were Brazil, India, Mexico, and Thailand as shown in the table on the next page.
Selected Non-US Global Equity Markets and Currencies Change, 12/31/2021 to 9/30/2022
William O’Neil + Co
However, the past six weeks have seen a big turnaround, with USD-traded foreign market ETFs rallying sharply as the oversold underlying equity markets and foreign currencies have strengthened.
Selected Global Currencies vs. USD, 9/30/2022 to 11/17/2022
William O’Neil + Co
A good proxy for non-US equity markets is the Vanguard Total Intl Stock Index ETF (VXUS
VXUS
However, though VXUS has attempted to bottom before in relative terms, it has not been able to break the more than decade-long downtrend of lower Relative Strength (RS) lows vs. the S&P 500. While the current ex-US ETFs did not exist pre-2008, the last time global markets had sustained outperformance (longer than 2-3 quarters) versus the US, was during the USD bear market and broad non-US rally from 2002-2007 (see USD monthly chart above).
Vanguard Total International Stock Index ETF, December 2015 to September 2022
William O’Neil + Co
At this point, it is too early to call for a repeat period of sustainable foreign market outperformance and US dollar weakness. In fact, global markets and foreign currencies still have much more to prove than the still long-term leading USD and US market. Presently, the odds are still against extended US dollar and stock market underperformance. But, if we look at ways to invest in that potential, we like the international markets leading in this shorter-term rally across the globe. Specifically, these include Italy, Germany, France, Korea, South Africa, and Mexico. These markets are up 15-25% in US dollar terms over the past six weeks and are either above their 200-DMAs or testing from the underside.
Focus Foreign Markets ETF Performance, January 2022 to November 2022
William O’Neil + Co
A few key themes that have helped foreign markets to short-term leadership include Luxury Goods in France and Italy; Industrials in Germany and Korea; Banks and Real Estate in Mexico; and Retail in South Africa, among others.
Other markets to consider potentially include Japan, which is up less recently but has a strong breadth in terms of performance in the areas of Capital Equipment, Consumer Cyclical, and Technology sectors; India, which is also up less but is a long-term global leader with strong participation from Technology, Basic Materials, Financial, and Consumer sectors; and China/Hong Kong, which has been in one the most severe of equity bear markets and for a much longer period than most. This market is starting to show emergence of new leadership in the Health Care, Capital Equipment, and Consumer Cyclical sectors.
If there is one clear winner from the pullback in the US dollar, it is global industrials. The iShares Global Industrial ETF (EXI), which seeks to track the S&P Global 1,200 Industrials Sector, is a great way to track the overall space. It is weighted 55% to the US market, but this is substantially less than the US weighting for global indices with all sectors. It contains holdings from 18 countries with large weights in aerospace/defense, machinery, building products, construction, outsourcing/ staffing/market research, diversified operations, electrical equipment, pollution control, airlines, logistics, and ships/rails. From the weekly DataGraph below, the sharp relative performance over the past two months (coinciding with the US dollar top) is quite clear, with the RS line (vs. the S&P 500) hitting a YTD high this month. The sector is well above its 40-WMA and near a test of its August peak driven by strength in the US, UK, Japan, Germany, and France, among others.
iShares Global Industrials ETF, December 2015 – September 2022
William O’Neil + Co
Conclusion
While we still recommend investors have the majority of their equity investments in the US, we do want to remain alert for a possible trend change towards foreign markets. In this regard, we will monitor the recent relative weakness in the US dollar and stock market for signs that it is time to take more aggressive positions overseas. We will also keep an eye out for more clues on what may join industrials as the next broad leadership area.
Co-Author
Kenley Scott Director, Research Analyst William O’Neil + Co., Incorporated
As the firm’s Global Sector Strategist, Kenley Scott lends his perspective to the weekly sector highlights and writes the Global Sector Strategy, which highlights emerging thematic and sector strength and weakness across 48 countries globally He also covers global Energy, Basic Material, and Transportation sectors and holds a Series 65 securities license.


