


Download Carl’s Bear Market Survival Guide e-Book:
https://www.thinkmarkets.com/au/lp/2023-bear-market-survival-guide-ebook/
Amid substantial global economic turmoil this week, and a floundering Australian dollar, forex traders await the release of the latest Australian employment data.
Tomorrow’s release promises to provide a crucial snapshot of the Australia’s labour market and could either confirm or dispel the widely held belief Australia’s labour market remains resilient in the face of building economic headwinds. Analysts’ consensus forecast is for 14,700 new jobs to have been created in July, down from the 32,600 added in June, and well below the 6-month rolling average of 36,500 jobs created.
The employment data, which is released monthly by the Australian Bureau of Statistics (ABS), is therefore expected to clearly reflect the ongoing uncertainties caused by the impact of the Reserve Bank of Australia’s (RBA) interest rate hiking cycle. Yesterday, in its monthly meeting minutes the RBA indicated it has moved to a watch and see phase of its inflation fight. “Fine calibration” as Governor Philip Lowe called it, could come in the form of small upward or downward revisions from the current official cash rate of 4.1% based upon the data.
This makes tomorrow’s employment data a very live print. A blowout past say, 40,000 jobs created, will likely bolster the case for another rate increase at Governor Lowe’s final meeting in his current role next month. A weak number, say a contraction of greater than 10,000 jobs lost, would on the other hand likely swing the balance back to maintaining the status quo (a cut is not expected in 2023), but perhaps also increase the rhetoric toward cuts earlier in 2024 than currently expected.
How to trade the Australian Employment Data
All things being equal, a hotter Australian employment report equals higher Australian interest rates, which for us forex traders equals a strong Aussie dollar. So, if we see a higher-than-expected jobs growth print, expect the Aussie dollar to appreciate against other currencies. Conversely, if we see a lower-than-expected reading for this data, expect the Aussie dollar to depreciate against other currencies.
I prefer to identify a currency the Aussie dollar has already been dominating to look for longs in should the first scenario occur, and similarly, a currency which the Aussie dollar has been convincingly weak against to look for shorts in should the second scenario occur.
Scenario 1 – Hotter than expected Australian jobs growth, Long AUDJPY
click to enlarge chart
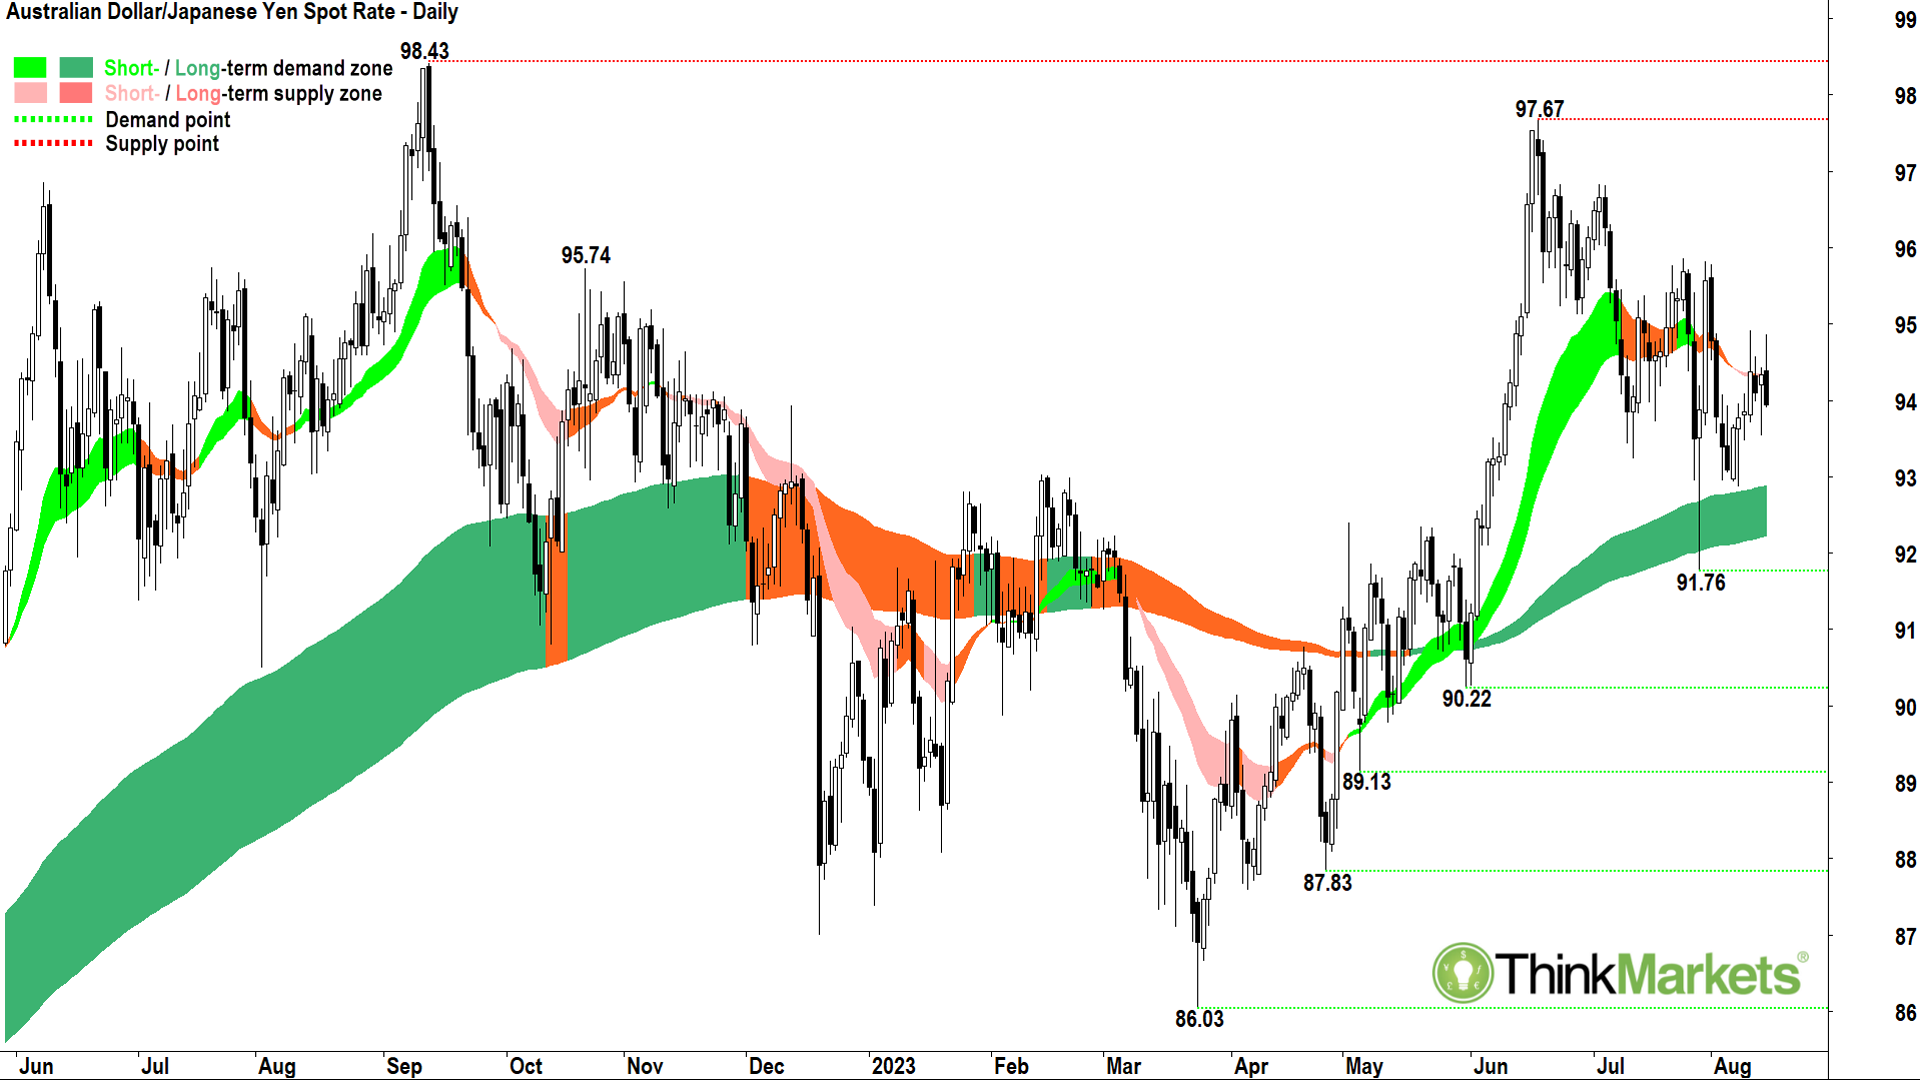
The AUDJPY chart shows the price is in a short-term downtrend (light pink ribbon) versus a well-established long-term uptrend (dark green ribbon). The price action shows lower peaks and higher troughs which indicates indecision in the demand-supply environment. The candles since 7 August are predominantly demand-side in nature (i.e., white bodies and/or downward pointing shadows), however the 10 and 15 August candles with their respective upward pointing shadows demonstrate excess supply lies in the system around 95-figure. In combination, these technical factors demonstrate near term state of equilibrium, but a longer-term state of excess demand for the Australian dollar versus the Japanese Yen.
Support is expected at the excess demand point of 92.87 (8 August) and then at 91.76 (28 July). Dynamic support at the LT trend ribbon should also be expected (approx. 93-figure). Resistance is expected at the excess supply point of 94.93 (10 August) and then at 95.87 (25 July).
Analysts view: I am comfortable adding risk to AUDJPY longs based upon a candle close near or above 94.93. The trade would be valid while the AUDUSD price continues to trade above 92.87.
Scenario 2 – Weaker than expected Australian jobs growth, Short AUDUSD
click to enlarge chart
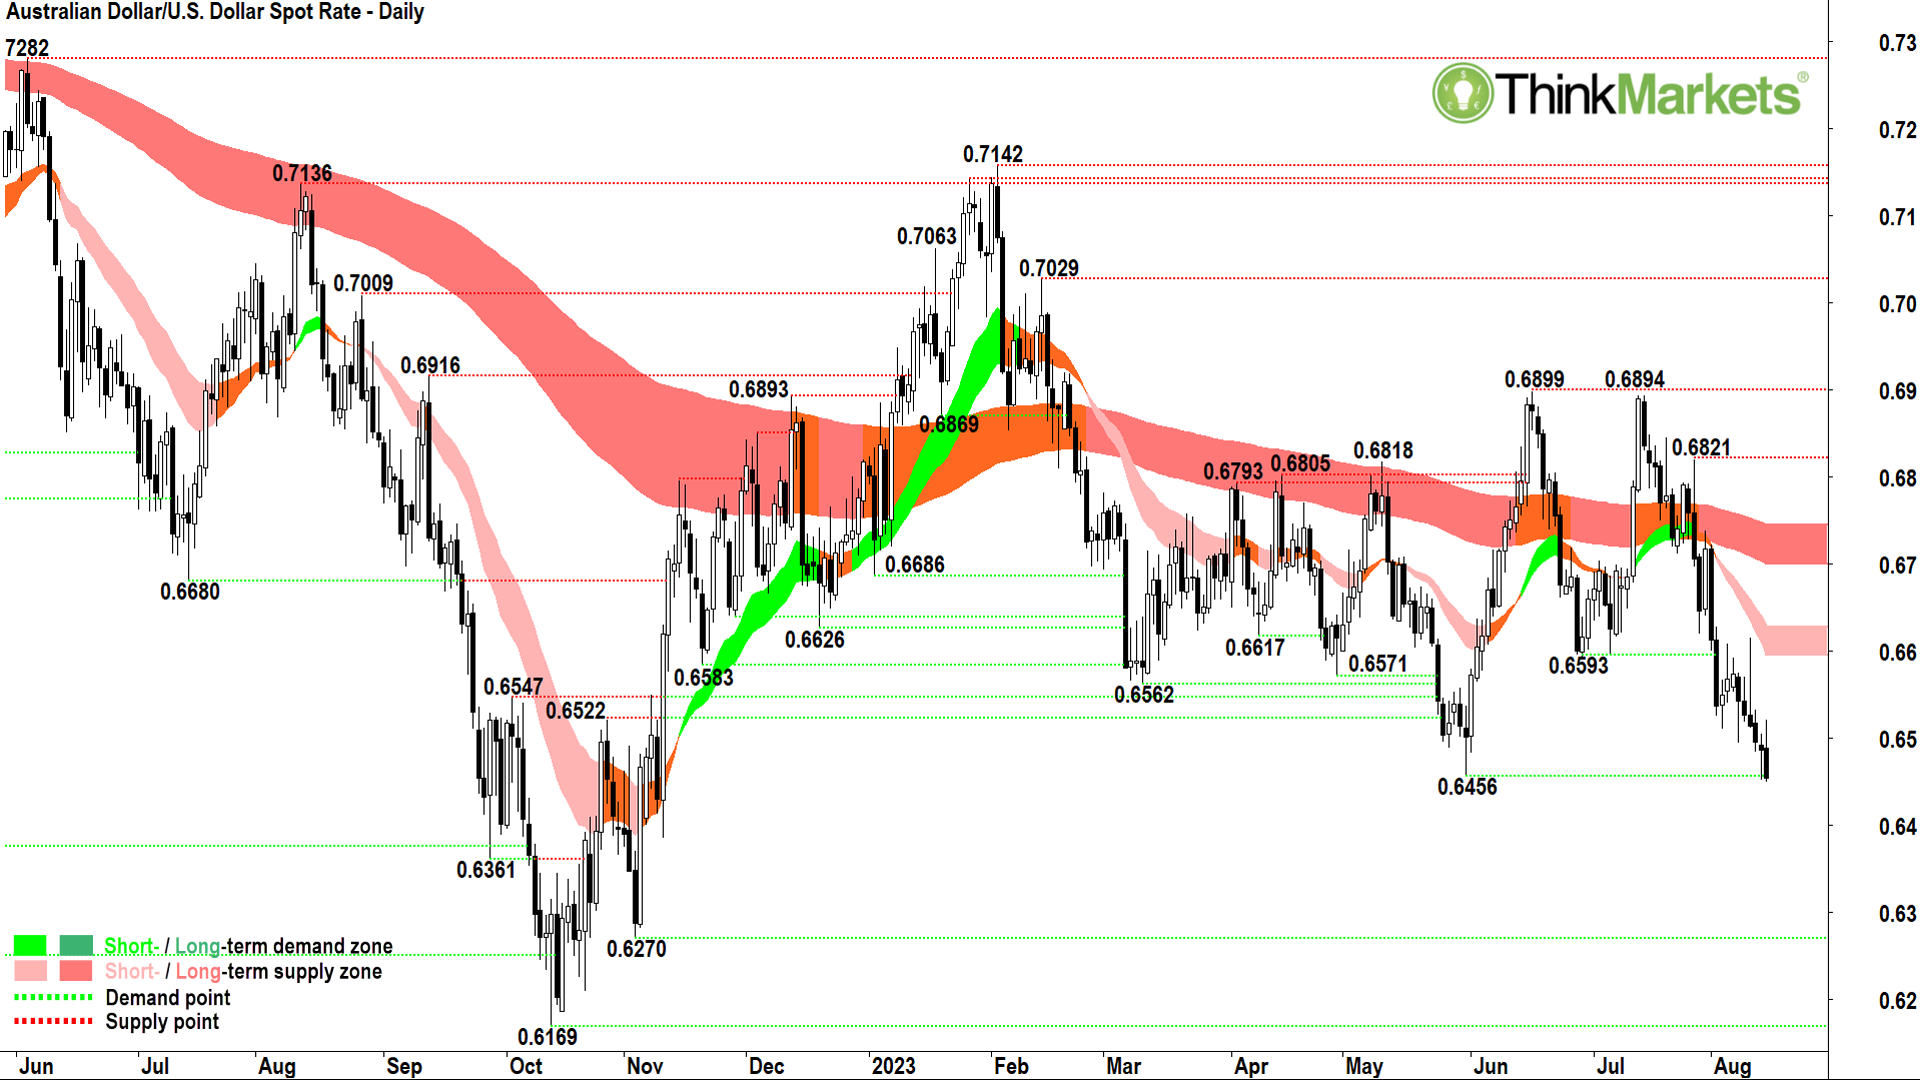
The AUDUSD chart shows the price is in a well-established short-term downtrend (light pink ribbon) and a well-established long-term downtrend (dark pink ribbon). The price action shows lower peaks and lower troughs. The candles are predominantly supply-side in nature (i.e., black bodies and/or upward pointing shadows). In combination, these technical factors demonstrate substantial excess supply for the Australian dollar versus the US dollar.
The long upward pointing shadow on 10 August confirmed 0.6593 (29 June) as a key point of supply. The high of this candle at 0.6616 should now serve as the most relevant proximal point of supply going forward. The 15 August candle closed below the 0.6456 point of demand (31 May), thus negating it as a potential point of support.
With 0.6456 dispensed with, there is little shielding the AUDUSD against a deeper correction to 0.6270 (2 November 2022), or potentially even 0.6169 (31 October 2022).
Analysts view: I am comfortable adding risk to AUDUSD shorts around the current price, or up to the 15 August candle high of 0.6522 if backed by further supply-side candles. The trade is valid while the AUDUSD price continues to trade below the short-term trend ribbon.


