
Cryptocurrency Market to grow by USD 1.8158 billion from 2022 to 2027; Rising investment in digital assets drives the market
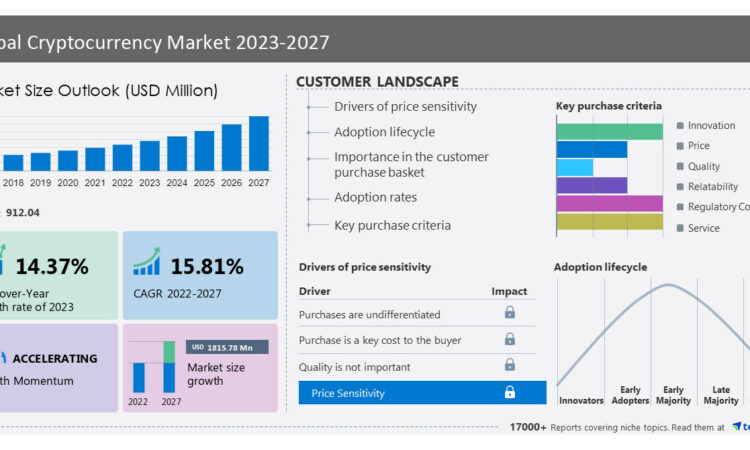
NEW YORK, Aug. 17, 2023 /PRNewswire/ — The cryptocurrency market size is expected to grow by USD 1,815.78 million from 2022 to 2027, progressing at a CAGR of 15.81% as per the latest Technavio market research report. North America is estimated to account for 48% of the global market during the forecast period. Technavio’s analysts have elaborately explained the regional trends and drivers that shape the market during the forecast period. In the cryptocurrency market, North America maintains the largest share, attributed to its numerous market participants and ongoing innovations. The rise in digital payment demand contributed to the region’s cryptocurrency growth in 2022. The United States stands out as a key influencer and leader in digital currency technological advancements. The cryptocurrency market is expected to grow during the forecast period owing to increased investments by vendors to expand their operations in the region. For more insights on the market share of various regions- Download sample report in MINUTES
Cryptocurrency Market: Rising investment in digital assets to drive growth
Rising investment in digital assets is notably driving the market. Conventional issuance and cross-border trading of securities often come with significant administrative complexities. Delays in completing transactions can lead to added costs and time lags. In contrast, digital assets offer swift ownership transfers, eliminating the need for physical document copies. For instance, with Non-Fungible Tokens (NFTs), a digital asset’s ownership can be promptly transferred to a new owner upon purchase. Cryptocurrencies are gaining popularity worldwide as digital assets due to these attributes. The rise of FinTech fosters financial market innovation, giving rise to digital assets. As digital assets become more integrated into traditional financial networks, from crypto investments to digitizing existing assets, their utilization grows. This trend is anticipated to drive the expansion of the cryptocurrency market growth during the forecast period.
Cryptocurrency Market: Acceptance Of Cryptocurrency By Retailers
The rising inclination for digital currency is an emerging trend shaping market growth. Digital currencies present the opportunity for faster and more economical bank transfers, thereby accelerating e-commerce and augmenting financial transactions in low-income nations, as well as bolstering international money transfers. Cryptocurrencies like Bitcoin carry the potential to reshape the world. Transactions conducted using digital currency reduce the vulnerability of the financial system. The system facilitates the exchange of digital currencies directly, bypassing interbank payments and the reliance on bank deposits, akin to physical cash. The appeal for a dependable, long-term store of value often drives investments in cryptocurrencies. Diverging from fiat currencies, most cryptocurrencies are bound by mathematical algorithms, which cap their supply. Despite uncertainties surrounding unregulated digital assets, the utilization of cryptocurrencies in India has surged. Particularly since 2020, investments in cryptocurrencies, particularly Bitcoin, have experienced significant growth within India. Numerous everyday investors have enlisted with domestic cryptocurrency exchanges to partake in cryptocurrency investments, a class renowned for its notable volatility and potential for substantial profits. Consequently, the inclination toward digital payments is poised to propel the advancement of the global cryptocurrency market during the forecast period.
To know about more drivers, trends along with challenges – Download a sample now!
Some of the key Cryptocurrency Market Players:
The cryptocurrency market is fragmented and the vendors are deploying organic and inorganic growth strategies to compete in the market.
Advanced Micro Devices Inc., AlphaPoint Corp., Binance Holdings Ltd., Bitfury Group Ltd., BitGo Inc., BitMain Group, Bitstamp Europe SA, BlockFi Inc., Coinbase Global Inc., ConsenSys Software Inc., iFinex Inc., Intel Corp., KuCoin, Ledger SAS, Microsoft Corp., Money Group Inc., New Bit Ventures Ltd., NVIDIA Corp., Ripple Labs Inc., and Xapo Bank Ltd.
What’s New? –
- Special coverage on the Russia–Ukraine war; global inflation; recovery analysis from COVID-19; supply chain disruptions, global trade tensions; and risk of recession
- Global competitiveness and key competitor positions
- Market presence across multiple geographical footprints – Strong/Active/Niche/Trivial – Buy the report!
Cryptocurrency Market: Segmentation Analysis
This market research report segments the cryptocurrency market by type (Bitcoin, Ethereum, and Others), component (Hardware and Software), and geography (North America, Europe, APAC, South America, and Middle East and Africa).
- The market share growth by the Bitcoin segment will be significant during the forecast period. Globally, bitcoin, the most renowned cryptocurrency, is experiencing a surge in its popularity. It stands as a notable alternative to conventional financial systems. Functioning as a digital currency, Bitcoin enables direct peer-to-peer transfers, eliminating the need for intermediaries. This cryptocurrency is widely recognized, with about 95% of cryptocurrency enthusiasts and potential users being acquainted with it. Among the top 20 cryptocurrencies, Tether, USD Coin, Binance USD, and DAI are tethered to the US dollar’s value. Cryptocurrency trading involves approximately 8% of individuals in the United States. Employing a decentralized framework termed blockchain, Bitcoin is conceived, stored, processed, and disseminated. Transactions involving Bitcoin are meticulously documented on a public ledger, with multiple replicas preserved across global servers. Given the remarkable popularity of Bitcoin, the global cryptocurrency market is poised to undergo noteworthy expansion during the forecast period.
For additional information on the market contribution of each segment – Grab an Exclusive Sample Report
To gain instant access to our 17,000+ market research reports
Technavio’s SUBSCRIPTION platform
Related Reports:
The cryptocurrency mining hardware market is estimated to grow at a CAGR of 11.35% between 2022 and 2027. The size of the market is forecast to increase by USD 12053.16 million. This report extensively covers market segmentation by product (ASIC, GPU, and others), application (bitcoin mining, ethereum mining, and others), and geography (APAC, North America, Europe, Middle East, and Africa, and South America). The profitability of cryptocurrency mining ventures is a key factor driving the global cryptocurrency mining hardware market growth.
The crypto wallet market share is expected to increase to USD 686.05 million from 2021 to 2026, and the market’s growth momentum will accelerate at a CAGR of 24.19%. This report extensively covers crypto wallet market segmentation by product (software-based and hardware-based) and geography (North America, Europe, APAC, South America, and Middle East and Africa). One of the key factors driving growth in the crypto wallet market is people’s inclination towards digital currency.
|
Cryptocurrency Market Scope |
|
|
Report Coverage |
Details |
|
Base year |
2022 |
|
Historic period |
2017-2021 |
|
Forecast period |
2023-2027 |
|
Growth momentum & CAGR |
Accelerate at a CAGR of 15.81% |
|
Market growth 2023-2027 |
USD 1,815.78 million |
|
Market structure |
Fragmented |
|
YoY growth 2022-2023 (%) |
14.37 |
|
Regional analysis |
North America, Europe, APAC, South America, and Middle East and Africa |
|
Performing market contribution |
North America at 48% |
|
Key countries |
US, China, UK, Germany, and Switzerland |
|
Competitive landscape |
Leading Vendors, Market Positioning of Vendors, Competitive Strategies, and Industry Risks |
|
Key companies profiled |
Advanced Micro Devices Inc., AlphaPoint Corp., Binance Holdings Ltd., Bitfury Group Ltd., BitGo Inc., BitMain Group, Bitstamp Europe SA, BlockFi Inc., Coinbase Global Inc., ConsenSys Software Inc., iFinex Inc., Intel Corp., KuCoin, Ledger SAS, Microsoft Corp., Money Group Inc., New Bit Ventures Ltd., NVIDIA Corp., Ripple Labs Inc., and Xapo Bank Ltd. |
|
Market dynamics |
Parent market analysis, Market growth inducers and obstacles, Fast-growing and slow-growing segment analysis, COVID-19 impact and recovery analysis and future consumer dynamics, Market condition analysis for the forecast period |
|
Customization purview |
If our report has not included the data that you are looking for, you can reach out to our analysts and get segments customized. |
Table of contents
1 Executive Summary
- 1.1 Market overview
- Exhibit 01: Executive Summary – Chart on Market Overview
- Exhibit 02: Executive Summary – Data Table on Market Overview
- Exhibit 03: Executive Summary – Chart on Global Market Characteristics
- Exhibit 04: Executive Summary – Chart on Market by Geography
- Exhibit 05: Executive Summary – Chart on Market Segmentation by Type
- Exhibit 06: Executive Summary – Chart on Market Segmentation by Component
- Exhibit 07: Executive Summary – Chart on Incremental Growth
- Exhibit 08: Executive Summary – Data Table on Incremental Growth
- Exhibit 09: Executive Summary – Chart on Vendor Market Positioning
2 Market Landscape
- 2.1 Market ecosystem
- Exhibit 10: Parent market
- Exhibit 11: Market Characteristics
3 Market Sizing
- 3.1 Market definition
- Exhibit 12: Offerings of vendors included in the market definition
- 3.2 Market segment analysis
- Exhibit 13: Market segments
- 3.4 Market outlook: Forecast for 2022-2027
- Exhibit 14: Chart on Global – Market size and forecast 2022-2027 (USD million)
- Exhibit 15: Data Table on Global – Market size and forecast 2022-2027 (USD million)
- Exhibit 16: Chart on Global Market: Year-over-year growth 2022-2027 (%)
- Exhibit 17: Data Table on Global Market: Year-over-year growth 2022-2027 (%)
4 Historic Market Size
- 4.1 Global cryptocurrency market 2017 – 2021
- Exhibit 18: Historic Market Size – Data Table on global cryptocurrency market 2017 – 2021 (USD million)
- 4.2 Type Segment Analysis 2017 – 2021
- Exhibit 19: Historic Market Size – Type Segment 2017 – 2021 (USD million)
- 4.3 Component Segment Analysis 2017 – 2021
- Exhibit 20: Historic Market Size – Component Segment 2017 – 2021 (USD million)
- 4.4 Geography Segment Analysis 2017 – 2021
- Exhibit 21: Historic Market Size – Geography Segment 2017 – 2021 (USD million)
- 4.5 Country Segment Analysis 2017 – 2021
- Exhibit 22: Historic Market Size – Country Segment 2017 – 2021 (USD million)
5 Five Forces Analysis
- 5.1 Five forces summary
- Exhibit 23: Five forces analysis – Comparison between 2022 and 2027
- 5.2 Bargaining power of buyers
- Exhibit 24: Chart on Bargaining power of buyers – Impact of key factors 2022 and 2027
- 5.3 Bargaining power of suppliers
- Exhibit 25: Bargaining power of suppliers – Impact of key factors in 2022 and 2027
- 5.4 Threat of new entrants
- Exhibit 26: Threat of new entrants – Impact of key factors in 2022 and 2027
- 5.5 Threat of substitutes
- Exhibit 27: Threat of substitutes – Impact of key factors in 2022 and 2027
- 5.6 Threat of rivalry
- Exhibit 28: Threat of rivalry – Impact of key factors in 2022 and 2027
- 5.7 Market condition
- Exhibit 29: Chart on Market condition – Five forces 2022 and 2027
6 Market Segmentation by Type
- 6.1 Market segments
- Exhibit 30: Chart on Type – Market share 2022-2027 (%)
- Exhibit 31: Data Table on Type – Market share 2022-2027 (%)
- 6.2 Comparison by Type
- Exhibit 32: Chart on Comparison by Type
- Exhibit 33: Data Table on Comparison by Type
- 6.3 Bitcoin – Market size and forecast 2022-2027
- Exhibit 34: Chart on Bitcoin – Market size and forecast 2022-2027 (USD million)
- Exhibit 35: Data Table on Bitcoin – Market size and forecast 2022-2027 (USD million)
- Exhibit 36: Chart on Bitcoin – Year-over-year growth 2022-2027 (%)
- Exhibit 37: Data Table on Bitcoin – Year-over-year growth 2022-2027 (%)
- 6.4 Ethereum – Market size and forecast 2022-2027
- Exhibit 38: Chart on Ethereum – Market size and forecast 2022-2027 (USD million)
- Exhibit 39: Data Table on Ethereum – Market size and forecast 2022-2027 (USD million)
- Exhibit 40: Chart on Ethereum – Year-over-year growth 2022-2027 (%)
- Exhibit 41: Data Table on Ethereum – Year-over-year growth 2022-2027 (%)
- 6.5 Others – Market size and forecast 2022-2027
- Exhibit 42: Chart on Others – Market size and forecast 2022-2027 (USD million)
- Exhibit 43: Data Table on Others – Market size and forecast 2022-2027 (USD million)
- Exhibit 44: Chart on Others – Year-over-year growth 2022-2027 (%)
- Exhibit 45: Data Table on Others – Year-over-year growth 2022-2027 (%)
- 6.6 Market opportunity by Type
- Exhibit 46: Market opportunity by Type (USD million)
- Exhibit 47: Data Table on Market opportunity by Type (USD million)
7 Market Segmentation by Component
- 7.1 Market segments
- Exhibit 48: Chart on Component – Market share 2022-2027 (%)
- Exhibit 49: Data Table on Component – Market share 2022-2027 (%)
- 7.2 Comparison by Component
- Exhibit 50: Chart on Comparison by Component
- Exhibit 51: Data Table on Comparison by Component
- 7.3 Hardware – Market size and forecast 2022-2027
- Exhibit 52: Chart on Hardware – Market size and forecast 2022-2027 (USD million)
- Exhibit 53: Data Table on Hardware – Market size and forecast 2022-2027 (USD million)
- Exhibit 54: Chart on Hardware – Year-over-year growth 2022-2027 (%)
- Exhibit 55: Data Table on Hardware – Year-over-year growth 2022-2027 (%)
- 7.4 Software – Market size and forecast 2022-2027
- Exhibit 56: Chart on Software – Market size and forecast 2022-2027 (USD million)
- Exhibit 57: Data Table on Software – Market size and forecast 2022-2027 (USD million)
- Exhibit 58: Chart on Software – Year-over-year growth 2022-2027 (%)
- Exhibit 59: Data Table on Software – Year-over-year growth 2022-2027 (%)
- 7.5 Market opportunity by Component
- Exhibit 60: Market opportunity by Component (USD million)
- Exhibit 61: Data Table on Market opportunity by Component (USD million)
8 Customer Landscape
- 8.1 Customer landscape overview
- Exhibit 62: Analysis of price sensitivity, lifecycle, customer purchase basket, adoption rates, and purchase criteria
9 Geographic Landscape
- 9.1 Geographic segmentation
- Exhibit 63: Chart on Market share by geography 2022-2027 (%)
- Exhibit 64: Data Table on Market share by geography 2022-2027 (%)
- 9.2 Geographic comparison
- Exhibit 65: Chart on Geographic comparison
- Exhibit 66: Data Table on Geographic comparison
- 9.3 North America – Market size and forecast 2022-2027
- Exhibit 67: Chart on North America – Market size and forecast 2022-2027 (USD million)
- Exhibit 68: Data Table on North America – Market size and forecast 2022-2027 (USD million)
- Exhibit 69: Chart on North America – Year-over-year growth 2022-2027 (%)
- Exhibit 70: Data Table on North America – Year-over-year growth 2022-2027 (%)
- 9.4 Europe – Market size and forecast 2022-2027
- Exhibit 71: Chart on Europe – Market size and forecast 2022-2027 (USD million)
- Exhibit 72: Data Table on Europe – Market size and forecast 2022-2027 (USD million)
- Exhibit 73: Chart on Europe – Year-over-year growth 2022-2027 (%)
- Exhibit 74: Data Table on Europe – Year-over-year growth 2022-2027 (%)
- 9.5 APAC – Market size and forecast 2022-2027
- Exhibit 75: Chart on APAC – Market size and forecast 2022-2027 (USD million)
- Exhibit 76: Data Table on APAC – Market size and forecast 2022-2027 (USD million)
- Exhibit 77: Chart on APAC – Year-over-year growth 2022-2027 (%)
- Exhibit 78: Data Table on APAC – Year-over-year growth 2022-2027 (%)
- 9.6 South America – Market size and forecast 2022-2027
- Exhibit 79: Chart on South America – Market size and forecast 2022-2027 (USD million)
- Exhibit 80: Data Table on South America – Market size and forecast 2022-2027 (USD million)
- Exhibit 81: Chart on South America – Year-over-year growth 2022-2027 (%)
- Exhibit 82: Data Table on South America – Year-over-year growth 2022-2027 (%)
- 9.7 Middle East and Africa – Market size and forecast 2022-2027
- Exhibit 83: Chart on Middle East and Africa – Market size and forecast 2022-2027 (USD million)
- Exhibit 84: Data Table on Middle East and Africa – Market size and forecast 2022-2027 (USD million)
- Exhibit 85: Chart on Middle East and Africa – Year-over-year growth 2022-2027 (%)
- Exhibit 86: Data Table on Middle East and Africa – Year-over-year growth 2022-2027 (%)
- 9.8 US – Market size and forecast 2022-2027
- Exhibit 87: Chart on US – Market size and forecast 2022-2027 (USD million)
- Exhibit 88: Data Table on US – Market size and forecast 2022-2027 (USD million)
- Exhibit 89: Chart on US – Year-over-year growth 2022-2027 (%)
- Exhibit 90: Data Table on US – Year-over-year growth 2022-2027 (%)
- 9.9 UK – Market size and forecast 2022-2027
- Exhibit 91: Chart on UK – Market size and forecast 2022-2027 (USD million)
- Exhibit 92: Data Table on UK – Market size and forecast 2022-2027 (USD million)
- Exhibit 93: Chart on UK – Year-over-year growth 2022-2027 (%)
- Exhibit 94: Data Table on UK – Year-over-year growth 2022-2027 (%)
- 9.10 China – Market size and forecast 2022-2027
- Exhibit 95: Chart on China – Market size and forecast 2022-2027 (USD million)
- Exhibit 96: Data Table on China – Market size and forecast 2022-2027 (USD million)
- Exhibit 97: Chart on China – Year-over-year growth 2022-2027 (%)
- Exhibit 98: Data Table on China – Year-over-year growth 2022-2027 (%)
- 9.11 Germany – Market size and forecast 2022-2027
- Exhibit 99: Chart on Germany – Market size and forecast 2022-2027 (USD million)
- Exhibit 100: Data Table on Germany – Market size and forecast 2022-2027 (USD million)
- Exhibit 101: Chart on Germany – Year-over-year growth 2022-2027 (%)
- Exhibit 102: Data Table on Germany – Year-over-year growth 2022-2027 (%)
- 9.12 Switzerland – Market size and forecast 2022-2027
- Exhibit 103: Chart on Switzerland – Market size and forecast 2022-2027 (USD million)
- Exhibit 104: Data Table on Switzerland – Market size and forecast 2022-2027 (USD million)
- Exhibit 105: Chart on Switzerland – Year-over-year growth 2022-2027 (%)
- Exhibit 106: Data Table on Switzerland – Year-over-year growth 2022-2027 (%)
- 9.13 Market opportunity by geography
- Exhibit 107: Market opportunity by geography (USD million)
- Exhibit 108: Data Tables on Market opportunity by geography (USD million)
10 Drivers, Challenges, and Trends
- 10.3 Impact of drivers and challenges
- Exhibit 109: Impact of drivers and challenges in 2022 and 2027
11 Vendor Landscape
- 11.2 Vendor landscape
- Exhibit 110: Overview on Criticality of inputs and Factors of differentiation
- 11.3 Landscape disruption
- Exhibit 111: Overview on factors of disruption
- 11.4 Industry risks
- Exhibit 112: Impact of key risks on business
12 Vendor Analysis
- 12.1 Vendors covered
- Exhibit 113: Vendors covered
- 12.2 Market positioning of vendors
- Exhibit 114: Matrix on vendor position and classification
- 12.3 Advanced Micro Devices Inc.
- Exhibit 115: Advanced Micro Devices Inc. – Overview
- Exhibit 116: Advanced Micro Devices Inc. – Business segments
- Exhibit 117: Advanced Micro Devices Inc. – Key news
- Exhibit 118: Advanced Micro Devices Inc. – Key offerings
- Exhibit 119: Advanced Micro Devices Inc. – Segment focus
- 12.4 AlphaPoint Corp.
- Exhibit 120: AlphaPoint Corp. – Overview
- Exhibit 121: AlphaPoint Corp. – Product / Service
- Exhibit 122: AlphaPoint Corp. – Key offerings
- 12.5 Binance Holdings Ltd.
- Exhibit 123: Binance Holdings Ltd. – Overview
- Exhibit 124: Binance Holdings Ltd. – Product / Service
- Exhibit 125: Binance Holdings Ltd. – Key offerings
- 12.6 Bitfury Group Ltd.
- Exhibit 126: Bitfury Group Ltd. – Overview
- Exhibit 127: Bitfury Group Ltd. – Product / Service
- Exhibit 128: Bitfury Group Ltd. – Key offerings
- 12.7 BitGo Inc.
- Exhibit 129: BitGo Inc. – Overview
- Exhibit 130: BitGo Inc. – Product / Service
- Exhibit 131: BitGo Inc. – Key offerings
- 12.8 BitMain Group
- Exhibit 132: BitMain Group – Overview
- Exhibit 133: BitMain Group – Product / Service
- Exhibit 134: BitMain Group – Key offerings
- 12.9 Bitstamp Europe SA
- Exhibit 135: Bitstamp Europe SA – Overview
- Exhibit 136: Bitstamp Europe SA – Product / Service
- Exhibit 137: Bitstamp Europe SA – Key offerings
- 12.10 Coinbase Global Inc.
- Exhibit 138: Coinbase Global Inc. – Overview
- Exhibit 139: Coinbase Global Inc. – Product / Service
- Exhibit 140: Coinbase Global Inc. – Key offerings
- 12.11 ConsenSys Software Inc.
- Exhibit 141: ConsenSys Software Inc. – Overview
- Exhibit 142: ConsenSys Software Inc. – Product / Service
- Exhibit 143: ConsenSys Software Inc. – Key offerings
- 12.12 Intel Corp.
- Exhibit 144: Intel Corp. – Overview
- Exhibit 145: Intel Corp. – Business segments
- Exhibit 146: Intel Corp. – Key news
- Exhibit 147: Intel Corp. – Key offerings
- Exhibit 148: Intel Corp. – Segment focus
- 12.13 Microsoft Corp.
- Exhibit 149: Microsoft Corp. – Overview
- Exhibit 150: Microsoft Corp. – Business segments
- Exhibit 151: Microsoft Corp. – Key news
- Exhibit 152: Microsoft Corp. – Key offerings
- Exhibit 153: Microsoft Corp. – Segment focus
- 12.14 Money Group Inc.
- Exhibit 154: Money Group Inc. – Overview
- Exhibit 155: Money Group Inc. – Business segments
- Exhibit 156: Money Group Inc. – Key offerings
- Exhibit 157: Money Group Inc. – Segment focus
- 12.15 NVIDIA Corp.
- Exhibit 158: NVIDIA Corp. – Overview
- Exhibit 159: NVIDIA Corp. – Business segments
- Exhibit 160: NVIDIA Corp. – Key news
- Exhibit 161: NVIDIA Corp. – Key offerings
- Exhibit 162: NVIDIA Corp. – Segment focus
- 12.16 Ripple Labs Inc.
- Exhibit 163: Ripple Labs Inc. – Overview
- Exhibit 164: Ripple Labs Inc. – Product / Service
- Exhibit 165: Ripple Labs Inc. – Key offerings
- 12.17 Xapo Bank Ltd.
- Exhibit 166: Xapo Bank Ltd. – Overview
- Exhibit 167: Xapo Bank Ltd. – Product / Service
- Exhibit 168: Xapo Bank Ltd. – Key offerings
13 Appendix
- 13.2 Inclusions and exclusions checklist
- Exhibit 169: Inclusions checklist
- Exhibit 170: Exclusions checklist
- 13.3 Currency conversion rates for USUSD
- Exhibit 171: Currency conversion rates for USUSD
- 13.4 Research methodology
- Exhibit 172: Research methodology
- Exhibit 173: Validation techniques employed for market sizing
- Exhibit 174: Information sources
- 13.5 List of abbreviations
- Exhibit 175: List of abbreviations
About Technavio
Technavio is a leading global technology research and advisory company. Their research and analysis focus on emerging market trends and provide actionable insights to help businesses identify market opportunities and develop effective strategies to optimize their market positions. With over 500 specialized analysts, Technavio’s report library consists of more than 17,000 reports and counting, covering 800 technologies, spanning 50 countries. Their client base consists of enterprises of all sizes, including more than 100 Fortune 500 companies. This growing client base relies on Technavio’s comprehensive coverage, extensive research, and actionable market insights to identify opportunities in existing and potential markets and assess their competitive positions within changing market scenarios.
Contacts
Technavio Research
Jesse Maida
Media & Marketing Executive
US: +1 844 364 1100
UK: +44 203 893 3200
Email: media@technavio.com
Website: www.technavio.com
SOURCE Technavio


