
Cryptocurrency Market size is set to grow by USD 1,815.78 million from 2022 to 2027 | Advanced Micro Devices Inc., AlphaPoint Corp., Binance Holdings Ltd., and more to emnerge as key players
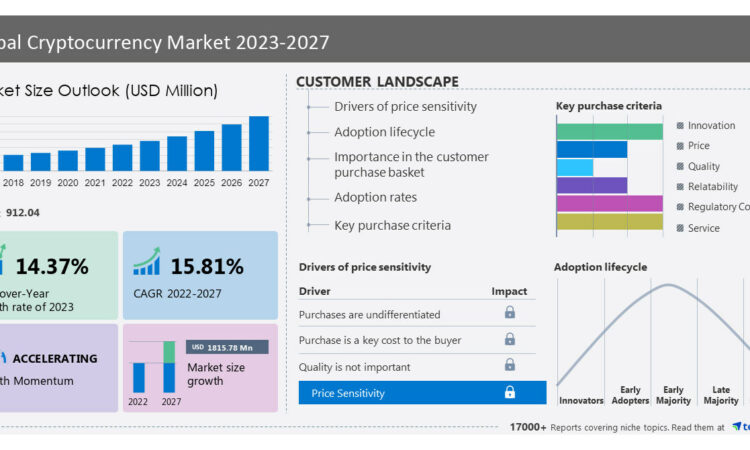
NEW YORK, July 14, 2023 /PRNewswire/ — The cryptocurrency market size is estimated to grow by USD 1,815.78 million from 2022 to 2027 at a CAGR of 15.81% according to Technavio. The growing competition in the market is compelling vendors to adopt various growth strategies such as promotional activities and spending on advertisements to improve the visibility of their services. Technavio report analyzes the market’s competitive landscape and offers information on several market vendors including Advanced Micro Devices Inc., AlphaPoint Corp., Binance Holdings Ltd., Bitfury Group Ltd., BitGo Inc., BitMain Group, Bitstamp Europe SA, BlockFi Inc., Coinbase Global Inc., ConsenSys Software Inc., iFinex Inc., Intel Corp., KuCoin, Ledger SAS, Microsoft Corp., Money Group Inc., New Bit Ventures Ltd., NVIDIA Corp., Ripple Labs Inc., and Xapo Bank Ltd.
Information Services Market Insights –
- Vendors: 15+, Including Advanced Micro Devices Inc., AlphaPoint Corp., Binance Holdings Ltd., Bitfury Group Ltd., BitGo Inc., BitMain Group, Bitstamp Europe SA, BlockFi Inc., Coinbase Global Inc., ConsenSys Software Inc., iFinex Inc., Intel Corp., KuCoin, Ledger SAS, Microsoft Corp., Money Group Inc., New Bit Ventures Ltd., NVIDIA Corp., Ripple Labs Inc., and Xapo Bank Ltd., among others
- Coverage: Parent market analysis; key drivers, major trends, and challenges; customer and vendor landscape; vendor product insights and recent developments; key vendors; and market positioning of vendors
- Segments: Type (Bitcoin, Ethereum, and Others), Component (Hardware and Software), and Geography (North America, Europe, APAC, South America, and Middle East and Africa)
To understand more about the information services market, request a sample report.
Cryptocurrency market – Customer Landscape
To help companies evaluate and develop growth strategies, the report outlines –
- Key purchase criteria
- Adoption rates
- Adoption lifecycle
- Drivers of price sensitivity
- For highlights on customer landscape analysis, download a sample!
Cryptocurrency Market – Market Dynamics
Key
Cryptocurrency Market Driver
Rising investment in digital assets is one of the major factors notably driving the market growth. Traditional securities issuance and cross-border trading often involve significant administrative burdens, resulting in additional costs and delays if transactions are not completed promptly. In contrast, digital assets enable swift ownership transfers without the need for paper documents. For instance, NFTs facilitate quick transfers of ownership when purchasing digital assets. The characteristics of digital assets, such as speed and ease of ownership transfer, have contributed to the growing popularity of cryptocurrencies in the global market. The emergence of FinTech drives financial market innovation, leading to the integration of digital assets into traditional financial networks. As more individuals engage with digital assets, from investing in cryptocurrency to digitizing existing investment assets, the investment in digital assets is expected to drive the growth of the global cryptocurrency market during the forecast period.
Significant
Cryptocurrency Market Trends
The rising inclination for digital currency is an emerging trend shaping market growth. Digital currencies have the potential to revolutionize various aspects of the financial system, such as enabling faster and more cost-effective bank transfers, facilitating e-commerce growth, and increasing financial transactions, particularly in low-income countries. Cryptocurrencies like Bitcoin can bring about significant changes worldwide. Digital currency payments offer increased security by reducing the risk of compromising the financial system, as transactions occur directly between users without the need for interbank transfers. Many individuals invest in cryptocurrencies as a reliable long-term store of value, as most digital currencies have a limited supply determined by mathematical algorithms, preventing manipulation by political parties or government organizations through inflation. Despite concerns surrounding unregulated digital assets, India has witnessed a substantial increase in cryptocurrency investments, particularly in Bitcoin, since 2020. Numerous retail investors have registered with domestic cryptocurrency exchanges, recognizing the high-profit potential and legendary volatility of cryptocurrencies as an investment class. Therefore, the growing preference for digital payments is expected to drive the growth of the global cryptocurrency market during the forecast period.
Major
Cryptocurrency Market Challenge
Volatility in the value of cryptocurrency is a significant factor hindering market growth. The highly volatile nature of cryptocurrencies makes them less attractive to low-risk investors, who tend to exclude them from their financial portfolios. The value fluctuations are primarily driven by the trading activities of a limited number of individuals who engage in bulk buying and selling on exchanges and trading platforms. For example, in June 2022, Bitcoin experienced a significant one-day drop of over 10%, following its peak value of USD 69,000 per token in November 2021. Additionally, the proposed cryptocurrency ban in India and the potential launch of a government-backed digital currency have contributed to the devaluation of several cryptocurrencies. On the Indian exchange WazirX, the coin saw a decline of more than 13%, while Shiba Inu and Dogecoin experienced drops of over 15%. The absence of transaction charges, position charges, trade posting fees, and regulatory oversight on trading platforms further adds to the volatility of cryptocurrency values. Consequently, some investors, including Accel, Ribbit Capital, and insight partners, have refrained from including cryptocurrencies in their financial portfolios. Such factors pose a challenge to the market’s growth during the forecast period.
Drivers, & Challenges have an impact on market dynamics and can impact businesses. Find some insights from a sample report!
Why Buy?
- Add credibility to strategy
- Analyzes competitor’s offerings
- Get a holistic view of the market
Grow your profit margin with Technavio- Buy the Report
What are the key data covered in this Cryptocurrency Market report?
- CAGR of the market during the forecast period
- Detailed information on factors that will drive the growth of the cryptocurrency market between 2023 and 2027
- Precise estimation of the cryptocurrency market size and its contribution to the market in focus on the parent market
- Accurate predictions about upcoming trends and changes in consumer behavior
- Growth of the cryptocurrency market across North America, Europe, APAC, South America, and the Middle East and Africa
- A thorough analysis of the market’s competitive landscape and detailed information about vendors
- Comprehensive analysis of factors that will challenge the growth of cryptocurrency market vendors
Gain instant access to 17,000+ market research reports.
Technavio’s SUBSCRIPTION platform
Related Reports:
The cryptocurrency mining hardware market is estimated to grow at a CAGR of 11.35% between 2022 and 2027. The size of the market is forecast to increase by USD 12,053.16 million. This report extensively covers market segmentation by product (ASIC, GPU, and others), application (bitcoin mining, Ethereum mining, and others), and geography (APAC, North America, Europe, Middle East, Africa, and South America). It also includes an in-depth analysis of drivers, trends, and challenges. The profitability of cryptocurrency mining ventures is a key factor driving the global cryptocurrency mining hardware market growth.
The crypto wallet market share is expected to increase to USD 686.05 million from 2021 to 2026, and the market’s growth momentum will accelerate at a CAGR of 24.19%. This report extensively covers crypto wallet market segmentation by product (software-based and hardware-based) and geography (North America, Europe, APAC, South America, and the Middle East and Africa). One of the key factors driving growth in the crypto wallet market is people’s inclination toward digital currency.
|
Cryptocurrency Market Scope |
|
|
Report Coverage |
Details |
|
Base year |
2022 |
|
Historic period |
2017-2021 |
|
Forecast period |
2023-2027 |
|
Growth momentum & CAGR |
Accelerate at a CAGR of 15.81% |
|
Market growth 2023-2027 |
USD 1,815.78 million |
|
Market structure |
Fragmented |
|
YoY growth 2022-2023 (%) |
14.37 |
|
Regional analysis |
North America, Europe, APAC, South America, and Middle East and Africa |
|
Performing market contribution |
North America at 48% |
|
Key countries |
US, China, UK, Germany, and Switzerland |
|
Competitive landscape |
Leading Vendors, Market Positioning of Vendors, Competitive Strategies, and Industry Risks |
|
Key companies profiled |
Advanced Micro Devices Inc., AlphaPoint Corp., Binance Holdings Ltd., Bitfury Group Ltd., BitGo Inc., BitMain Group, Bitstamp Europe SA, BlockFi Inc., Coinbase Global Inc., ConsenSys Software Inc., iFinex Inc., Intel Corp., KuCoin, Ledger SAS, Microsoft Corp., Money Group Inc., New Bit Ventures Ltd., NVIDIA Corp., Ripple Labs Inc., and Xapo Bank Ltd. |
|
Market dynamics |
Parent market analysis, Market growth inducers and obstacles, Fast-growing and slow-growing segment analysis, COVID-19 impact and recovery analysis and future consumer dynamics, Market condition analysis for the forecast period |
|
Customization purview |
If our report has not included the data that you are looking for, you can reach out to our analysts and get segments customized. |
Table of contents
1 Executive Summary
- 1.1 Market overview
- Exhibit 01: Executive Summary – Chart on Market Overview
- Exhibit 02: Executive Summary – Data Table on Market Overview
- Exhibit 03: Executive Summary – Chart on Global Market Characteristics
- Exhibit 04: Executive Summary – Chart on Market by Geography
- Exhibit 05: Executive Summary – Chart on Market Segmentation by Type
- Exhibit 06: Executive Summary – Chart on Market Segmentation by Component
- Exhibit 07: Executive Summary – Chart on Incremental Growth
- Exhibit 08: Executive Summary – Data Table on Incremental Growth
- Exhibit 09: Executive Summary – Chart on Vendor Market Positioning
2 Market Landscape
- 2.1 Market ecosystem
- Exhibit 10: Parent market
- Exhibit 11: Market Characteristics
3 Market Sizing
- 3.1 Market definition
- Exhibit 12: Offerings of vendors included in the market definition
- 3.2 Market segment analysis
- Exhibit 13: Market segments
- 3.4 Market outlook: Forecast for 2022-2027
- Exhibit 14: Chart on Global – Market size and forecast 2022-2027 ($ million)
- Exhibit 15: Data Table on Global – Market size and forecast 2022-2027 ($ million)
- Exhibit 16: Chart on Global Market: Year-over-year growth 2022-2027 (%)
- Exhibit 17: Data Table on Global Market: Year-over-year growth 2022-2027 (%)
4 Historic Market Size
- 4.1 Global cryptocurrency market 2017 – 2021
- Exhibit 18: Historic Market Size – Data Table on global cryptocurrency market 2017 – 2021 ($ million)
- 4.2 Type Segment Analysis 2017 – 2021
- Exhibit 19: Historic Market Size – Type Segment 2017 – 2021 ($ million)
- 4.3 Component Segment Analysis 2017 – 2021
- Exhibit 20: Historic Market Size – Component Segment 2017 – 2021 ($ million)
- 4.4 Geography Segment Analysis 2017 – 2021
- Exhibit 21: Historic Market Size – Geography Segment 2017 – 2021 ($ million)
- 4.5 Country Segment Analysis 2017 – 2021
- Exhibit 22: Historic Market Size – Country Segment 2017 – 2021 ($ million)
5 Five Forces Analysis
- 5.1 Five forces summary
- Exhibit 23: Five forces analysis – Comparison between 2022 and 2027
- 5.2 Bargaining power of buyers
- Exhibit 24: Chart on Bargaining power of buyers – Impact of key factors 2022 and 2027
- 5.3 Bargaining power of suppliers
- Exhibit 25: Bargaining power of suppliers – Impact of key factors in 2022 and 2027
- 5.4 Threat of new entrants
- Exhibit 26: Threat of new entrants – Impact of key factors in 2022 and 2027
- 5.5 Threat of substitutes
- Exhibit 27: Threat of substitutes – Impact of key factors in 2022 and 2027
- 5.6 Threat of rivalry
- Exhibit 28: Threat of rivalry – Impact of key factors in 2022 and 2027
- 5.7 Market condition
- Exhibit 29: Chart on Market condition – Five forces 2022 and 2027
6 Market Segmentation by Type
- 6.1 Market segments
- Exhibit 30: Chart on Type – Market share 2022-2027 (%)
- Exhibit 31: Data Table on Type – Market share 2022-2027 (%)
- 6.2 Comparison by Type
- Exhibit 32: Chart on Comparison by Type
- Exhibit 33: Data Table on Comparison by Type
- 6.3 Bitcoin – Market size and forecast 2022-2027
- Exhibit 34: Chart on Bitcoin – Market size and forecast 2022-2027 ($ million)
- Exhibit 35: Data Table on Bitcoin – Market size and forecast 2022-2027 ($ million)
- Exhibit 36: Chart on Bitcoin – Year-over-year growth 2022-2027 (%)
- Exhibit 37: Data Table on Bitcoin – Year-over-year growth 2022-2027 (%)
- 6.4 Ethereum – Market size and forecast 2022-2027
- Exhibit 38: Chart on Ethereum – Market size and forecast 2022-2027 ($ million)
- Exhibit 39: Data Table on Ethereum – Market size and forecast 2022-2027 ($ million)
- Exhibit 40: Chart on Ethereum – Year-over-year growth 2022-2027 (%)
- Exhibit 41: Data Table on Ethereum – Year-over-year growth 2022-2027 (%)
- 6.5 Others – Market size and forecast 2022-2027
- Exhibit 42: Chart on Others – Market size and forecast 2022-2027 ($ million)
- Exhibit 43: Data Table on Others – Market size and forecast 2022-2027 ($ million)
- Exhibit 44: Chart on Others – Year-over-year growth 2022-2027 (%)
- Exhibit 45: Data Table on Others – Year-over-year growth 2022-2027 (%)
- 6.6 Market opportunity by Type
- Exhibit 46: Market opportunity by Type ($ million)
- Exhibit 47: Data Table on Market opportunity by Type ($ million)
7 Market Segmentation by Component
- 7.1 Market segments
- Exhibit 48: Chart on Component – Market share 2022-2027 (%)
- Exhibit 49: Data Table on Component – Market share 2022-2027 (%)
- 7.2 Comparison by Component
- Exhibit 50: Chart on Comparison by Component
- Exhibit 51: Data Table on Comparison by Component
- 7.3 Hardware – Market size and forecast 2022-2027
- Exhibit 52: Chart on Hardware – Market size and forecast 2022-2027 ($ million)
- Exhibit 53: Data Table on Hardware – Market size and forecast 2022-2027 ($ million)
- Exhibit 54: Chart on Hardware – Year-over-year growth 2022-2027 (%)
- Exhibit 55: Data Table on Hardware – Year-over-year growth 2022-2027 (%)
- 7.4 Software – Market size and forecast 2022-2027
- Exhibit 56: Chart on Software – Market size and forecast 2022-2027 ($ million)
- Exhibit 57: Data Table on Software – Market size and forecast 2022-2027 ($ million)
- Exhibit 58: Chart on Software – Year-over-year growth 2022-2027 (%)
- Exhibit 59: Data Table on Software – Year-over-year growth 2022-2027 (%)
- 7.5 Market opportunity by Component
- Exhibit 60: Market opportunity by Component ($ million)
- Exhibit 61: Data Table on Market opportunity by Component ($ million)
8 Customer Landscape
- 8.1 Customer landscape overview
- Exhibit 62: Analysis of price sensitivity, lifecycle, customer purchase basket, adoption rates, and purchase criteria
9 Geographic Landscape
- 9.1 Geographic segmentation
- Exhibit 63: Chart on Market share by geography 2022-2027 (%)
- Exhibit 64: Data Table on Market share by geography 2022-2027 (%)
- 9.2 Geographic comparison
- Exhibit 65: Chart on Geographic comparison
- Exhibit 66: Data Table on Geographic comparison
- 9.3 North America – Market size and forecast 2022-2027
- Exhibit 67: Chart on North America – Market size and forecast 2022-2027 ($ million)
- Exhibit 68: Data Table on North America – Market size and forecast 2022-2027 ($ million)
- Exhibit 69: Chart on North America – Year-over-year growth 2022-2027 (%)
- Exhibit 70: Data Table on North America – Year-over-year growth 2022-2027 (%)
- 9.4 Europe – Market size and forecast 2022-2027
- Exhibit 71: Chart on Europe – Market size and forecast 2022-2027 ($ million)
- Exhibit 72: Data Table on Europe – Market size and forecast 2022-2027 ($ million)
- Exhibit 73: Chart on Europe – Year-over-year growth 2022-2027 (%)
- Exhibit 74: Data Table on Europe – Year-over-year growth 2022-2027 (%)
- 9.5 APAC – Market size and forecast 2022-2027
- Exhibit 75: Chart on APAC – Market size and forecast 2022-2027 ($ million)
- Exhibit 76: Data Table on APAC – Market size and forecast 2022-2027 ($ million)
- Exhibit 77: Chart on APAC – Year-over-year growth 2022-2027 (%)
- Exhibit 78: Data Table on APAC – Year-over-year growth 2022-2027 (%)
- 9.6 South America – Market size and forecast 2022-2027
- Exhibit 79: Chart on South America – Market size and forecast 2022-2027 ($ million)
- Exhibit 80: Data Table on South America – Market size and forecast 2022-2027 ($ million)
- Exhibit 81: Chart on South America – Year-over-year growth 2022-2027 (%)
- Exhibit 82: Data Table on South America – Year-over-year growth 2022-2027 (%)
- 9.7 Middle East and Africa – Market size and forecast 2022-2027
- Exhibit 83: Chart on Middle East and Africa – Market size and forecast 2022-2027 ($ million)
- Exhibit 84: Data Table on Middle East and Africa – Market size and forecast 2022-2027 ($ million)
- Exhibit 85: Chart on Middle East and Africa – Year-over-year growth 2022-2027 (%)
- Exhibit 86: Data Table on Middle East and Africa – Year-over-year growth 2022-2027 (%)
- 9.8 US – Market size and forecast 2022-2027
- Exhibit 87: Chart on US – Market size and forecast 2022-2027 ($ million)
- Exhibit 88: Data Table on US – Market size and forecast 2022-2027 ($ million)
- Exhibit 89: Chart on US – Year-over-year growth 2022-2027 (%)
- Exhibit 90: Data Table on US – Year-over-year growth 2022-2027 (%)
- 9.9 UK – Market size and forecast 2022-2027
- Exhibit 91: Chart on UK – Market size and forecast 2022-2027 ($ million)
- Exhibit 92: Data Table on UK – Market size and forecast 2022-2027 ($ million)
- Exhibit 93: Chart on UK – Year-over-year growth 2022-2027 (%)
- Exhibit 94: Data Table on UK – Year-over-year growth 2022-2027 (%)
- 9.10 China – Market size and forecast 2022-2027
- Exhibit 95: Chart on China – Market size and forecast 2022-2027 ($ million)
- Exhibit 96: Data Table on China – Market size and forecast 2022-2027 ($ million)
- Exhibit 97: Chart on China – Year-over-year growth 2022-2027 (%)
- Exhibit 98: Data Table on China – Year-over-year growth 2022-2027 (%)
- 9.11 Germany – Market size and forecast 2022-2027
- Exhibit 99: Chart on Germany – Market size and forecast 2022-2027 ($ million)
- Exhibit 100: Data Table on Germany – Market size and forecast 2022-2027 ($ million)
- Exhibit 101: Chart on Germany – Year-over-year growth 2022-2027 (%)
- Exhibit 102: Data Table on Germany – Year-over-year growth 2022-2027 (%)
- 9.12 Switzerland – Market size and forecast 2022-2027
- Exhibit 103: Chart on Switzerland – Market size and forecast 2022-2027 ($ million)
- Exhibit 104: Data Table on Switzerland – Market size and forecast 2022-2027 ($ million)
- Exhibit 105: Chart on Switzerland – Year-over-year growth 2022-2027 (%)
- Exhibit 106: Data Table on Switzerland – Year-over-year growth 2022-2027 (%)
- 9.13 Market opportunity by geography
- Exhibit 107: Market opportunity by geography ($ million)
- Exhibit 108: Data Tables on Market opportunity by geography ($ million)
10 Drivers, Challenges, and Trends
- 10.3 Impact of drivers and challenges
- Exhibit 109: Impact of drivers and challenges in 2022 and 2027
11 Vendor Landscape
- 11.2 Vendor landscape
- Exhibit 110: Overview on Criticality of inputs and Factors of differentiation
- 11.3 Landscape disruption
- Exhibit 111: Overview on factors of disruption
- 11.4 Industry risks
- Exhibit 112: Impact of key risks on business
12 Vendor Analysis
- 12.1 Vendors covered
- Exhibit 113: Vendors covered
- 12.2 Market positioning of vendors
- Exhibit 114: Matrix on vendor position and classification
- 12.3 Advanced Micro Devices Inc.
- Exhibit 115: Advanced Micro Devices Inc. – Overview
- Exhibit 116: Advanced Micro Devices Inc. – Business segments
- Exhibit 117: Advanced Micro Devices Inc. – Key news
- Exhibit 118: Advanced Micro Devices Inc. – Key offerings
- Exhibit 119: Advanced Micro Devices Inc. – Segment focus
- 12.4 AlphaPoint Corp.
- Exhibit 120: AlphaPoint Corp. – Overview
- Exhibit 121: AlphaPoint Corp. – Product / Service
- Exhibit 122: AlphaPoint Corp. – Key offerings
- 12.5 Binance Holdings Ltd.
- Exhibit 123: Binance Holdings Ltd. – Overview
- Exhibit 124: Binance Holdings Ltd. – Product / Service
- Exhibit 125: Binance Holdings Ltd. – Key offerings
- 12.6 Bitfury Group Ltd.
- Exhibit 126: Bitfury Group Ltd. – Overview
- Exhibit 127: Bitfury Group Ltd. – Product / Service
- Exhibit 128: Bitfury Group Ltd. – Key offerings
- 12.7 BitGo Inc.
- Exhibit 129: BitGo Inc. – Overview
- Exhibit 130: BitGo Inc. – Product / Service
- Exhibit 131: BitGo Inc. – Key offerings
- 12.8 BitMain Group
- Exhibit 132: BitMain Group – Overview
- Exhibit 133: BitMain Group – Product / Service
- Exhibit 134: BitMain Group – Key offerings
- 12.9 Bitstamp Europe SA
- Exhibit 135: Bitstamp Europe SA – Overview
- Exhibit 136: Bitstamp Europe SA – Product / Service
- Exhibit 137: Bitstamp Europe SA – Key offerings
- 12.10 Coinbase Global Inc.
- Exhibit 138: Coinbase Global Inc. – Overview
- Exhibit 139: Coinbase Global Inc. – Product / Service
- Exhibit 140: Coinbase Global Inc. – Key offerings
- 12.11 ConsenSys Software Inc.
- Exhibit 141: ConsenSys Software Inc. – Overview
- Exhibit 142: ConsenSys Software Inc. – Product / Service
- Exhibit 143: ConsenSys Software Inc. – Key offerings
- 12.12 Intel Corp.
- Exhibit 144: Intel Corp. – Overview
- Exhibit 145: Intel Corp. – Business segments
- Exhibit 146: Intel Corp. – Key news
- Exhibit 147: Intel Corp. – Key offerings
- Exhibit 148: Intel Corp. – Segment focus
- 12.13 Microsoft Corp.
- Exhibit 149: Microsoft Corp. – Overview
- Exhibit 150: Microsoft Corp. – Business segments
- Exhibit 151: Microsoft Corp. – Key news
- Exhibit 152: Microsoft Corp. – Key offerings
- Exhibit 153: Microsoft Corp. – Segment focus
- 12.14 Money Group Inc.
- Exhibit 154: Money Group Inc. – Overview
- Exhibit 155: Money Group Inc. – Business segments
- Exhibit 156: Money Group Inc. – Key offerings
- Exhibit 157: Money Group Inc. – Segment focus
- 12.15 NVIDIA Corp.
- Exhibit 158: NVIDIA Corp. – Overview
- Exhibit 159: NVIDIA Corp. – Business segments
- Exhibit 160: NVIDIA Corp. – Key news
- Exhibit 161: NVIDIA Corp. – Key offerings
- Exhibit 162: NVIDIA Corp. – Segment focus
- 12.16 Ripple Labs Inc.
- Exhibit 163: Ripple Labs Inc. – Overview
- Exhibit 164: Ripple Labs Inc. – Product / Service
- Exhibit 165: Ripple Labs Inc. – Key offerings
- 12.17 Xapo Bank Ltd.
- Exhibit 166: Xapo Bank Ltd. – Overview
- Exhibit 167: Xapo Bank Ltd. – Product / Service
- Exhibit 168: Xapo Bank Ltd. – Key offerings
13 Appendix
- 13.1 Scope of the report
- 13.2 Inclusions and exclusions checklist
- Exhibit 169: Inclusions checklist
- Exhibit 170: Exclusions checklist
- 13.3 Currency conversion rates for US$
- Exhibit 171: Currency conversion rates for US$
- 13.4 Research methodology
- Exhibit 172: Research methodology
- Exhibit 173: Validation techniques employed for market sizing
- Exhibit 174: Information sources
- 13.5 List of abbreviations
- Exhibit 175: List of abbreviations
About Us
Technavio is a leading global technology research and advisory company. Their research and analysis focus on emerging market trends and provide actionable insights to help businesses identify market opportunities and develop effective strategies to optimize their market positions. With over 500 specialized analysts, Technavio’s report library consists of more than 17,000 reports and counting, covering 800 technologies, spanning 50 countries. Their client base consists of enterprises of all sizes, including more than 100 Fortune 500 companies. This growing client base relies on Technavio’s comprehensive coverage, extensive research, and actionable market insights to identify opportunities in existing and potential markets and assess their competitive positions within changing market scenarios.
Contact
Technavio Research
Jesse Maida
Media & Marketing Executive
US: +1 844 364 1100
UK: +44 203 893 3200
Email: media@technavio.com
Website: www.technavio.com
SOURCE Technavio


