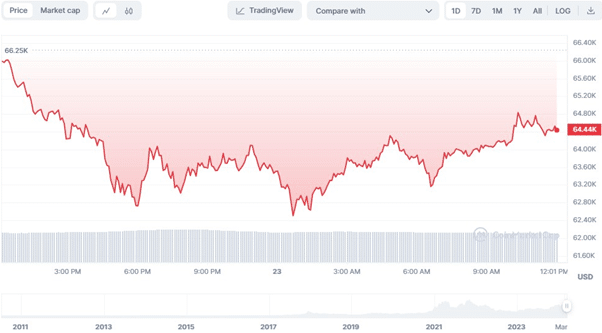

Bitcoin (BTC) has been in a recession in the last 24 hours after bullish momentum failed to breach the intra-day high of $66,364.05. The downturn in Bitcoin’s value comes amidst a broader reversal in market sentiment, which has led to a considerable number of liquidations. The current trading price of Bitcoin stands at $64,307.35, marking a decline of 2.13% within this period.
Concurrently, BTC’s market capitalization and 24-hour trading volume dipped by 2.45% and 1.15% to $1,266,478,167,402 and $39,506,130,049, respectively.

BTC/USD 24-hour price chart (source: CoinMarketCap)
Market Reversal and Liquidations
The recent downturn in Bitcoin’s price can be attributed to a swift reversal in market sentiment, which caught many investors off guard. The high volatility of cryptocurrency markets often leads to rapid changes in price direction, triggering liquidations for those holding leveraged positions.
#Bitcoin analysis update.
From the H4 timeframe, #Bitcoin‘s chart isn’t looking good.
A potential drop to $61,400 and worse case to $57,400 is actually possible.
Weekly timeframe also supports the analysis of #Bitcoin dumping pre-halving.
What do you think? pic.twitter.com/JGDQFnqjyK— Sulianto Indria Putra (@suliantoip) March 22, 2024
Data from the H4 timeframe indicates a bearish outlook for Bitcoin, with potential drops to $61,400 and, in a worst-case scenario, to $57,400 being plausible, according to some analysts. This bearish trend is further supported by the weekly timeframe, which suggests a potential dump in Bitcoin prices preceding the halving event.
Influence of the U.S. Dollar’s Recovery
Another significant factor impacting Bitcoin’s value is the strengthening of the U.S. dollar. The U.S. Dollar Index (DXY), a measure of the greenback’s performance against a basket of major world currencies, has seen an increase of 1.3% from its recent lows.
This uptick followed the release of strong economic data from the United States, including PMI surveys and a decrease in Initial Jobless Claims. The rising strength of the U.S. dollar often inversely affects Bitcoin’s value, as investors may opt for the perceived safety of fiat currencies in times of economic uncertainty.
ETF Outflows and Selling Pressure
The Bitcoin ecosystem has also been affected by continued outflows from spot Bitcoin exchange-traded funds (ETFs). These outflows mark the longest streak of net withdrawals since the ETFs’ inception, contributing to increased selling pressure on Bitcoin. Large outflows from the Grayscale Bitcoin Trust (GBTC) have been particularly notable as investors redeem their investments or migrate to more cost-effective alternatives. The cumulative effect of these outflows has had a negative net impact on Bitcoin’s market value.
According to SoSoValue, Bitcoin spot ETFs saw total net outflows of $51.6m on March 22. Grayscale ETF GBTC saw a single-day net outflow of $169m. BlackRock ETF IBIT saw single-day net inflows of just $18.89m, marking two days of record lows. Fidelity ETF FBTC saw single-day net… pic.twitter.com/BMlhtRR99b
— Wu Blockchain (@WuBlockchain) March 23, 2024
The upcoming Bitcoin halving event has also cast a shadow over the current market dynamics. Historically, halving events, which reduce the reward for mining new blocks by half, have led to increased volatility and speculative trading in the Bitcoin market.
Analysts suggest that the anticipation of the halving might be causing investors to adjust their positions, potentially leading to increased selling pressure. The event, expected to occur in the coming weeks, remains a focal point for market observers, with many debating its potential impact on Bitcoin’s future value.
BTC/USD Technical Analysis
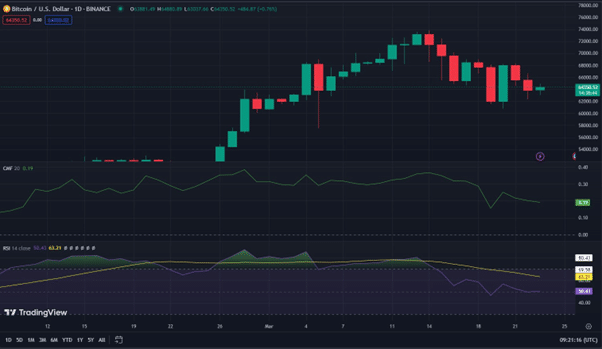
With the Chaikin Money Flow (CMF) on the BTCUSD heading southward with a rating of 0.19, the market’s negative momentum is increasing. This trend suggests that there is more selling pressure than purchasing pressure, which might lead to a further drop in the price of BTCUSD. If the CMF continues to go below zero, it might indicate a greater negative trend and the continuation of the market’s downward slide.

BTC/USD 24-hour price chart (source: TradingView)
Furthermore, the Relative Strength Index (RSI) has moved below its signal line, with a rating of 50.31, adding to the pessimistic mood in the market. This pattern indicates that selling pressure is rising, which could drive the price of BTCUSD down. If the CMF and RSI continue to display negative indications, traders may want to consider taking short positions or placing stop-loss orders to safeguard their assets.


